
PUBLISHER: Allied Market Research | PRODUCT CODE: 1414958

PUBLISHER: Allied Market Research | PRODUCT CODE: 1414958
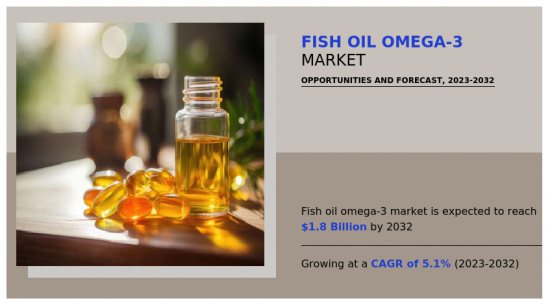
Fish Oil Omega-3 Market By Type, By Application, By Distribution Channel : Global Opportunity Analysis and Industry Forecast, 2023-2032
According to a new report published by Allied Market Research, titled, "Fish Oil Omega-3 Market," The fish oil omega-3 market was valued at $1.1 billion in 2022, and is estimated to reach $1.8 billion by 2032, growing at a CAGR of 5.1% from 2023 to 2032.
Fish oil omega-3 is a dietary product made from fatty fish like salmon, mackerel, and tuna, which are naturally rich in a type of healthy fat known as omega-3 fatty acids, often containing vitamins A and D. Many people use these supplements because they believe they may have positive effects on health. Health organizations, such as the American College of Cardiology and the American Heart Association, recommend including fish or fish oil supplements in a heart-healthy diet. This is because omega-3 fatty acids are believed to have the potential to help in preventing heart disease, promoting the well-being of the brain and eyes, and supporting the development of unborn babies.
The fish oil omega-3 market is analyzed on the basis of type, application, distribution channel, and region. By type, it is divided into anchovy, cod, herring, menhadens, mackerel, sardines, salmon, and others. As per application, it is categorized into aquaculture, dietary supplements, animal nutrition and pet food, pharmaceutical, infant formula, and others. Depending on distribution channel, it is fragmented into supermarkets-hypermarkets, departmental stores, pharmacies, B2B, and online sales channel. Region wise, it is analyzed across North America, Europe, Asia-Pacific, and LAMEA.
The outbreak of the pandemic disrupted global supply chains, which resulted in shortages of fish species used for omega-3 fish oil production. This caused delays in production and distribution activities across the globe. Furthermore, the pandemic prompted changes in consumer behavior, with a growing inclination toward preventive healthcare among consumers. This shift has rapidly driven up the demand for omega-3-rich dietary supplements, including soft gels, powders, syrups, and other fish oil omega-3 related products. Thus, this surge in demand has significantly boosted the market for fish oil omega-3 products. These changes in consumer behavior post the COVID-19 pandemic outbreak have had a positive on the fish oil omega-3 market
The popularity of fish oil omega-3 has grown as consumers have become more aware of its health advantages. With a heightened focus on health and wellness, individuals are incorporating omega-3 fish oil supplements into their daily regimens. As a result, various fish oil omega-3 products, such as capsules and powders, have gained favor among consumers. The growing demand for fish oil supplements is boosting the fish oil omega-3 market
As a result, manufacturers are continually working on innovative fish oil omega-3 products with better formulations, different delivery methods, and specific health benefits. These advancements are intended to draw in customers and maintain the market's expansion in the years ahead. Moreover, the widespread accessibility of fish oil items and omega-3 supplements in physical shops and web-based vendors offers convenience to consumers, which in turn contributes to the expansion of the fish oil omega-3 market
However, adherence to strict government regulations often necessitates significant investments in testing, quality control, and documentation, potentially leading to increased production costs for fish oil omega-3 products. An increase in the prices of basic products such as fish oil omega-3 may ultimately lead to higher prices for final products made using these oils. This price hike might have significant implications for industries dependent on fish oil, such as dietary supplements and aquaculture, as they would face increased production costs and potentially pass these expenses onto consumers. Additionally, other businesses procuring fish oil for various applications may also experience financial challenges owing to rising costs, potentially affecting their profit margins and competitiveness in the market. High regulatory barriers may also make it difficult for new entrants to penetrate the market, which may slow down innovation and competition in fish oil omega-3, ultimately limiting the market growth. Furthermore, stringent regulations may also impact international trade in fish oil omega-3 products. Export restrictions or import barriers may limit market expansion to a global scale, thus hampering the growth of fish oil omega-3 market
Furthermore, fish oil omega-3 have witnessed rapid growth in the market of North America and Europe. Rise in demand for health supplements, coupled with increase in consumer awareness about fish oil omega-3 products lead to market expansion in North America. Manufacturers are continuously investing on R&D programs to launch a variety of products in line of health and nutritional supplements. New product launches have increased demand for fish oil omega-3 in developing regions such as Asia-Pacific and the Middle East. Nowadays, consumers prefer healthy lifestyle. This has resulted in increase in demand for fish oil omega-3 oils for salad dressing and cooking purposes in households to infuse their meals with these beneficial fats. As a result, surge in demand from developing regions provides lucrative opportunities for growth of the fish oil omega-3 market.
The major players analyzed for the fish oil omega-3 industry include: Barlean's Organic Oils, L.L.C., Omega Protein Corporation, Carlson Laboratories, Inc., Olvea Fish Oils, Colpex International S.A.C, Nordic Naturals, Inc., Stepan Company, PELAGIA AS, Koninklijke DSM N.V., and GC Rieber VivoMega AS.
Key Benefits For Stakeholders
- This report provides a quantitative analysis of the market segments, current trends, estimations, and dynamics of the fish oil omega-3 market analysis from 2022 to 2032 to identify the prevailing fish oil omega-3 market opportunities.
- The market research is offered along with information related to key drivers, restraints, and opportunities.
- Porter's five forces analysis highlights the potency of buyers and suppliers to enable stakeholders make profit-oriented business decisions and strengthen their supplier-buyer network.
- In-depth analysis of the fish oil omega-3 market segmentation assists to determine the prevailing market opportunities.
- Major countries in each region are mapped according to their revenue contribution to the global market.
- Market player positioning facilitates benchmarking and provides a clear understanding of the present position of the market players.
- The report includes the analysis of the regional as well as global fish oil omega-3 market trends, key players, market segments, application areas, and market growth strategies.
Additional benefits you will get with this purchase are:
- Quarterly Update and* (only available with a corporate license, on listed price)
- 5 additional Company Profile of client Choice pre- or Post-purchase, as a free update.
- Free Upcoming Version on the Purchase of Five and Enterprise User License.
- 16 analyst hours of support* (post-purchase, if you find additional data requirements upon review of the report, you may receive support amounting to 16 analyst hours to solve questions, and post-sale queries)
- 15% Free Customization* (in case the scope or segment of the report does not match your requirements, 15% is equivalent to 3 working days of free work, applicable once)
- Free data Pack on the Five and Enterprise User License. (Excel version of the report)
- Free Updated report if the report is 6-12 months old or older.
- 24-hour priority response*
- Free Industry updates and white papers.
Possible Customization with this report (with additional cost and timeline, please talk to the sales executive to know more)
- Consumer Buying Behavior Analysis
- Industry life cycle assessment, by region
- Product Life Cycles
- Upcoming/New Entrant by Regions
- Technology Trend Analysis
- Consumer Preference and Product Specifications
- Market share analysis of players by products/segments
- New Product Development/ Product Matrix of Key Players
- Regulatory Guidelines
- Additional company profiles with specific to client's interest
- Additional country or region analysis- market size and forecast
- Brands Share Analysis
- Expanded list for Company Profiles
- Historic market data
- Key player details (including location, contact details, supplier/vendor network etc. in excel format)
- Market share analysis of players at global/region/country level
Key Market Segments
By Type
- Anchovy
- Herring
- Menhadens
- Sardines
- Salmon
- Others
- Cod
- Mackerel
By Application
- Animal Nutrition and Pet Food
- Pharmaceutical
- Infant Formula
- Others
- Aquaculture
- Dietary Supplements
By Distribution Channel
- Supermarkets-Hypermarkets
- Departmental Stores
- Pharmacies
- B2B
- Online Sales Channel
By Region
- North America
- U.S.
- Canada
- Mexico
- Europe
- Germany
- UK
- France
- Italy
- Spain
- Rest of Europe
- Asia-Pacific
- China
- Japan
- South Korea
- India
- Indonesia
- Thailand
- Malaysia
- Viet Nam
- Rest of Asia-Pacific
- LAMEA
- Brazil
- South Africa
- Argentina
- Rest of LAMEA
Key Market Players:
- Carlson Laboratories, Inc.
- Pelagia AS
- Nordic Naturals
- Olvea Fish Oils
- Barlean's Organic Oils, LLC
- Stepan Company
- GC Rieber VivoMega
- Koninklijke DSM N.V.
- Colpex International S.A.C
- Omega Protein Corporation
TABLE OF CONTENTS
CHAPTER 1: INTRODUCTION
- 1.1. Report description
- 1.2. Key market segments
- 1.3. Key benefits to the stakeholders
- 1.4. Research methodology
- 1.4.1. Primary research
- 1.4.2. Secondary research
- 1.4.3. Analyst tools and models
CHAPTER 2: EXECUTIVE SUMMARY
- 2.1. CXO Perspective
CHAPTER 3: MARKET OVERVIEW
- 3.1. Market definition and scope
- 3.2. Key findings
- 3.2.1. Top impacting factors
- 3.2.2. Top investment pockets
- 3.3. Porter's five forces analysis
- 3.3.1. High bargaining power of suppliers
- 3.3.2. High threat of new entrants
- 3.3.3. Moderate threat of substitutes
- 3.3.4. Moderate intensity of rivalry
- 3.3.5. Moderate bargaining power of buyers
- 3.4. Market dynamics
- 3.4.1. Drivers
- 3.4.1.1. Increase in aging population
- 3.4.1.2. Growth in demand for dietary supplement
- 3.4.1.3. Rise in demand from aquaculture industry
- 3.4.2. Restraints
- 3.4.2.1. Stringent government policies on fish oil products
- 3.4.2.2. Rise in concern regarding overfishing
- 3.4.2.3. Increase in demand for plant-based omega-3 products
- 3.4.3. Opportunities
- 3.4.3.1. Increased research and development of omega-3 fish oil products and formulations
- 3.4.3.2. Increase in demand from developing economies
- 3.4.1. Drivers
- 3.5. Value Chain Analysis
CHAPTER 4: FISH OIL OMEGA-3 MARKET, BY TYPE
- 4.1. Overview
- 4.1.1. Market size and forecast
- 4.2. Anchovy
- 4.2.1. Key market trends, growth factors and opportunities
- 4.2.2. Market size and forecast, by region
- 4.2.3. Market share analysis by country
- 4.3. Cod
- 4.3.1. Key market trends, growth factors and opportunities
- 4.3.2. Market size and forecast, by region
- 4.3.3. Market share analysis by country
- 4.4. Herring
- 4.4.1. Key market trends, growth factors and opportunities
- 4.4.2. Market size and forecast, by region
- 4.4.3. Market share analysis by country
- 4.5. Menhadens
- 4.5.1. Key market trends, growth factors and opportunities
- 4.5.2. Market size and forecast, by region
- 4.5.3. Market share analysis by country
- 4.6. Mackerel
- 4.6.1. Key market trends, growth factors and opportunities
- 4.6.2. Market size and forecast, by region
- 4.6.3. Market share analysis by country
- 4.7. Sardines
- 4.7.1. Key market trends, growth factors and opportunities
- 4.7.2. Market size and forecast, by region
- 4.7.3. Market share analysis by country
- 4.8. Salmon
- 4.8.1. Key market trends, growth factors and opportunities
- 4.8.2. Market size and forecast, by region
- 4.8.3. Market share analysis by country
- 4.9. Others
- 4.9.1. Key market trends, growth factors and opportunities
- 4.9.2. Market size and forecast, by region
- 4.9.3. Market share analysis by country
CHAPTER 5: FISH OIL OMEGA-3 MARKET, BY APPLICATION
- 5.1. Overview
- 5.1.1. Market size and forecast
- 5.2. Aquaculture
- 5.2.1. Key market trends, growth factors and opportunities
- 5.2.2. Market size and forecast, by region
- 5.2.3. Market share analysis by country
- 5.3. Dietary Supplements
- 5.3.1. Key market trends, growth factors and opportunities
- 5.3.2. Market size and forecast, by region
- 5.3.3. Market share analysis by country
- 5.4. Animal Nutrition and Pet Food
- 5.4.1. Key market trends, growth factors and opportunities
- 5.4.2. Market size and forecast, by region
- 5.4.3. Market share analysis by country
- 5.5. Pharmaceutical
- 5.5.1. Key market trends, growth factors and opportunities
- 5.5.2. Market size and forecast, by region
- 5.5.3. Market share analysis by country
- 5.6. Infant Formula
- 5.6.1. Key market trends, growth factors and opportunities
- 5.6.2. Market size and forecast, by region
- 5.6.3. Market share analysis by country
- 5.7. Others
- 5.7.1. Key market trends, growth factors and opportunities
- 5.7.2. Market size and forecast, by region
- 5.7.3. Market share analysis by country
CHAPTER 6: FISH OIL OMEGA-3 MARKET, BY DISTRIBUTION CHANNEL
- 6.1. Overview
- 6.1.1. Market size and forecast
- 6.2. Supermarkets-Hypermarkets
- 6.2.1. Key market trends, growth factors and opportunities
- 6.2.2. Market size and forecast, by region
- 6.2.3. Market share analysis by country
- 6.3. Departmental Stores
- 6.3.1. Key market trends, growth factors and opportunities
- 6.3.2. Market size and forecast, by region
- 6.3.3. Market share analysis by country
- 6.4. Pharmacies
- 6.4.1. Key market trends, growth factors and opportunities
- 6.4.2. Market size and forecast, by region
- 6.4.3. Market share analysis by country
- 6.5. B2B
- 6.5.1. Key market trends, growth factors and opportunities
- 6.5.2. Market size and forecast, by region
- 6.5.3. Market share analysis by country
- 6.6. Online Sales Channel
- 6.6.1. Key market trends, growth factors and opportunities
- 6.6.2. Market size and forecast, by region
- 6.6.3. Market share analysis by country
CHAPTER 7: FISH OIL OMEGA-3 MARKET, BY REGION
- 7.1. Overview
- 7.1.1. Market size and forecast By Region
- 7.2. North America
- 7.2.1. Key market trends, growth factors and opportunities
- 7.2.2. Market size and forecast, by Type
- 7.2.3. Market size and forecast, by Application
- 7.2.4. Market size and forecast, by Distribution Channel
- 7.2.5. Market size and forecast, by country
- 7.2.5.1. U.S.
- 7.2.5.1.1. Market size and forecast, by Type
- 7.2.5.1.2. Market size and forecast, by Application
- 7.2.5.1.3. Market size and forecast, by Distribution Channel
- 7.2.5.2. Canada
- 7.2.5.2.1. Market size and forecast, by Type
- 7.2.5.2.2. Market size and forecast, by Application
- 7.2.5.2.3. Market size and forecast, by Distribution Channel
- 7.2.5.3. Mexico
- 7.2.5.3.1. Market size and forecast, by Type
- 7.2.5.3.2. Market size and forecast, by Application
- 7.2.5.3.3. Market size and forecast, by Distribution Channel
- 7.3. Europe
- 7.3.1. Key market trends, growth factors and opportunities
- 7.3.2. Market size and forecast, by Type
- 7.3.3. Market size and forecast, by Application
- 7.3.4. Market size and forecast, by Distribution Channel
- 7.3.5. Market size and forecast, by country
- 7.3.5.1. Germany
- 7.3.5.1.1. Market size and forecast, by Type
- 7.3.5.1.2. Market size and forecast, by Application
- 7.3.5.1.3. Market size and forecast, by Distribution Channel
- 7.3.5.2. UK
- 7.3.5.2.1. Market size and forecast, by Type
- 7.3.5.2.2. Market size and forecast, by Application
- 7.3.5.2.3. Market size and forecast, by Distribution Channel
- 7.3.5.3. France
- 7.3.5.3.1. Market size and forecast, by Type
- 7.3.5.3.2. Market size and forecast, by Application
- 7.3.5.3.3. Market size and forecast, by Distribution Channel
- 7.3.5.4. Italy
- 7.3.5.4.1. Market size and forecast, by Type
- 7.3.5.4.2. Market size and forecast, by Application
- 7.3.5.4.3. Market size and forecast, by Distribution Channel
- 7.3.5.5. Spain
- 7.3.5.5.1. Market size and forecast, by Type
- 7.3.5.5.2. Market size and forecast, by Application
- 7.3.5.5.3. Market size and forecast, by Distribution Channel
- 7.3.5.6. Rest of Europe
- 7.3.5.6.1. Market size and forecast, by Type
- 7.3.5.6.2. Market size and forecast, by Application
- 7.3.5.6.3. Market size and forecast, by Distribution Channel
- 7.4. Asia-Pacific
- 7.4.1. Key market trends, growth factors and opportunities
- 7.4.2. Market size and forecast, by Type
- 7.4.3. Market size and forecast, by Application
- 7.4.4. Market size and forecast, by Distribution Channel
- 7.4.5. Market size and forecast, by country
- 7.4.5.1. China
- 7.4.5.1.1. Market size and forecast, by Type
- 7.4.5.1.2. Market size and forecast, by Application
- 7.4.5.1.3. Market size and forecast, by Distribution Channel
- 7.4.5.2. Japan
- 7.4.5.2.1. Market size and forecast, by Type
- 7.4.5.2.2. Market size and forecast, by Application
- 7.4.5.2.3. Market size and forecast, by Distribution Channel
- 7.4.5.3. South Korea
- 7.4.5.3.1. Market size and forecast, by Type
- 7.4.5.3.2. Market size and forecast, by Application
- 7.4.5.3.3. Market size and forecast, by Distribution Channel
- 7.4.5.4. India
- 7.4.5.4.1. Market size and forecast, by Type
- 7.4.5.4.2. Market size and forecast, by Application
- 7.4.5.4.3. Market size and forecast, by Distribution Channel
- 7.4.5.5. Indonesia
- 7.4.5.5.1. Market size and forecast, by Type
- 7.4.5.5.2. Market size and forecast, by Application
- 7.4.5.5.3. Market size and forecast, by Distribution Channel
- 7.4.5.6. Thailand
- 7.4.5.6.1. Market size and forecast, by Type
- 7.4.5.6.2. Market size and forecast, by Application
- 7.4.5.6.3. Market size and forecast, by Distribution Channel
- 7.4.5.7. Malaysia
- 7.4.5.7.1. Market size and forecast, by Type
- 7.4.5.7.2. Market size and forecast, by Application
- 7.4.5.7.3. Market size and forecast, by Distribution Channel
- 7.4.5.8. Viet Nam
- 7.4.5.8.1. Market size and forecast, by Type
- 7.4.5.8.2. Market size and forecast, by Application
- 7.4.5.8.3. Market size and forecast, by Distribution Channel
- 7.4.5.9. Rest of Asia-Pacific
- 7.4.5.9.1. Market size and forecast, by Type
- 7.4.5.9.2. Market size and forecast, by Application
- 7.4.5.9.3. Market size and forecast, by Distribution Channel
- 7.5. LAMEA
- 7.5.1. Key market trends, growth factors and opportunities
- 7.5.2. Market size and forecast, by Type
- 7.5.3. Market size and forecast, by Application
- 7.5.4. Market size and forecast, by Distribution Channel
- 7.5.5. Market size and forecast, by country
- 7.5.5.1. Brazil
- 7.5.5.1.1. Market size and forecast, by Type
- 7.5.5.1.2. Market size and forecast, by Application
- 7.5.5.1.3. Market size and forecast, by Distribution Channel
- 7.5.5.2. South Africa
- 7.5.5.2.1. Market size and forecast, by Type
- 7.5.5.2.2. Market size and forecast, by Application
- 7.5.5.2.3. Market size and forecast, by Distribution Channel
- 7.5.5.3. Argentina
- 7.5.5.3.1. Market size and forecast, by Type
- 7.5.5.3.2. Market size and forecast, by Application
- 7.5.5.3.3. Market size and forecast, by Distribution Channel
- 7.5.5.4. Rest of LAMEA
- 7.5.5.4.1. Market size and forecast, by Type
- 7.5.5.4.2. Market size and forecast, by Application
- 7.5.5.4.3. Market size and forecast, by Distribution Channel
CHAPTER 8: COMPETITIVE LANDSCAPE
- 8.1. Introduction
- 8.2. Top winning strategies
- 8.3. Product mapping of top 10 player
- 8.4. Competitive dashboard
- 8.5. Competitive heatmap
- 8.6. Top player positioning, 2022
CHAPTER 9: COMPANY PROFILES
- 9.1. Barlean's Organic Oils, LLC
- 9.1.1. Company overview
- 9.1.2. Key executives
- 9.1.3. Company snapshot
- 9.1.4. Operating business segments
- 9.1.5. Product portfolio
- 9.2. Omega Protein Corporation
- 9.2.1. Company overview
- 9.2.2. Key executives
- 9.2.3. Company snapshot
- 9.2.4. Operating business segments
- 9.2.5. Product portfolio
- 9.2.6. Key strategic moves and developments
- 9.3. Carlson Laboratories, Inc.
- 9.3.1. Company overview
- 9.3.2. Key executives
- 9.3.3. Company snapshot
- 9.3.4. Operating business segments
- 9.3.5. Product portfolio
- 9.4. Olvea Fish Oils
- 9.4.1. Company overview
- 9.4.2. Key executives
- 9.4.3. Company snapshot
- 9.4.4. Operating business segments
- 9.4.5. Product portfolio
- 9.5. Colpex International S.A.C
- 9.5.1. Company overview
- 9.5.2. Key executives
- 9.5.3. Company snapshot
- 9.5.4. Operating business segments
- 9.5.5. Product portfolio
- 9.6. Nordic Naturals
- 9.6.1. Company overview
- 9.6.2. Key executives
- 9.6.3. Company snapshot
- 9.6.4. Operating business segments
- 9.6.5. Product portfolio
- 9.7. Stepan Company
- 9.7.1. Company overview
- 9.7.2. Key executives
- 9.7.3. Company snapshot
- 9.7.4. Operating business segments
- 9.7.5. Product portfolio
- 9.7.6. Business performance
- 9.7.7. Key strategic moves and developments
- 9.8. Pelagia AS
- 9.8.1. Company overview
- 9.8.2. Key executives
- 9.8.3. Company snapshot
- 9.8.4. Operating business segments
- 9.8.5. Product portfolio
- 9.8.6. Business performance
- 9.9. GC Rieber VivoMega
- 9.9.1. Company overview
- 9.9.2. Key executives
- 9.9.3. Company snapshot
- 9.9.4. Operating business segments
- 9.9.5. Product portfolio
- 9.9.6. Key strategic moves and developments
- 9.10. Koninklijke DSM N.V.
- 9.10.1. Company overview
- 9.10.2. Key executives
- 9.10.3. Company snapshot
- 9.10.4. Operating business segments
- 9.10.5. Product portfolio
- 9.10.6. Business performance
LIST OF TABLES
- TABLE 01. GLOBAL FISH OIL OMEGA-3 MARKET, BY TYPE, 2022-2032 ($MILLION)
- TABLE 02. FISH OIL OMEGA-3 MARKET FOR ANCHOVY, BY REGION, 2022-2032 ($MILLION)
- TABLE 03. FISH OIL OMEGA-3 MARKET FOR COD, BY REGION, 2022-2032 ($MILLION)
- TABLE 04. FISH OIL OMEGA-3 MARKET FOR HERRING, BY REGION, 2022-2032 ($MILLION)
- TABLE 05. FISH OIL OMEGA-3 MARKET FOR MENHADENS, BY REGION, 2022-2032 ($MILLION)
- TABLE 06. FISH OIL OMEGA-3 MARKET FOR MACKEREL, BY REGION, 2022-2032 ($MILLION)
- TABLE 07. FISH OIL OMEGA-3 MARKET FOR SARDINES, BY REGION, 2022-2032 ($MILLION)
- TABLE 08. FISH OIL OMEGA-3 MARKET FOR SALMON, BY REGION, 2022-2032 ($MILLION)
- TABLE 09. FISH OIL OMEGA-3 MARKET FOR OTHERS, BY REGION, 2022-2032 ($MILLION)
- TABLE 10. GLOBAL FISH OIL OMEGA-3 MARKET, BY APPLICATION, 2022-2032 ($MILLION)
- TABLE 11. FISH OIL OMEGA-3 MARKET FOR AQUACULTURE, BY REGION, 2022-2032 ($MILLION)
- TABLE 12. FISH OIL OMEGA-3 MARKET FOR DIETARY SUPPLEMENTS, BY REGION, 2022-2032 ($MILLION)
- TABLE 13. FISH OIL OMEGA-3 MARKET FOR ANIMAL NUTRITION AND PET FOOD, BY REGION, 2022-2032 ($MILLION)
- TABLE 14. FISH OIL OMEGA-3 MARKET FOR PHARMACEUTICAL, BY REGION, 2022-2032 ($MILLION)
- TABLE 15. FISH OIL OMEGA-3 MARKET FOR INFANT FORMULA, BY REGION, 2022-2032 ($MILLION)
- TABLE 16. FISH OIL OMEGA-3 MARKET FOR OTHERS, BY REGION, 2022-2032 ($MILLION)
- TABLE 17. GLOBAL FISH OIL OMEGA-3 MARKET, BY DISTRIBUTION CHANNEL, 2022-2032 ($MILLION)
- TABLE 18. FISH OIL OMEGA-3 MARKET FOR SUPERMARKETS-HYPERMARKETS, BY REGION, 2022-2032 ($MILLION)
- TABLE 19. FISH OIL OMEGA-3 MARKET FOR DEPARTMENTAL STORES, BY REGION, 2022-2032 ($MILLION)
- TABLE 20. FISH OIL OMEGA-3 MARKET FOR PHARMACIES, BY REGION, 2022-2032 ($MILLION)
- TABLE 21. FISH OIL OMEGA-3 MARKET FOR B2B, BY REGION, 2022-2032 ($MILLION)
- TABLE 22. FISH OIL OMEGA-3 MARKET FOR ONLINE SALES CHANNEL, BY REGION, 2022-2032 ($MILLION)
- TABLE 23. FISH OIL OMEGA-3 MARKET, BY REGION, 2022-2032 ($MILLION)
- TABLE 24. NORTH AMERICA FISH OIL OMEGA-3 MARKET, BY TYPE, 2022-2032 ($MILLION)
- TABLE 25. NORTH AMERICA FISH OIL OMEGA-3 MARKET, BY APPLICATION, 2022-2032 ($MILLION)
- TABLE 26. NORTH AMERICA FISH OIL OMEGA-3 MARKET, BY DISTRIBUTION CHANNEL, 2022-2032 ($MILLION)
- TABLE 27. NORTH AMERICA FISH OIL OMEGA-3 MARKET, BY COUNTRY, 2022-2032 ($MILLION)
- TABLE 28. U.S. FISH OIL OMEGA-3 MARKET, BY TYPE, 2022-2032 ($MILLION)
- TABLE 29. U.S. FISH OIL OMEGA-3 MARKET, BY APPLICATION, 2022-2032 ($MILLION)
- TABLE 30. U.S. FISH OIL OMEGA-3 MARKET, BY DISTRIBUTION CHANNEL, 2022-2032 ($MILLION)
- TABLE 31. CANADA FISH OIL OMEGA-3 MARKET, BY TYPE, 2022-2032 ($MILLION)
- TABLE 32. CANADA FISH OIL OMEGA-3 MARKET, BY APPLICATION, 2022-2032 ($MILLION)
- TABLE 33. CANADA FISH OIL OMEGA-3 MARKET, BY DISTRIBUTION CHANNEL, 2022-2032 ($MILLION)
- TABLE 34. MEXICO FISH OIL OMEGA-3 MARKET, BY TYPE, 2022-2032 ($MILLION)
- TABLE 35. MEXICO FISH OIL OMEGA-3 MARKET, BY APPLICATION, 2022-2032 ($MILLION)
- TABLE 36. MEXICO FISH OIL OMEGA-3 MARKET, BY DISTRIBUTION CHANNEL, 2022-2032 ($MILLION)
- TABLE 37. EUROPE FISH OIL OMEGA-3 MARKET, BY TYPE, 2022-2032 ($MILLION)
- TABLE 38. EUROPE FISH OIL OMEGA-3 MARKET, BY APPLICATION, 2022-2032 ($MILLION)
- TABLE 39. EUROPE FISH OIL OMEGA-3 MARKET, BY DISTRIBUTION CHANNEL, 2022-2032 ($MILLION)
- TABLE 40. EUROPE FISH OIL OMEGA-3 MARKET, BY COUNTRY, 2022-2032 ($MILLION)
- TABLE 41. GERMANY FISH OIL OMEGA-3 MARKET, BY TYPE, 2022-2032 ($MILLION)
- TABLE 42. GERMANY FISH OIL OMEGA-3 MARKET, BY APPLICATION, 2022-2032 ($MILLION)
- TABLE 43. GERMANY FISH OIL OMEGA-3 MARKET, BY DISTRIBUTION CHANNEL, 2022-2032 ($MILLION)
- TABLE 44. UK FISH OIL OMEGA-3 MARKET, BY TYPE, 2022-2032 ($MILLION)
- TABLE 45. UK FISH OIL OMEGA-3 MARKET, BY APPLICATION, 2022-2032 ($MILLION)
- TABLE 46. UK FISH OIL OMEGA-3 MARKET, BY DISTRIBUTION CHANNEL, 2022-2032 ($MILLION)
- TABLE 47. FRANCE FISH OIL OMEGA-3 MARKET, BY TYPE, 2022-2032 ($MILLION)
- TABLE 48. FRANCE FISH OIL OMEGA-3 MARKET, BY APPLICATION, 2022-2032 ($MILLION)
- TABLE 49. FRANCE FISH OIL OMEGA-3 MARKET, BY DISTRIBUTION CHANNEL, 2022-2032 ($MILLION)
- TABLE 50. ITALY FISH OIL OMEGA-3 MARKET, BY TYPE, 2022-2032 ($MILLION)
- TABLE 51. ITALY FISH OIL OMEGA-3 MARKET, BY APPLICATION, 2022-2032 ($MILLION)
- TABLE 52. ITALY FISH OIL OMEGA-3 MARKET, BY DISTRIBUTION CHANNEL, 2022-2032 ($MILLION)
- TABLE 53. SPAIN FISH OIL OMEGA-3 MARKET, BY TYPE, 2022-2032 ($MILLION)
- TABLE 54. SPAIN FISH OIL OMEGA-3 MARKET, BY APPLICATION, 2022-2032 ($MILLION)
- TABLE 55. SPAIN FISH OIL OMEGA-3 MARKET, BY DISTRIBUTION CHANNEL, 2022-2032 ($MILLION)
- TABLE 56. REST OF EUROPE FISH OIL OMEGA-3 MARKET, BY TYPE, 2022-2032 ($MILLION)
- TABLE 57. REST OF EUROPE FISH OIL OMEGA-3 MARKET, BY APPLICATION, 2022-2032 ($MILLION)
- TABLE 58. REST OF EUROPE FISH OIL OMEGA-3 MARKET, BY DISTRIBUTION CHANNEL, 2022-2032 ($MILLION)
- TABLE 59. ASIA-PACIFIC FISH OIL OMEGA-3 MARKET, BY TYPE, 2022-2032 ($MILLION)
- TABLE 60. ASIA-PACIFIC FISH OIL OMEGA-3 MARKET, BY APPLICATION, 2022-2032 ($MILLION)
- TABLE 61. ASIA-PACIFIC FISH OIL OMEGA-3 MARKET, BY DISTRIBUTION CHANNEL, 2022-2032 ($MILLION)
- TABLE 62. ASIA-PACIFIC FISH OIL OMEGA-3 MARKET, BY COUNTRY, 2022-2032 ($MILLION)
- TABLE 63. CHINA FISH OIL OMEGA-3 MARKET, BY TYPE, 2022-2032 ($MILLION)
- TABLE 64. CHINA FISH OIL OMEGA-3 MARKET, BY APPLICATION, 2022-2032 ($MILLION)
- TABLE 65. CHINA FISH OIL OMEGA-3 MARKET, BY DISTRIBUTION CHANNEL, 2022-2032 ($MILLION)
- TABLE 66. JAPAN FISH OIL OMEGA-3 MARKET, BY TYPE, 2022-2032 ($MILLION)
- TABLE 67. JAPAN FISH OIL OMEGA-3 MARKET, BY APPLICATION, 2022-2032 ($MILLION)
- TABLE 68. JAPAN FISH OIL OMEGA-3 MARKET, BY DISTRIBUTION CHANNEL, 2022-2032 ($MILLION)
- TABLE 69. SOUTH KOREA FISH OIL OMEGA-3 MARKET, BY TYPE, 2022-2032 ($MILLION)
- TABLE 70. SOUTH KOREA FISH OIL OMEGA-3 MARKET, BY APPLICATION, 2022-2032 ($MILLION)
- TABLE 71. SOUTH KOREA FISH OIL OMEGA-3 MARKET, BY DISTRIBUTION CHANNEL, 2022-2032 ($MILLION)
- TABLE 72. INDIA FISH OIL OMEGA-3 MARKET, BY TYPE, 2022-2032 ($MILLION)
- TABLE 73. INDIA FISH OIL OMEGA-3 MARKET, BY APPLICATION, 2022-2032 ($MILLION)
- TABLE 74. INDIA FISH OIL OMEGA-3 MARKET, BY DISTRIBUTION CHANNEL, 2022-2032 ($MILLION)
- TABLE 75. INDONESIA FISH OIL OMEGA-3 MARKET, BY TYPE, 2022-2032 ($MILLION)
- TABLE 76. INDONESIA FISH OIL OMEGA-3 MARKET, BY APPLICATION, 2022-2032 ($MILLION)
- TABLE 77. INDONESIA FISH OIL OMEGA-3 MARKET, BY DISTRIBUTION CHANNEL, 2022-2032 ($MILLION)
- TABLE 78. THAILAND FISH OIL OMEGA-3 MARKET, BY TYPE, 2022-2032 ($MILLION)
- TABLE 79. THAILAND FISH OIL OMEGA-3 MARKET, BY APPLICATION, 2022-2032 ($MILLION)
- TABLE 80. THAILAND FISH OIL OMEGA-3 MARKET, BY DISTRIBUTION CHANNEL, 2022-2032 ($MILLION)
- TABLE 81. MALAYSIA FISH OIL OMEGA-3 MARKET, BY TYPE, 2022-2032 ($MILLION)
- TABLE 82. MALAYSIA FISH OIL OMEGA-3 MARKET, BY APPLICATION, 2022-2032 ($MILLION)
- TABLE 83. MALAYSIA FISH OIL OMEGA-3 MARKET, BY DISTRIBUTION CHANNEL, 2022-2032 ($MILLION)
- TABLE 84. VIET NAM FISH OIL OMEGA-3 MARKET, BY TYPE, 2022-2032 ($MILLION)
- TABLE 85. VIET NAM FISH OIL OMEGA-3 MARKET, BY APPLICATION, 2022-2032 ($MILLION)
- TABLE 86. VIET NAM FISH OIL OMEGA-3 MARKET, BY DISTRIBUTION CHANNEL, 2022-2032 ($MILLION)
- TABLE 87. REST OF ASIA-PACIFIC FISH OIL OMEGA-3 MARKET, BY TYPE, 2022-2032 ($MILLION)
- TABLE 88. REST OF ASIA-PACIFIC FISH OIL OMEGA-3 MARKET, BY APPLICATION, 2022-2032 ($MILLION)
- TABLE 89. REST OF ASIA-PACIFIC FISH OIL OMEGA-3 MARKET, BY DISTRIBUTION CHANNEL, 2022-2032 ($MILLION)
- TABLE 90. LAMEA FISH OIL OMEGA-3 MARKET, BY TYPE, 2022-2032 ($MILLION)
- TABLE 91. LAMEA FISH OIL OMEGA-3 MARKET, BY APPLICATION, 2022-2032 ($MILLION)
- TABLE 92. LAMEA FISH OIL OMEGA-3 MARKET, BY DISTRIBUTION CHANNEL, 2022-2032 ($MILLION)
- TABLE 93. LAMEA FISH OIL OMEGA-3 MARKET, BY COUNTRY, 2022-2032 ($MILLION)
- TABLE 94. BRAZIL FISH OIL OMEGA-3 MARKET, BY TYPE, 2022-2032 ($MILLION)
- TABLE 95. BRAZIL FISH OIL OMEGA-3 MARKET, BY APPLICATION, 2022-2032 ($MILLION)
- TABLE 96. BRAZIL FISH OIL OMEGA-3 MARKET, BY DISTRIBUTION CHANNEL, 2022-2032 ($MILLION)
- TABLE 97. SOUTH AFRICA FISH OIL OMEGA-3 MARKET, BY TYPE, 2022-2032 ($MILLION)
- TABLE 98. SOUTH AFRICA FISH OIL OMEGA-3 MARKET, BY APPLICATION, 2022-2032 ($MILLION)
- TABLE 99. SOUTH AFRICA FISH OIL OMEGA-3 MARKET, BY DISTRIBUTION CHANNEL, 2022-2032 ($MILLION)
- TABLE 100. ARGENTINA FISH OIL OMEGA-3 MARKET, BY TYPE, 2022-2032 ($MILLION)
- TABLE 101. ARGENTINA FISH OIL OMEGA-3 MARKET, BY APPLICATION, 2022-2032 ($MILLION)
- TABLE 102. ARGENTINA FISH OIL OMEGA-3 MARKET, BY DISTRIBUTION CHANNEL, 2022-2032 ($MILLION)
- TABLE 103. REST OF LAMEA FISH OIL OMEGA-3 MARKET, BY TYPE, 2022-2032 ($MILLION)
- TABLE 104. REST OF LAMEA FISH OIL OMEGA-3 MARKET, BY APPLICATION, 2022-2032 ($MILLION)
- TABLE 105. REST OF LAMEA FISH OIL OMEGA-3 MARKET, BY DISTRIBUTION CHANNEL, 2022-2032 ($MILLION)
- TABLE 106. BARLEAN'S ORGANIC OILS, LLC: KEY EXECUTIVES
- TABLE 107. BARLEAN'S ORGANIC OILS, LLC: COMPANY SNAPSHOT
- TABLE 108. BARLEAN'S ORGANIC OILS, LLC: PRODUCT SEGMENTS
- TABLE 109. BARLEAN'S ORGANIC OILS, LLC: PRODUCT PORTFOLIO
- TABLE 110. OMEGA PROTEIN CORPORATION: KEY EXECUTIVES
- TABLE 111. OMEGA PROTEIN CORPORATION: COMPANY SNAPSHOT
- TABLE 112. OMEGA PROTEIN CORPORATION: PRODUCT SEGMENTS
- TABLE 113. OMEGA PROTEIN CORPORATION: PRODUCT PORTFOLIO
- TABLE 114. OMEGA PROTEIN CORPORATION: KEY STRATERGIES
- TABLE 115. CARLSON LABORATORIES, INC.: KEY EXECUTIVES
- TABLE 116. CARLSON LABORATORIES, INC.: COMPANY SNAPSHOT
- TABLE 117. CARLSON LABORATORIES, INC.: PRODUCT SEGMENTS
- TABLE 118. CARLSON LABORATORIES, INC.: PRODUCT PORTFOLIO
- TABLE 119. OLVEA FISH OILS: KEY EXECUTIVES
- TABLE 120. OLVEA FISH OILS: COMPANY SNAPSHOT
- TABLE 121. OLVEA FISH OILS: PRODUCT SEGMENTS
- TABLE 122. OLVEA FISH OILS: PRODUCT PORTFOLIO
- TABLE 123. COLPEX INTERNATIONAL S.A.C: KEY EXECUTIVES
- TABLE 124. COLPEX INTERNATIONAL S.A.C: COMPANY SNAPSHOT
- TABLE 125. COLPEX INTERNATIONAL S.A.C: PRODUCT SEGMENTS
- TABLE 126. COLPEX INTERNATIONAL S.A.C: SERVICE SEGMENTS
- TABLE 127. COLPEX INTERNATIONAL S.A.C: PRODUCT PORTFOLIO
- TABLE 128. NORDIC NATURALS: KEY EXECUTIVES
- TABLE 129. NORDIC NATURALS: COMPANY SNAPSHOT
- TABLE 130. NORDIC NATURALS: PRODUCT SEGMENTS
- TABLE 131. NORDIC NATURALS: PRODUCT PORTFOLIO
- TABLE 132. STEPAN COMPANY: KEY EXECUTIVES
- TABLE 133. STEPAN COMPANY: COMPANY SNAPSHOT
- TABLE 134. STEPAN COMPANY: PRODUCT SEGMENTS
- TABLE 135. STEPAN COMPANY: PRODUCT PORTFOLIO
- TABLE 136. STEPAN COMPANY: KEY STRATERGIES
- TABLE 137. PELAGIA AS: KEY EXECUTIVES
- TABLE 138. PELAGIA AS: COMPANY SNAPSHOT
- TABLE 139. PELAGIA AS: PRODUCT SEGMENTS
- TABLE 140. PELAGIA AS: PRODUCT PORTFOLIO
- TABLE 141. GC RIEBER VIVOMEGA: KEY EXECUTIVES
- TABLE 142. GC RIEBER VIVOMEGA: COMPANY SNAPSHOT
- TABLE 143. GC RIEBER VIVOMEGA: PRODUCT SEGMENTS
- TABLE 144. GC RIEBER VIVOMEGA: PRODUCT PORTFOLIO
- TABLE 145. GC RIEBER VIVOMEGA: KEY STRATERGIES
- TABLE 146. KONINKLIJKE DSM N.V.: KEY EXECUTIVES
- TABLE 147. KONINKLIJKE DSM N.V.: COMPANY SNAPSHOT
- TABLE 148. KONINKLIJKE DSM N.V.: PRODUCT SEGMENTS
- TABLE 149. KONINKLIJKE DSM N.V.: PRODUCT PORTFOLIO
LIST OF FIGURES
- FIGURE 01. FISH OIL OMEGA-3 MARKET, 2022-2032
- FIGURE 02. SEGMENTATION OF FISH OIL OMEGA-3 MARKET,2022-2032
- FIGURE 03. TOP IMPACTING FACTORS IN FISH OIL OMEGA-3 MARKET (2022 TO 2032)
- FIGURE 04. TOP INVESTMENT POCKETS IN FISH OIL OMEGA-3 MARKET (2023-2032)
- FIGURE 05. HIGH BARGAINING POWER OF SUPPLIERS
- FIGURE 06. HIGH THREAT OF NEW ENTRANTS
- FIGURE 07. MODERATE THREAT OF SUBSTITUTES
- FIGURE 08. MODERATE INTENSITY OF RIVALRY
- FIGURE 09. MODERATE BARGAINING POWER OF BUYERS
- FIGURE 10. GLOBAL FISH OIL OMEGA-3 MARKET:DRIVERS, RESTRAINTS AND OPPORTUNITIES
- FIGURE 11. FISH OIL OMEGA-3 MARKET, BY TYPE, 2022 AND 2032(%)
- FIGURE 12. COMPARATIVE SHARE ANALYSIS OF FISH OIL OMEGA-3 MARKET FOR ANCHOVY, BY COUNTRY 2022 AND 2032(%)
- FIGURE 13. COMPARATIVE SHARE ANALYSIS OF FISH OIL OMEGA-3 MARKET FOR COD, BY COUNTRY 2022 AND 2032(%)
- FIGURE 14. COMPARATIVE SHARE ANALYSIS OF FISH OIL OMEGA-3 MARKET FOR HERRING, BY COUNTRY 2022 AND 2032(%)
- FIGURE 15. COMPARATIVE SHARE ANALYSIS OF FISH OIL OMEGA-3 MARKET FOR MENHADENS, BY COUNTRY 2022 AND 2032(%)
- FIGURE 16. COMPARATIVE SHARE ANALYSIS OF FISH OIL OMEGA-3 MARKET FOR MACKEREL, BY COUNTRY 2022 AND 2032(%)
- FIGURE 17. COMPARATIVE SHARE ANALYSIS OF FISH OIL OMEGA-3 MARKET FOR SARDINES, BY COUNTRY 2022 AND 2032(%)
- FIGURE 18. COMPARATIVE SHARE ANALYSIS OF FISH OIL OMEGA-3 MARKET FOR SALMON, BY COUNTRY 2022 AND 2032(%)
- FIGURE 19. COMPARATIVE SHARE ANALYSIS OF FISH OIL OMEGA-3 MARKET FOR OTHERS, BY COUNTRY 2022 AND 2032(%)
- FIGURE 20. FISH OIL OMEGA-3 MARKET, BY APPLICATION, 2022 AND 2032(%)
- FIGURE 21. COMPARATIVE SHARE ANALYSIS OF FISH OIL OMEGA-3 MARKET FOR AQUACULTURE, BY COUNTRY 2022 AND 2032(%)
- FIGURE 22. COMPARATIVE SHARE ANALYSIS OF FISH OIL OMEGA-3 MARKET FOR DIETARY SUPPLEMENTS, BY COUNTRY 2022 AND 2032(%)
- FIGURE 23. COMPARATIVE SHARE ANALYSIS OF FISH OIL OMEGA-3 MARKET FOR ANIMAL NUTRITION AND PET FOOD, BY COUNTRY 2022 AND 2032(%)
- FIGURE 24. COMPARATIVE SHARE ANALYSIS OF FISH OIL OMEGA-3 MARKET FOR PHARMACEUTICAL, BY COUNTRY 2022 AND 2032(%)
- FIGURE 25. COMPARATIVE SHARE ANALYSIS OF FISH OIL OMEGA-3 MARKET FOR INFANT FORMULA, BY COUNTRY 2022 AND 2032(%)
- FIGURE 26. COMPARATIVE SHARE ANALYSIS OF FISH OIL OMEGA-3 MARKET FOR OTHERS, BY COUNTRY 2022 AND 2032(%)
- FIGURE 27. FISH OIL OMEGA-3 MARKET, BY DISTRIBUTION CHANNEL, 2022 AND 2032(%)
- FIGURE 28. COMPARATIVE SHARE ANALYSIS OF FISH OIL OMEGA-3 MARKET FOR SUPERMARKETS-HYPERMARKETS, BY COUNTRY 2022 AND 2032(%)
- FIGURE 29. COMPARATIVE SHARE ANALYSIS OF FISH OIL OMEGA-3 MARKET FOR DEPARTMENTAL STORES, BY COUNTRY 2022 AND 2032(%)
- FIGURE 30. COMPARATIVE SHARE ANALYSIS OF FISH OIL OMEGA-3 MARKET FOR PHARMACIES, BY COUNTRY 2022 AND 2032(%)
- FIGURE 31. COMPARATIVE SHARE ANALYSIS OF FISH OIL OMEGA-3 MARKET FOR B2B, BY COUNTRY 2022 AND 2032(%)
- FIGURE 32. COMPARATIVE SHARE ANALYSIS OF FISH OIL OMEGA-3 MARKET FOR ONLINE SALES CHANNEL, BY COUNTRY 2022 AND 2032(%)
- FIGURE 33. FISH OIL OMEGA-3 MARKET BY REGION, 2022 AND 2032(%)
- FIGURE 34. U.S. FISH OIL OMEGA-3 MARKET, 2022-2032 ($MILLION)
- FIGURE 35. CANADA FISH OIL OMEGA-3 MARKET, 2022-2032 ($MILLION)
- FIGURE 36. MEXICO FISH OIL OMEGA-3 MARKET, 2022-2032 ($MILLION)
- FIGURE 37. GERMANY FISH OIL OMEGA-3 MARKET, 2022-2032 ($MILLION)
- FIGURE 38. UK FISH OIL OMEGA-3 MARKET, 2022-2032 ($MILLION)
- FIGURE 39. FRANCE FISH OIL OMEGA-3 MARKET, 2022-2032 ($MILLION)
- FIGURE 40. ITALY FISH OIL OMEGA-3 MARKET, 2022-2032 ($MILLION)
- FIGURE 41. SPAIN FISH OIL OMEGA-3 MARKET, 2022-2032 ($MILLION)
- FIGURE 42. REST OF EUROPE FISH OIL OMEGA-3 MARKET, 2022-2032 ($MILLION)
- FIGURE 43. CHINA FISH OIL OMEGA-3 MARKET, 2022-2032 ($MILLION)
- FIGURE 44. JAPAN FISH OIL OMEGA-3 MARKET, 2022-2032 ($MILLION)
- FIGURE 45. SOUTH KOREA FISH OIL OMEGA-3 MARKET, 2022-2032 ($MILLION)
- FIGURE 46. INDIA FISH OIL OMEGA-3 MARKET, 2022-2032 ($MILLION)
- FIGURE 47. INDONESIA FISH OIL OMEGA-3 MARKET, 2022-2032 ($MILLION)
- FIGURE 48. THAILAND FISH OIL OMEGA-3 MARKET, 2022-2032 ($MILLION)
- FIGURE 49. MALAYSIA FISH OIL OMEGA-3 MARKET, 2022-2032 ($MILLION)
- FIGURE 50. VIET NAM FISH OIL OMEGA-3 MARKET, 2022-2032 ($MILLION)
- FIGURE 51. REST OF ASIA-PACIFIC FISH OIL OMEGA-3 MARKET, 2022-2032 ($MILLION)
- FIGURE 52. BRAZIL FISH OIL OMEGA-3 MARKET, 2022-2032 ($MILLION)
- FIGURE 53. SOUTH AFRICA FISH OIL OMEGA-3 MARKET, 2022-2032 ($MILLION)
- FIGURE 54. ARGENTINA FISH OIL OMEGA-3 MARKET, 2022-2032 ($MILLION)
- FIGURE 55. REST OF LAMEA FISH OIL OMEGA-3 MARKET, 2022-2032 ($MILLION)
- FIGURE 56. TOP WINNING STRATEGIES, BY YEAR (2020-2023)
- FIGURE 57. TOP WINNING STRATEGIES, BY DEVELOPMENT (2020-2023)
- FIGURE 58. TOP WINNING STRATEGIES, BY COMPANY (2020-2023)
- FIGURE 59. PRODUCT MAPPING OF TOP 10 PLAYERS
- FIGURE 60. COMPETITIVE DASHBOARD
- FIGURE 61. COMPETITIVE HEATMAP: FISH OIL OMEGA-3 MARKET
- FIGURE 62. TOP PLAYER POSITIONING, 2022
- FIGURE 63. STEPAN COMPANY: NET SALES, 2020-2022 ($MILLION)
- FIGURE 64. STEPAN COMPANY: REVENUE SHARE BY REGION, 2022 (%)
- FIGURE 65. STEPAN COMPANY: REVENUE SHARE BY SEGMENT, 2022 (%)
- FIGURE 66. PELAGIA AS: NET REVENUE, 2020-2022 ($MILLION)
- FIGURE 67. PELAGIA AS: REVENUE SHARE BY SEGMENT, 2022 (%)
- FIGURE 68. PELAGIA AS: REVENUE SHARE BY REGION, 2022 (%)
- FIGURE 69. KONINKLIJKE DSM N.V.: NET SALES, 2020-2022 ($MILLION)
- FIGURE 70. KONINKLIJKE DSM N.V.: REVENUE SHARE BY SEGMENT, 2022 (%)
- FIGURE 71. KONINKLIJKE DSM N.V.: REVENUE SHARE BY REGION, 2022 (%)

