
PUBLISHER: Allied Market Research | PRODUCT CODE: 1414980

PUBLISHER: Allied Market Research | PRODUCT CODE: 1414980
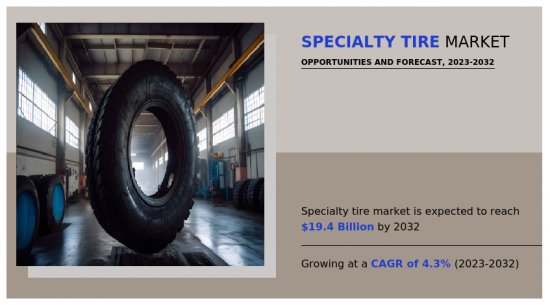
Specialty Tire Market By Type, By End-User, By Sales Channel (Original Equipment Manufacturers, Aftermarket): Global Opportunity Analysis and Industry Forecast, 2023-2032
"The Specialty Tire Market is expected to experience a significant growth rate of 4.3% from 2023-2032 owing to increase in vehicle production in developing countries and rise in competition among tire manufacturers across the globe." - Allied Market Research.
The development of specialty tires continues to evolve with advancements in technology, materials, and manufacturing processes. Whether conquering challenging terrains, supporting agricultural operations, handling heavy loads in industrial settings, or ensuring the safety of flights, specialty tires exemplify the intersection of precision engineering and specific-use applications in the world of transportation and machinery.
Furthermore, due to rising fuel efficiency norms encouraging the development of alternative energy-driven vehicles; automobile manufacturers are leaning toward electric and alternative fuel automobiles. The increase in commercial and passenger automobile production as well as more advanced technology, creates a demand for specialty tires across the globe.
The specialty tire market is segmented on the basis of type, end user, sales channel, and region. By type, the market is categorized into bias tires and radial tires. As per end user, the market is categorized into agriculture, construction & mining, off-roading, and others. By sales channel, the global market is categorized into original equipment manufacturers (OEMs) and aftermarket. Region wise, the market is divided into North America, Europe, Asia-Pacific, and LAMEA.
The key players profiled in the study include: CEAT Ltd., Michelin, GRI Tires, Maxam Tire, Specialty Tires of America, Inc., The Carlstar Group, LLC, Bridgestone Corporation, Continental AG, Nokian Tyres plc., and Zhongce Rubber Group Co., Ltd. whose developments creates ample opportunities for the growth of the market across the globe. For instance, in October 2023, Nokian Tyres plc. launched Soil King VF & Float King VF tire that utilize Flexforce VF technology. It is a unique new tire technology that enables more efficient agricultural work by creating an XXL-sized ground contact and by reducing loss of power. In November 2022, GRI Tires launched radial tire for the agricultural industry, Green XLR EARTH 65+ in Paris. The Green XLR EARTH 65+ has been produced using 37.5% sustainable materials & delivers comfort for drivers of vehicles being used both on- and off-road. Furthermore, a curved lug angle at the center of the tread ensures better fuel efficiency and increased off-road traction for longer service life.
Key Benefits For Stakeholders
- This report provides a quantitative analysis of the market segments, current trends, estimations, and dynamics of the specialty tire market analysis from 2022 to 2032 to identify the prevailing specialty tire market opportunities.
- The market research is offered along with information related to key drivers, restraints, and opportunities.
- Porter's five forces analysis highlights the potency of buyers and suppliers to enable stakeholders make profit-oriented business decisions and strengthen their supplier-buyer network.
- In-depth analysis of the specialty tire market segmentation assists to determine the prevailing market opportunities.
- Major countries in each region are mapped according to their revenue contribution to the global market.
- Market player positioning facilitates benchmarking and provides a clear understanding of the present position of the market players.
- The report includes the analysis of the regional as well as global specialty tire market trends, key players, market segments, application areas, and market growth strategies.
Additional benefits you will get with this purchase are:
- Quarterly Update and* (only available with a corporate license, on listed price)
- 5 additional Company Profile of client Choice pre- or Post-purchase, as a free update.
- Free Upcoming Version on the Purchase of Five and Enterprise User License.
- 16 analyst hours of support* (post-purchase, if you find additional data requirements upon review of the report, you may receive support amounting to 16 analyst hours to solve questions, and post-sale queries)
- 15% Free Customization* (in case the scope or segment of the report does not match your requirements, 15% is equivalent to 3 working days of free work, applicable once)
- Free data Pack on the Five and Enterprise User License. (Excel version of the report)
- Free Updated report if the report is 6-12 months old or older.
- 24-hour priority response*
- Free Industry updates and white papers.
Possible Customization with this report (with additional cost and timeline, please talk to the sales executive to know more)
- Additional company profiles with specific to client's interest
- Brands Share Analysis
- SWOT Analysis
Key Market Segments
By Type
- Bias Tires
- Radial Tires
By End-User
- Agriculture
- Construction and Mining
- Off-Roading
- Others
By Sales Channel
- Original Equipment Manufacturers (OEMs)
- Aftermarket
By Region
- North America
- U.S.
- Canada
- Mexico
- Europe
- UK
- Germany
- France
- Russia
- Rest of Europe
- Asia-Pacific
- China
- Japan
- India
- South Korea
- Rest of Asia-Pacific
- LAMEA
- Latin America
- Middle East
- Africa
Key Market Players:
- Continental AG
- CEAT Ltd.
- Bridgestone Corporation
- Maxam Tire
- GRI Tires
- Michelin
- Nokian Tyres plc.
- Zhongce Rubber Group Co., Ltd.
- Specialty Tires of America, Inc.
- The Carlstar Group, LLC.
TABLE OF CONTENTS
CHAPTER 1: INTRODUCTION
- 1.1. Report description
- 1.2. Key market segments
- 1.3. Key benefits to the stakeholders
- 1.4. Research methodology
- 1.4.1. Primary research
- 1.4.2. Secondary research
- 1.4.3. Analyst tools and models
CHAPTER 2: EXECUTIVE SUMMARY
- 2.1. CXO Perspective
CHAPTER 3: MARKET OVERVIEW
- 3.1. Market definition and scope
- 3.2. Key findings
- 3.2.1. Top impacting factors
- 3.2.2. Top investment pockets
- 3.3. Porter's five forces analysis
- 3.3.1. Low bargaining power of suppliers
- 3.3.2. Low threat of new entrants
- 3.3.3. Low threat of substitutes
- 3.3.4. Low intensity of rivalry
- 3.3.5. Low bargaining power of buyers
- 3.4. Market dynamics
- 3.4.1. Drivers
- 3.4.1.1. Increase in vehicle production in developing countries
- 3.4.1.2. Rise in competition among tire manufacturers
- 3.4.2. Restraints
- 3.4.2.1. Increase in demand for tire remolding
- 3.4.2.2. Volatile prices of raw materials
- 3.4.3. Opportunities
- 3.4.3.1. Advancement in Technology
- 3.4.3.2. Fuel efficiency and safety concerns
- 3.4.1. Drivers
CHAPTER 4: SPECIALTY TIRE MARKET, BY TYPE
- 4.1. Overview
- 4.1.1. Market size and forecast
- 4.2. Bias Tires
- 4.2.1. Key market trends, growth factors and opportunities
- 4.2.2. Market size and forecast, by region
- 4.2.3. Market share analysis by country
- 4.3. Radial Tires
- 4.3.1. Key market trends, growth factors and opportunities
- 4.3.2. Market size and forecast, by region
- 4.3.3. Market share analysis by country
CHAPTER 5: SPECIALTY TIRE MARKET, BY END-USER
- 5.1. Overview
- 5.1.1. Market size and forecast
- 5.2. Agriculture
- 5.2.1. Key market trends, growth factors and opportunities
- 5.2.2. Market size and forecast, by region
- 5.2.3. Market share analysis by country
- 5.3. Construction and Mining
- 5.3.1. Key market trends, growth factors and opportunities
- 5.3.2. Market size and forecast, by region
- 5.3.3. Market share analysis by country
- 5.4. Off-Roading
- 5.4.1. Key market trends, growth factors and opportunities
- 5.4.2. Market size and forecast, by region
- 5.4.3. Market share analysis by country
- 5.5. Others
- 5.5.1. Key market trends, growth factors and opportunities
- 5.5.2. Market size and forecast, by region
- 5.5.3. Market share analysis by country
CHAPTER 6: SPECIALTY TIRE MARKET, BY SALES CHANNEL
- 6.1. Overview
- 6.1.1. Market size and forecast
- 6.2. Original Equipment Manufacturers (OEMs)
- 6.2.1. Key market trends, growth factors and opportunities
- 6.2.2. Market size and forecast, by region
- 6.2.3. Market share analysis by country
- 6.3. Aftermarket
- 6.3.1. Key market trends, growth factors and opportunities
- 6.3.2. Market size and forecast, by region
- 6.3.3. Market share analysis by country
CHAPTER 7: SPECIALTY TIRE MARKET, BY REGION
- 7.1. Overview
- 7.1.1. Market size and forecast By Region
- 7.2. North America
- 7.2.1. Key market trends, growth factors and opportunities
- 7.2.2. Market size and forecast, by Type
- 7.2.3. Market size and forecast, by End-User
- 7.2.4. Market size and forecast, by Sales Channel
- 7.2.5. Market size and forecast, by country
- 7.2.5.1. U.S.
- 7.2.5.1.1. Market size and forecast, by Type
- 7.2.5.1.2. Market size and forecast, by End-User
- 7.2.5.1.3. Market size and forecast, by Sales Channel
- 7.2.5.2. Canada
- 7.2.5.2.1. Market size and forecast, by Type
- 7.2.5.2.2. Market size and forecast, by End-User
- 7.2.5.2.3. Market size and forecast, by Sales Channel
- 7.2.5.3. Mexico
- 7.2.5.3.1. Market size and forecast, by Type
- 7.2.5.3.2. Market size and forecast, by End-User
- 7.2.5.3.3. Market size and forecast, by Sales Channel
- 7.3. Europe
- 7.3.1. Key market trends, growth factors and opportunities
- 7.3.2. Market size and forecast, by Type
- 7.3.3. Market size and forecast, by End-User
- 7.3.4. Market size and forecast, by Sales Channel
- 7.3.5. Market size and forecast, by country
- 7.3.5.1. UK
- 7.3.5.1.1. Market size and forecast, by Type
- 7.3.5.1.2. Market size and forecast, by End-User
- 7.3.5.1.3. Market size and forecast, by Sales Channel
- 7.3.5.2. Germany
- 7.3.5.2.1. Market size and forecast, by Type
- 7.3.5.2.2. Market size and forecast, by End-User
- 7.3.5.2.3. Market size and forecast, by Sales Channel
- 7.3.5.3. France
- 7.3.5.3.1. Market size and forecast, by Type
- 7.3.5.3.2. Market size and forecast, by End-User
- 7.3.5.3.3. Market size and forecast, by Sales Channel
- 7.3.5.4. Russia
- 7.3.5.4.1. Market size and forecast, by Type
- 7.3.5.4.2. Market size and forecast, by End-User
- 7.3.5.4.3. Market size and forecast, by Sales Channel
- 7.3.5.5. Rest of Europe
- 7.3.5.5.1. Market size and forecast, by Type
- 7.3.5.5.2. Market size and forecast, by End-User
- 7.3.5.5.3. Market size and forecast, by Sales Channel
- 7.4. Asia-Pacific
- 7.4.1. Key market trends, growth factors and opportunities
- 7.4.2. Market size and forecast, by Type
- 7.4.3. Market size and forecast, by End-User
- 7.4.4. Market size and forecast, by Sales Channel
- 7.4.5. Market size and forecast, by country
- 7.4.5.1. China
- 7.4.5.1.1. Market size and forecast, by Type
- 7.4.5.1.2. Market size and forecast, by End-User
- 7.4.5.1.3. Market size and forecast, by Sales Channel
- 7.4.5.2. Japan
- 7.4.5.2.1. Market size and forecast, by Type
- 7.4.5.2.2. Market size and forecast, by End-User
- 7.4.5.2.3. Market size and forecast, by Sales Channel
- 7.4.5.3. India
- 7.4.5.3.1. Market size and forecast, by Type
- 7.4.5.3.2. Market size and forecast, by End-User
- 7.4.5.3.3. Market size and forecast, by Sales Channel
- 7.4.5.4. South Korea
- 7.4.5.4.1. Market size and forecast, by Type
- 7.4.5.4.2. Market size and forecast, by End-User
- 7.4.5.4.3. Market size and forecast, by Sales Channel
- 7.4.5.5. Rest of Asia-Pacific
- 7.4.5.5.1. Market size and forecast, by Type
- 7.4.5.5.2. Market size and forecast, by End-User
- 7.4.5.5.3. Market size and forecast, by Sales Channel
- 7.5. LAMEA
- 7.5.1. Key market trends, growth factors and opportunities
- 7.5.2. Market size and forecast, by Type
- 7.5.3. Market size and forecast, by End-User
- 7.5.4. Market size and forecast, by Sales Channel
- 7.5.5. Market size and forecast, by country
- 7.5.5.1. Latin America
- 7.5.5.1.1. Market size and forecast, by Type
- 7.5.5.1.2. Market size and forecast, by End-User
- 7.5.5.1.3. Market size and forecast, by Sales Channel
- 7.5.5.2. Middle East
- 7.5.5.2.1. Market size and forecast, by Type
- 7.5.5.2.2. Market size and forecast, by End-User
- 7.5.5.2.3. Market size and forecast, by Sales Channel
- 7.5.5.3. Africa
- 7.5.5.3.1. Market size and forecast, by Type
- 7.5.5.3.2. Market size and forecast, by End-User
- 7.5.5.3.3. Market size and forecast, by Sales Channel
CHAPTER 8: COMPETITIVE LANDSCAPE
- 8.1. Introduction
- 8.2. Top winning strategies
- 8.3. Product mapping of top 10 player
- 8.4. Competitive dashboard
- 8.5. Competitive heatmap
- 8.6. Top player positioning, 2022
CHAPTER 9: COMPANY PROFILES
- 9.1. CEAT Ltd.
- 9.1.1. Company overview
- 9.1.2. Key executives
- 9.1.3. Company snapshot
- 9.1.4. Operating business segments
- 9.1.5. Product portfolio
- 9.1.6. Business performance
- 9.2. Michelin
- 9.2.1. Company overview
- 9.2.2. Key executives
- 9.2.3. Company snapshot
- 9.2.4. Operating business segments
- 9.2.5. Product portfolio
- 9.2.6. Business performance
- 9.3. GRI Tires
- 9.3.1. Company overview
- 9.3.2. Key executives
- 9.3.3. Company snapshot
- 9.3.4. Operating business segments
- 9.3.5. Product portfolio
- 9.3.6. Key strategic moves and developments
- 9.4. Maxam Tire
- 9.4.1. Company overview
- 9.4.2. Key executives
- 9.4.3. Company snapshot
- 9.4.4. Operating business segments
- 9.4.5. Product portfolio
- 9.4.6. Key strategic moves and developments
- 9.5. Specialty Tires of America, Inc.
- 9.5.1. Company overview
- 9.5.2. Key executives
- 9.5.3. Company snapshot
- 9.5.4. Operating business segments
- 9.5.5. Product portfolio
- 9.6. The Carlstar Group, LLC.
- 9.6.1. Company overview
- 9.6.2. Key executives
- 9.6.3. Company snapshot
- 9.6.4. Operating business segments
- 9.6.5. Product portfolio
- 9.6.6. Key strategic moves and developments
- 9.7. Bridgestone Corporation
- 9.7.1. Company overview
- 9.7.2. Key executives
- 9.7.3. Company snapshot
- 9.7.4. Operating business segments
- 9.7.5. Product portfolio
- 9.7.6. Business performance
- 9.7.7. Key strategic moves and developments
- 9.8. Continental AG
- 9.8.1. Company overview
- 9.8.2. Key executives
- 9.8.3. Company snapshot
- 9.8.4. Operating business segments
- 9.8.5. Product portfolio
- 9.8.6. Business performance
- 9.8.7. Key strategic moves and developments
- 9.9. Nokian Tyres plc.
- 9.9.1. Company overview
- 9.9.2. Key executives
- 9.9.3. Company snapshot
- 9.9.4. Operating business segments
- 9.9.5. Product portfolio
- 9.9.6. Business performance
- 9.9.7. Key strategic moves and developments
- 9.10. Zhongce Rubber Group Co., Ltd.
- 9.10.1. Company overview
- 9.10.2. Key executives
- 9.10.3. Company snapshot
- 9.10.4. Operating business segments
- 9.10.5. Product portfolio
- 9.10.6. Key strategic moves and developments
LIST OF TABLES
- TABLE 01. GLOBAL SPECIALTY TIRE MARKET, BY TYPE, 2022-2032 ($MILLION)
- TABLE 02. SPECIALTY TIRE MARKET FOR BIAS TIRES, BY REGION, 2022-2032 ($MILLION)
- TABLE 03. SPECIALTY TIRE MARKET FOR RADIAL TIRES, BY REGION, 2022-2032 ($MILLION)
- TABLE 04. GLOBAL SPECIALTY TIRE MARKET, BY END-USER, 2022-2032 ($MILLION)
- TABLE 05. SPECIALTY TIRE MARKET FOR AGRICULTURE, BY REGION, 2022-2032 ($MILLION)
- TABLE 06. SPECIALTY TIRE MARKET FOR CONSTRUCTION AND MINING, BY REGION, 2022-2032 ($MILLION)
- TABLE 07. SPECIALTY TIRE MARKET FOR OFF-ROADING, BY REGION, 2022-2032 ($MILLION)
- TABLE 08. SPECIALTY TIRE MARKET FOR OTHERS, BY REGION, 2022-2032 ($MILLION)
- TABLE 09. GLOBAL SPECIALTY TIRE MARKET, BY SALES CHANNEL, 2022-2032 ($MILLION)
- TABLE 10. SPECIALTY TIRE MARKET FOR ORIGINAL EQUIPMENT MANUFACTURERS (OEMS), BY REGION, 2022-2032 ($MILLION)
- TABLE 11. SPECIALTY TIRE MARKET FOR AFTERMARKET, BY REGION, 2022-2032 ($MILLION)
- TABLE 12. SPECIALTY TIRE MARKET, BY REGION, 2022-2032 ($MILLION)
- TABLE 13. NORTH AMERICA SPECIALTY TIRE MARKET, BY TYPE, 2022-2032 ($MILLION)
- TABLE 14. NORTH AMERICA SPECIALTY TIRE MARKET, BY END-USER, 2022-2032 ($MILLION)
- TABLE 15. NORTH AMERICA SPECIALTY TIRE MARKET, BY SALES CHANNEL, 2022-2032 ($MILLION)
- TABLE 16. NORTH AMERICA SPECIALTY TIRE MARKET, BY COUNTRY, 2022-2032 ($MILLION)
- TABLE 17. U.S. SPECIALTY TIRE MARKET, BY TYPE, 2022-2032 ($MILLION)
- TABLE 18. U.S. SPECIALTY TIRE MARKET, BY END-USER, 2022-2032 ($MILLION)
- TABLE 19. U.S. SPECIALTY TIRE MARKET, BY SALES CHANNEL, 2022-2032 ($MILLION)
- TABLE 20. CANADA SPECIALTY TIRE MARKET, BY TYPE, 2022-2032 ($MILLION)
- TABLE 21. CANADA SPECIALTY TIRE MARKET, BY END-USER, 2022-2032 ($MILLION)
- TABLE 22. CANADA SPECIALTY TIRE MARKET, BY SALES CHANNEL, 2022-2032 ($MILLION)
- TABLE 23. MEXICO SPECIALTY TIRE MARKET, BY TYPE, 2022-2032 ($MILLION)
- TABLE 24. MEXICO SPECIALTY TIRE MARKET, BY END-USER, 2022-2032 ($MILLION)
- TABLE 25. MEXICO SPECIALTY TIRE MARKET, BY SALES CHANNEL, 2022-2032 ($MILLION)
- TABLE 26. EUROPE SPECIALTY TIRE MARKET, BY TYPE, 2022-2032 ($MILLION)
- TABLE 27. EUROPE SPECIALTY TIRE MARKET, BY END-USER, 2022-2032 ($MILLION)
- TABLE 28. EUROPE SPECIALTY TIRE MARKET, BY SALES CHANNEL, 2022-2032 ($MILLION)
- TABLE 29. EUROPE SPECIALTY TIRE MARKET, BY COUNTRY, 2022-2032 ($MILLION)
- TABLE 30. UK SPECIALTY TIRE MARKET, BY TYPE, 2022-2032 ($MILLION)
- TABLE 31. UK SPECIALTY TIRE MARKET, BY END-USER, 2022-2032 ($MILLION)
- TABLE 32. UK SPECIALTY TIRE MARKET, BY SALES CHANNEL, 2022-2032 ($MILLION)
- TABLE 33. GERMANY SPECIALTY TIRE MARKET, BY TYPE, 2022-2032 ($MILLION)
- TABLE 34. GERMANY SPECIALTY TIRE MARKET, BY END-USER, 2022-2032 ($MILLION)
- TABLE 35. GERMANY SPECIALTY TIRE MARKET, BY SALES CHANNEL, 2022-2032 ($MILLION)
- TABLE 36. FRANCE SPECIALTY TIRE MARKET, BY TYPE, 2022-2032 ($MILLION)
- TABLE 37. FRANCE SPECIALTY TIRE MARKET, BY END-USER, 2022-2032 ($MILLION)
- TABLE 38. FRANCE SPECIALTY TIRE MARKET, BY SALES CHANNEL, 2022-2032 ($MILLION)
- TABLE 39. RUSSIA SPECIALTY TIRE MARKET, BY TYPE, 2022-2032 ($MILLION)
- TABLE 40. RUSSIA SPECIALTY TIRE MARKET, BY END-USER, 2022-2032 ($MILLION)
- TABLE 41. RUSSIA SPECIALTY TIRE MARKET, BY SALES CHANNEL, 2022-2032 ($MILLION)
- TABLE 42. REST OF EUROPE SPECIALTY TIRE MARKET, BY TYPE, 2022-2032 ($MILLION)
- TABLE 43. REST OF EUROPE SPECIALTY TIRE MARKET, BY END-USER, 2022-2032 ($MILLION)
- TABLE 44. REST OF EUROPE SPECIALTY TIRE MARKET, BY SALES CHANNEL, 2022-2032 ($MILLION)
- TABLE 45. ASIA-PACIFIC SPECIALTY TIRE MARKET, BY TYPE, 2022-2032 ($MILLION)
- TABLE 46. ASIA-PACIFIC SPECIALTY TIRE MARKET, BY END-USER, 2022-2032 ($MILLION)
- TABLE 47. ASIA-PACIFIC SPECIALTY TIRE MARKET, BY SALES CHANNEL, 2022-2032 ($MILLION)
- TABLE 48. ASIA-PACIFIC SPECIALTY TIRE MARKET, BY COUNTRY, 2022-2032 ($MILLION)
- TABLE 49. CHINA SPECIALTY TIRE MARKET, BY TYPE, 2022-2032 ($MILLION)
- TABLE 50. CHINA SPECIALTY TIRE MARKET, BY END-USER, 2022-2032 ($MILLION)
- TABLE 51. CHINA SPECIALTY TIRE MARKET, BY SALES CHANNEL, 2022-2032 ($MILLION)
- TABLE 52. JAPAN SPECIALTY TIRE MARKET, BY TYPE, 2022-2032 ($MILLION)
- TABLE 53. JAPAN SPECIALTY TIRE MARKET, BY END-USER, 2022-2032 ($MILLION)
- TABLE 54. JAPAN SPECIALTY TIRE MARKET, BY SALES CHANNEL, 2022-2032 ($MILLION)
- TABLE 55. INDIA SPECIALTY TIRE MARKET, BY TYPE, 2022-2032 ($MILLION)
- TABLE 56. INDIA SPECIALTY TIRE MARKET, BY END-USER, 2022-2032 ($MILLION)
- TABLE 57. INDIA SPECIALTY TIRE MARKET, BY SALES CHANNEL, 2022-2032 ($MILLION)
- TABLE 58. SOUTH KOREA SPECIALTY TIRE MARKET, BY TYPE, 2022-2032 ($MILLION)
- TABLE 59. SOUTH KOREA SPECIALTY TIRE MARKET, BY END-USER, 2022-2032 ($MILLION)
- TABLE 60. SOUTH KOREA SPECIALTY TIRE MARKET, BY SALES CHANNEL, 2022-2032 ($MILLION)
- TABLE 61. REST OF ASIA-PACIFIC SPECIALTY TIRE MARKET, BY TYPE, 2022-2032 ($MILLION)
- TABLE 62. REST OF ASIA-PACIFIC SPECIALTY TIRE MARKET, BY END-USER, 2022-2032 ($MILLION)
- TABLE 63. REST OF ASIA-PACIFIC SPECIALTY TIRE MARKET, BY SALES CHANNEL, 2022-2032 ($MILLION)
- TABLE 64. LAMEA SPECIALTY TIRE MARKET, BY TYPE, 2022-2032 ($MILLION)
- TABLE 65. LAMEA SPECIALTY TIRE MARKET, BY END-USER, 2022-2032 ($MILLION)
- TABLE 66. LAMEA SPECIALTY TIRE MARKET, BY SALES CHANNEL, 2022-2032 ($MILLION)
- TABLE 67. LAMEA SPECIALTY TIRE MARKET, BY COUNTRY, 2022-2032 ($MILLION)
- TABLE 68. LATIN AMERICA SPECIALTY TIRE MARKET, BY TYPE, 2022-2032 ($MILLION)
- TABLE 69. LATIN AMERICA SPECIALTY TIRE MARKET, BY END-USER, 2022-2032 ($MILLION)
- TABLE 70. LATIN AMERICA SPECIALTY TIRE MARKET, BY SALES CHANNEL, 2022-2032 ($MILLION)
- TABLE 71. MIDDLE EAST SPECIALTY TIRE MARKET, BY TYPE, 2022-2032 ($MILLION)
- TABLE 72. MIDDLE EAST SPECIALTY TIRE MARKET, BY END-USER, 2022-2032 ($MILLION)
- TABLE 73. MIDDLE EAST SPECIALTY TIRE MARKET, BY SALES CHANNEL, 2022-2032 ($MILLION)
- TABLE 74. AFRICA SPECIALTY TIRE MARKET, BY TYPE, 2022-2032 ($MILLION)
- TABLE 75. AFRICA SPECIALTY TIRE MARKET, BY END-USER, 2022-2032 ($MILLION)
- TABLE 76. AFRICA SPECIALTY TIRE MARKET, BY SALES CHANNEL, 2022-2032 ($MILLION)
- TABLE 77. CEAT LTD.: KEY EXECUTIVES
- TABLE 78. CEAT LTD.: COMPANY SNAPSHOT
- TABLE 79. CEAT LTD.: PRODUCT SEGMENTS
- TABLE 80. CEAT LTD.: PRODUCT PORTFOLIO
- TABLE 81. MICHELIN: KEY EXECUTIVES
- TABLE 82. MICHELIN: COMPANY SNAPSHOT
- TABLE 83. MICHELIN: PRODUCT SEGMENTS
- TABLE 84. MICHELIN: PRODUCT PORTFOLIO
- TABLE 85. GRI TIRES: KEY EXECUTIVES
- TABLE 86. GRI TIRES: COMPANY SNAPSHOT
- TABLE 87. GRI TIRES: PRODUCT SEGMENTS
- TABLE 88. GRI TIRES: PRODUCT PORTFOLIO
- TABLE 89. GRI TIRES: KEY STRATERGIES
- TABLE 90. MAXAM TIRE: KEY EXECUTIVES
- TABLE 91. MAXAM TIRE: COMPANY SNAPSHOT
- TABLE 92. MAXAM TIRE: PRODUCT SEGMENTS
- TABLE 93. MAXAM TIRE: PRODUCT PORTFOLIO
- TABLE 94. MAXAM TIRE: KEY STRATERGIES
- TABLE 95. SPECIALTY TIRES OF AMERICA, INC.: KEY EXECUTIVES
- TABLE 96. SPECIALTY TIRES OF AMERICA, INC.: COMPANY SNAPSHOT
- TABLE 97. SPECIALTY TIRES OF AMERICA, INC.: PRODUCT SEGMENTS
- TABLE 98. SPECIALTY TIRES OF AMERICA, INC.: PRODUCT PORTFOLIO
- TABLE 99. THE CARLSTAR GROUP, LLC.: KEY EXECUTIVES
- TABLE 100. THE CARLSTAR GROUP, LLC.: COMPANY SNAPSHOT
- TABLE 101. THE CARLSTAR GROUP, LLC.: PRODUCT SEGMENTS
- TABLE 102. THE CARLSTAR GROUP, LLC.: PRODUCT PORTFOLIO
- TABLE 103. THE CARLSTAR GROUP, LLC.: KEY STRATERGIES
- TABLE 104. BRIDGESTONE CORPORATION: KEY EXECUTIVES
- TABLE 105. BRIDGESTONE CORPORATION: COMPANY SNAPSHOT
- TABLE 106. BRIDGESTONE CORPORATION: PRODUCT SEGMENTS
- TABLE 107. BRIDGESTONE CORPORATION: PRODUCT PORTFOLIO
- TABLE 108. BRIDGESTONE CORPORATION: KEY STRATERGIES
- TABLE 109. CONTINENTAL AG: KEY EXECUTIVES
- TABLE 110. CONTINENTAL AG: COMPANY SNAPSHOT
- TABLE 111. CONTINENTAL AG: PRODUCT SEGMENTS
- TABLE 112. CONTINENTAL AG: PRODUCT PORTFOLIO
- TABLE 113. CONTINENTAL AG: KEY STRATERGIES
- TABLE 114. NOKIAN TYRES PLC.: KEY EXECUTIVES
- TABLE 115. NOKIAN TYRES PLC.: COMPANY SNAPSHOT
- TABLE 116. NOKIAN TYRES PLC.: PRODUCT SEGMENTS
- TABLE 117. NOKIAN TYRES PLC.: PRODUCT PORTFOLIO
- TABLE 118. NOKIAN TYRES PLC.: KEY STRATERGIES
- TABLE 119. ZHONGCE RUBBER GROUP CO., LTD.: KEY EXECUTIVES
- TABLE 120. ZHONGCE RUBBER GROUP CO., LTD.: COMPANY SNAPSHOT
- TABLE 121. ZHONGCE RUBBER GROUP CO., LTD.: PRODUCT SEGMENTS
- TABLE 122. ZHONGCE RUBBER GROUP CO., LTD.: PRODUCT PORTFOLIO
- TABLE 123. ZHONGCE RUBBER GROUP CO., LTD.: KEY STRATERGIES
LIST OF FIGURES
- FIGURE 01. SPECIALTY TIRE MARKET, 2022-2032
- FIGURE 02. SEGMENTATION OF SPECIALTY TIRE MARKET,2022-2032
- FIGURE 03. TOP IMPACTING FACTORS IN SPECIALTY TIRE MARKET (2022 TO 2032)
- FIGURE 04. TOP INVESTMENT POCKETS IN SPECIALTY TIRE MARKET (2023-2032)
- FIGURE 05. LOW BARGAINING POWER OF SUPPLIERS
- FIGURE 06. LOW THREAT OF NEW ENTRANTS
- FIGURE 07. LOW THREAT OF SUBSTITUTES
- FIGURE 08. LOW INTENSITY OF RIVALRY
- FIGURE 09. LOW BARGAINING POWER OF BUYERS
- FIGURE 10. GLOBAL SPECIALTY TIRE MARKET:DRIVERS, RESTRAINTS AND OPPORTUNITIES
- FIGURE 11. SPECIALTY TIRE MARKET, BY TYPE, 2022 AND 2032(%)
- FIGURE 12. COMPARATIVE SHARE ANALYSIS OF SPECIALTY TIRE MARKET FOR BIAS TIRES, BY COUNTRY 2022 AND 2032(%)
- FIGURE 13. COMPARATIVE SHARE ANALYSIS OF SPECIALTY TIRE MARKET FOR RADIAL TIRES, BY COUNTRY 2022 AND 2032(%)
- FIGURE 14. SPECIALTY TIRE MARKET, BY END-USER, 2022 AND 2032(%)
- FIGURE 15. COMPARATIVE SHARE ANALYSIS OF SPECIALTY TIRE MARKET FOR AGRICULTURE, BY COUNTRY 2022 AND 2032(%)
- FIGURE 16. COMPARATIVE SHARE ANALYSIS OF SPECIALTY TIRE MARKET FOR CONSTRUCTION AND MINING, BY COUNTRY 2022 AND 2032(%)
- FIGURE 17. COMPARATIVE SHARE ANALYSIS OF SPECIALTY TIRE MARKET FOR OFF-ROADING, BY COUNTRY 2022 AND 2032(%)
- FIGURE 18. COMPARATIVE SHARE ANALYSIS OF SPECIALTY TIRE MARKET FOR OTHERS, BY COUNTRY 2022 AND 2032(%)
- FIGURE 19. SPECIALTY TIRE MARKET, BY SALES CHANNEL, 2022 AND 2032(%)
- FIGURE 20. COMPARATIVE SHARE ANALYSIS OF SPECIALTY TIRE MARKET FOR ORIGINAL EQUIPMENT MANUFACTURERS (OEMS), BY COUNTRY 2022 AND 2032(%)
- FIGURE 21. COMPARATIVE SHARE ANALYSIS OF SPECIALTY TIRE MARKET FOR AFTERMARKET, BY COUNTRY 2022 AND 2032(%)
- FIGURE 22. SPECIALTY TIRE MARKET BY REGION, 2022 AND 2032(%)
- FIGURE 23. U.S. SPECIALTY TIRE MARKET, 2022-2032 ($MILLION)
- FIGURE 24. CANADA SPECIALTY TIRE MARKET, 2022-2032 ($MILLION)
- FIGURE 25. MEXICO SPECIALTY TIRE MARKET, 2022-2032 ($MILLION)
- FIGURE 26. UK SPECIALTY TIRE MARKET, 2022-2032 ($MILLION)
- FIGURE 27. GERMANY SPECIALTY TIRE MARKET, 2022-2032 ($MILLION)
- FIGURE 28. FRANCE SPECIALTY TIRE MARKET, 2022-2032 ($MILLION)
- FIGURE 29. RUSSIA SPECIALTY TIRE MARKET, 2022-2032 ($MILLION)
- FIGURE 30. REST OF EUROPE SPECIALTY TIRE MARKET, 2022-2032 ($MILLION)
- FIGURE 31. CHINA SPECIALTY TIRE MARKET, 2022-2032 ($MILLION)
- FIGURE 32. JAPAN SPECIALTY TIRE MARKET, 2022-2032 ($MILLION)
- FIGURE 33. INDIA SPECIALTY TIRE MARKET, 2022-2032 ($MILLION)
- FIGURE 34. SOUTH KOREA SPECIALTY TIRE MARKET, 2022-2032 ($MILLION)
- FIGURE 35. REST OF ASIA-PACIFIC SPECIALTY TIRE MARKET, 2022-2032 ($MILLION)
- FIGURE 36. LATIN AMERICA SPECIALTY TIRE MARKET, 2022-2032 ($MILLION)
- FIGURE 37. MIDDLE EAST SPECIALTY TIRE MARKET, 2022-2032 ($MILLION)
- FIGURE 38. AFRICA SPECIALTY TIRE MARKET, 2022-2032 ($MILLION)
- FIGURE 39. TOP WINNING STRATEGIES, BY YEAR (2020-2023)
- FIGURE 40. TOP WINNING STRATEGIES, BY DEVELOPMENT (2020-2023)
- FIGURE 41. TOP WINNING STRATEGIES, BY COMPANY (2020-2023)
- FIGURE 42. PRODUCT MAPPING OF TOP 10 PLAYERS
- FIGURE 43. COMPETITIVE DASHBOARD
- FIGURE 44. COMPETITIVE HEATMAP: SPECIALTY TIRE MARKET
- FIGURE 45. TOP PLAYER POSITIONING, 2022
- FIGURE 46. CEAT LTD.: NET SALES, 2020-2022 ($MILLION)
- FIGURE 47. CEAT LTD.: RESEARCH & DEVELOPMENT EXPENDITURE, 2020-2022 ($MILLION)
- FIGURE 48. CEAT LTD.: REVENUE SHARE BY SEGMENT, 2022 (%)
- FIGURE 49. CEAT LTD.: REVENUE SHARE BY REGION, 2022 (%)
- FIGURE 50. MICHELIN: NET SALES, 2020-2022 ($MILLION)
- FIGURE 51. MICHELIN: RESEARCH & DEVELOPMENT EXPENDITURE, 2020-2022 ($MILLION)
- FIGURE 52. MICHELIN: REVENUE SHARE BY SEGMENT, 2022 (%)
- FIGURE 53. MICHELIN: REVENUE SHARE BY REGION, 2022 (%)
- FIGURE 54. BRIDGESTONE CORPORATION: RESEARCH & DEVELOPMENT EXPENDITURE, 2020-2022 ($MILLION)
- FIGURE 55. BRIDGESTONE CORPORATION: NET SALES, 2020-2022 ($MILLION)
- FIGURE 56. BRIDGESTONE CORPORATION: REVENUE SHARE BY REGION, 2022 (%)
- FIGURE 57. CONTINENTAL AG: NET SALES, 2020-2022 ($MILLION)
- FIGURE 58. CONTINENTAL AG: RESEARCH & DEVELOPMENT EXPENDITURE, 2020-2022 ($MILLION)
- FIGURE 59. CONTINENTAL AG: REVENUE SHARE BY SEGMENT, 2022 (%)
- FIGURE 60. CONTINENTAL AG: REVENUE SHARE BY REGION, 2022 (%)
- FIGURE 61. NOKIAN TYRES PLC.: NET SALES, 2020-2022 ($MILLION)
- FIGURE 62. NOKIAN TYRES PLC.: RESEARCH & DEVELOPMENT EXPENDITURE, 2020-2022 ($MILLION)
- FIGURE 63. NOKIAN TYRES PLC.: REVENUE SHARE BY SEGMENT, 2022 (%)
- FIGURE 64. NOKIAN TYRES PLC.: REVENUE SHARE BY REGION, 2022 (%)

