
PUBLISHER: Allied Market Research | PRODUCT CODE: 1414990

PUBLISHER: Allied Market Research | PRODUCT CODE: 1414990
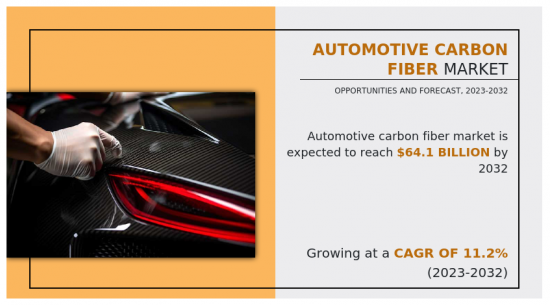
Automotive Carbon Fiber Market By Material (Polyacrylonitrile , Pitch), By Vehicle Type, By Sales Channel, By Application : Global Opportunity Analysis and Industry Forecast, 2023-2032
"The automotive carbon fiber market is expected to experience a significant growth rate of 11.16% from 2023-2032 due to the surge in adoption of carbon fiber in automobiles." - Allied Market Research.
Significant factors impacting the growth of the automotive carbon fiber market include adoption of carbon fiber in automobiles, stringent government regulations on emission norms. However, the high cost of carbon fibers hampers market growth. In addition, growth in sales of zero emission vehicles presents significant opportunities for market expansion.
Enhancing the fuel efficiency of automobiles along with maintaining safety and performance relies significantly on advanced materials. The potential for increased vehicle efficiency lies in the use of lightweight materials, as it requires less energy to accelerate a lighter object compared to a heavier one. A 10% decrease in vehicle weight has the potential to yield a 6%-8% improvement in fuel economy. Carbon fibers are lighter compared to steel and aluminium due which it is replacing the same for vehicle part production.
The market is experiencing growth driven by a rising need for vehicle stability on roads and a focus on enhancing the durability and performance of vehicles to ensure efficient fuel consumption across the regions. Additionally, strict pollution regulations in North America and Europe have compelled manufacturers to incorporate lightweight materials in the production process, thereby bolstering market growth.
Increase in global concerns regarding the negative effect of climate change along with alarming pollution levels recorded in major cities have created a significant demand for electric vehicles. This involves the use of electric vehicles that do not use gas and are more economical than conventional vehicles. Carbon fibers are widely used to manufacture parts of the electric vehicles such as clutch plates, breaks, and other parts as it saves energy reduces emissions. An electric vehicle converts over 50% of the electrical energy from the grid to power at the wheels, whereas the gas-powered vehicle only manages to convert about 17%-21% of the energy stored in gasoline.
PAN-based carbon fiber materials are preferred for use in the automotive industry owing to their high strength, low heat expansion, moisture absorption, lightweight, specific strength, ease of use, and thermal conductivity. There is no significant growth in technology used to manufacture PAN precursors and carbon fibers, and thus there is high scope for improvement in process and product areas. This factor is expected to enhance the overall market demand for PAN-based carbon fiber market.
The demand for fuel-efficient vehicles has increased recently, owing to the rise in the price of petrol and diesel. This is due to depleting fossil fuel reserves and growth in tendency of companies to gain maximum profit from oil reserves. Thus, these factors give rise to the need for advanced fuel-efficient technologies, leading to a surge in demand for carbon fiber for vehicle parts production.
The automotive carbon fiber market is segmented into material, vehicle type, application, sales channel and region. On the basis of material, the market is classified into Polyacrylonitrile (PAN) and Pitch. On the basis of vehicle type, it is categorized into two-wheelers, passenger vehicle and commercial vehicle. By application, the market is divided into structural assembly, powertrain component, interior and exterior. On the basis of sales channel, the market is segmented into OEM and aftermarket. Region-wise, it is analyzed across North America, Europe, Asia-Pacific, and LAMEA.
Key players covered in the report include: DowAksa Advanced Composite Material Industries Limited, Mitsubishi Chemical Corporation, Toray Industries, Inc., Nippon Graphite Fiber Co., Ltd., Hyosung Advanced Materials, Hexcel Corporation, Teijin Limited, Formosa Plastics Corporation, SGL Carbon, Solvay S.A.
Additional benefits you will get with this purchase are:
- Quarterly Update and* (only available with a corporate license, on listed price)
- 5 additional Company Profile of client Choice pre- or Post-purchase, as a free update.
- Free Upcoming Version on the Purchase of Five and Enterprise User License.
- 16 analyst hours of support* (post-purchase, if you find additional data requirements upon review of the report, you may receive support amounting to 16 analyst hours to solve questions, and post-sale queries)
- 15% Free Customization* (in case the scope or segment of the report does not match your requirements, 15% is equivalent to 3 working days of free work, applicable once)
- Free data Pack on the Five and Enterprise User License. (Excel version of the report)
- Free Updated report if the report is 6-12 months old or older.
- 24-hour priority response*
- Free Industry updates and white papers.
Possible Customization with this report (with additional cost and timeline, please talk to the sales executive to know more)
- Technology Trend Analysis
- Brands Share Analysis
- SWOT Analysis
Key Market Segments
By Sales Channel
- OEM
- Aftermarket
By Application
- Structural Assembly
- Powertrain Components
- Interior and Exterior
By Material
- Polyacrylonitrile (PAN)
- Pitch
By Vehicle Type
- Two-Wheeler
- Passenger Vehicle
- Commercial Vehicle
By Region
- North America
- U.S.
- Canada
- Mexico
- Europe
- Germany
- UK
- France
- Italy
- Rest Of The Europe
- Asia-Pacific
- China
- Japan
- India
- South Korea
- Rest of Asia-Pacific
- LAMEA
- Latin America
- Middle-East
- Africa
Key Market Players:
- TORAY INDUSTRIES, INC.
- Hexcel Corporation
- Solvay S.A.
- Mitsubishi Chemical Corporation
- TEIJIN LIMITED.
- Nippon Graphite Fiber Co., Ltd.
- DowAksa Advanced Composites Holdings BV
- HYOSUNG ADVANCED MATERIALS
- SGL Carbon
- Formosa Plastics Corporation
TABLE OF CONTENTS
CHAPTER 1: INTRODUCTION
- 1.1. Report description
- 1.2. Key market segments
- 1.3. Key benefits to the stakeholders
- 1.4. Research methodology
- 1.4.1. Primary research
- 1.4.2. Secondary research
- 1.4.3. Analyst tools and models
CHAPTER 2: EXECUTIVE SUMMARY
- 2.1. CXO Perspective
CHAPTER 3: MARKET OVERVIEW
- 3.1. Market definition and scope
- 3.2. Key findings
- 3.2.1. Top impacting factors
- 3.2.2. Top investment pockets
- 3.3. Porter's five forces analysis
- 3.3.1. Low bargaining power of suppliers
- 3.3.2. Low threat of new entrants
- 3.3.3. Low threat of substitutes
- 3.3.4. Low intensity of rivalry
- 3.3.5. Low bargaining power of buyers
- 3.4. Market dynamics
- 3.4.1. Drivers
- 3.4.1.1. Surge in adoption of carbon fiber in automobiles
- 3.4.1.2. Stringent government regulations on emission norms
- 3.4.2. Restraints
- 3.4.2.1. High cost of carbon fibres along with non-biodegradability
- 3.4.3. Opportunities
- 3.4.3.1. Growth in sales of zero emission vehicle
- 3.4.3.2. Demand for lightweight material in vehicle production
- 3.4.1. Drivers
CHAPTER 4: AUTOMOTIVE CARBON FIBER MARKET, BY MATERIAL
- 4.1. Overview
- 4.1.1. Market size and forecast
- 4.2. Polyacrylonitrile (PAN)
- 4.2.1. Key market trends, growth factors and opportunities
- 4.2.2. Market size and forecast, by region
- 4.2.3. Market share analysis by country
- 4.3. Pitch
- 4.3.1. Key market trends, growth factors and opportunities
- 4.3.2. Market size and forecast, by region
- 4.3.3. Market share analysis by country
CHAPTER 5: AUTOMOTIVE CARBON FIBER MARKET, BY VEHICLE TYPE
- 5.1. Overview
- 5.1.1. Market size and forecast
- 5.2. Two-Wheeler
- 5.2.1. Key market trends, growth factors and opportunities
- 5.2.2. Market size and forecast, by region
- 5.2.3. Market share analysis by country
- 5.3. Passenger Vehicle
- 5.3.1. Key market trends, growth factors and opportunities
- 5.3.2. Market size and forecast, by region
- 5.3.3. Market share analysis by country
- 5.4. Commercial Vehicle
- 5.4.1. Key market trends, growth factors and opportunities
- 5.4.2. Market size and forecast, by region
- 5.4.3. Market share analysis by country
CHAPTER 6: AUTOMOTIVE CARBON FIBER MARKET, BY SALES CHANNEL
- 6.1. Overview
- 6.1.1. Market size and forecast
- 6.2. OEM
- 6.2.1. Key market trends, growth factors and opportunities
- 6.2.2. Market size and forecast, by region
- 6.2.3. Market share analysis by country
- 6.3. Aftermarket
- 6.3.1. Key market trends, growth factors and opportunities
- 6.3.2. Market size and forecast, by region
- 6.3.3. Market share analysis by country
CHAPTER 7: AUTOMOTIVE CARBON FIBER MARKET, BY APPLICATION
- 7.1. Overview
- 7.1.1. Market size and forecast
- 7.2. Structural Assembly
- 7.2.1. Key market trends, growth factors and opportunities
- 7.2.2. Market size and forecast, by region
- 7.2.3. Market share analysis by country
- 7.3. Powertrain Components
- 7.3.1. Key market trends, growth factors and opportunities
- 7.3.2. Market size and forecast, by region
- 7.3.3. Market share analysis by country
- 7.4. Interior and Exterior
- 7.4.1. Key market trends, growth factors and opportunities
- 7.4.2. Market size and forecast, by region
- 7.4.3. Market share analysis by country
CHAPTER 8: AUTOMOTIVE CARBON FIBER MARKET, BY REGION
- 8.1. Overview
- 8.1.1. Market size and forecast By Region
- 8.2. North America
- 8.2.1. Key market trends, growth factors and opportunities
- 8.2.2. Market size and forecast, by Material
- 8.2.3. Market size and forecast, by Vehicle Type
- 8.2.4. Market size and forecast, by Sales Channel
- 8.2.5. Market size and forecast, by Application
- 8.2.6. Market size and forecast, by country
- 8.2.6.1. U.S.
- 8.2.6.1.1. Market size and forecast, by Material
- 8.2.6.1.2. Market size and forecast, by Vehicle Type
- 8.2.6.1.3. Market size and forecast, by Sales Channel
- 8.2.6.1.4. Market size and forecast, by Application
- 8.2.6.2. Canada
- 8.2.6.2.1. Market size and forecast, by Material
- 8.2.6.2.2. Market size and forecast, by Vehicle Type
- 8.2.6.2.3. Market size and forecast, by Sales Channel
- 8.2.6.2.4. Market size and forecast, by Application
- 8.2.6.3. Mexico
- 8.2.6.3.1. Market size and forecast, by Material
- 8.2.6.3.2. Market size and forecast, by Vehicle Type
- 8.2.6.3.3. Market size and forecast, by Sales Channel
- 8.2.6.3.4. Market size and forecast, by Application
- 8.3. Europe
- 8.3.1. Key market trends, growth factors and opportunities
- 8.3.2. Market size and forecast, by Material
- 8.3.3. Market size and forecast, by Vehicle Type
- 8.3.4. Market size and forecast, by Sales Channel
- 8.3.5. Market size and forecast, by Application
- 8.3.6. Market size and forecast, by country
- 8.3.6.1. Germany
- 8.3.6.1.1. Market size and forecast, by Material
- 8.3.6.1.2. Market size and forecast, by Vehicle Type
- 8.3.6.1.3. Market size and forecast, by Sales Channel
- 8.3.6.1.4. Market size and forecast, by Application
- 8.3.6.2. UK
- 8.3.6.2.1. Market size and forecast, by Material
- 8.3.6.2.2. Market size and forecast, by Vehicle Type
- 8.3.6.2.3. Market size and forecast, by Sales Channel
- 8.3.6.2.4. Market size and forecast, by Application
- 8.3.6.3. France
- 8.3.6.3.1. Market size and forecast, by Material
- 8.3.6.3.2. Market size and forecast, by Vehicle Type
- 8.3.6.3.3. Market size and forecast, by Sales Channel
- 8.3.6.3.4. Market size and forecast, by Application
- 8.3.6.4. Italy
- 8.3.6.4.1. Market size and forecast, by Material
- 8.3.6.4.2. Market size and forecast, by Vehicle Type
- 8.3.6.4.3. Market size and forecast, by Sales Channel
- 8.3.6.4.4. Market size and forecast, by Application
- 8.3.6.5. Rest Of The Europe
- 8.3.6.5.1. Market size and forecast, by Material
- 8.3.6.5.2. Market size and forecast, by Vehicle Type
- 8.3.6.5.3. Market size and forecast, by Sales Channel
- 8.3.6.5.4. Market size and forecast, by Application
- 8.4. Asia-Pacific
- 8.4.1. Key market trends, growth factors and opportunities
- 8.4.2. Market size and forecast, by Material
- 8.4.3. Market size and forecast, by Vehicle Type
- 8.4.4. Market size and forecast, by Sales Channel
- 8.4.5. Market size and forecast, by Application
- 8.4.6. Market size and forecast, by country
- 8.4.6.1. China
- 8.4.6.1.1. Market size and forecast, by Material
- 8.4.6.1.2. Market size and forecast, by Vehicle Type
- 8.4.6.1.3. Market size and forecast, by Sales Channel
- 8.4.6.1.4. Market size and forecast, by Application
- 8.4.6.2. Japan
- 8.4.6.2.1. Market size and forecast, by Material
- 8.4.6.2.2. Market size and forecast, by Vehicle Type
- 8.4.6.2.3. Market size and forecast, by Sales Channel
- 8.4.6.2.4. Market size and forecast, by Application
- 8.4.6.3. India
- 8.4.6.3.1. Market size and forecast, by Material
- 8.4.6.3.2. Market size and forecast, by Vehicle Type
- 8.4.6.3.3. Market size and forecast, by Sales Channel
- 8.4.6.3.4. Market size and forecast, by Application
- 8.4.6.4. South Korea
- 8.4.6.4.1. Market size and forecast, by Material
- 8.4.6.4.2. Market size and forecast, by Vehicle Type
- 8.4.6.4.3. Market size and forecast, by Sales Channel
- 8.4.6.4.4. Market size and forecast, by Application
- 8.4.6.5. Rest of Asia-Pacific
- 8.4.6.5.1. Market size and forecast, by Material
- 8.4.6.5.2. Market size and forecast, by Vehicle Type
- 8.4.6.5.3. Market size and forecast, by Sales Channel
- 8.4.6.5.4. Market size and forecast, by Application
- 8.5. LAMEA
- 8.5.1. Key market trends, growth factors and opportunities
- 8.5.2. Market size and forecast, by Material
- 8.5.3. Market size and forecast, by Vehicle Type
- 8.5.4. Market size and forecast, by Sales Channel
- 8.5.5. Market size and forecast, by Application
- 8.5.6. Market size and forecast, by country
- 8.5.6.1. Latin America
- 8.5.6.1.1. Market size and forecast, by Material
- 8.5.6.1.2. Market size and forecast, by Vehicle Type
- 8.5.6.1.3. Market size and forecast, by Sales Channel
- 8.5.6.1.4. Market size and forecast, by Application
- 8.5.6.2. Middle-East
- 8.5.6.2.1. Market size and forecast, by Material
- 8.5.6.2.2. Market size and forecast, by Vehicle Type
- 8.5.6.2.3. Market size and forecast, by Sales Channel
- 8.5.6.2.4. Market size and forecast, by Application
- 8.5.6.3. Africa
- 8.5.6.3.1. Market size and forecast, by Material
- 8.5.6.3.2. Market size and forecast, by Vehicle Type
- 8.5.6.3.3. Market size and forecast, by Sales Channel
- 8.5.6.3.4. Market size and forecast, by Application
CHAPTER 9: COMPETITIVE LANDSCAPE
- 9.1. Introduction
- 9.2. Top winning strategies
- 9.3. Product mapping of top 10 player
- 9.4. Competitive dashboard
- 9.5. Competitive heatmap
- 9.6. Top player positioning, 2022
CHAPTER 10: COMPANY PROFILES
- 10.1. Mitsubishi Chemical Corporation
- 10.1.1. Company overview
- 10.1.2. Key executives
- 10.1.3. Company snapshot
- 10.1.4. Operating business segments
- 10.1.5. Product portfolio
- 10.1.6. Business performance
- 10.1.7. Key strategic moves and developments
- 10.2. TORAY INDUSTRIES, INC.
- 10.2.1. Company overview
- 10.2.2. Key executives
- 10.2.3. Company snapshot
- 10.2.4. Operating business segments
- 10.2.5. Product portfolio
- 10.2.6. Business performance
- 10.2.7. Key strategic moves and developments
- 10.3. Hexcel Corporation
- 10.3.1. Company overview
- 10.3.2. Key executives
- 10.3.3. Company snapshot
- 10.3.4. Operating business segments
- 10.3.5. Product portfolio
- 10.3.6. Business performance
- 10.4. SGL Carbon
- 10.4.1. Company overview
- 10.4.2. Key executives
- 10.4.3. Company snapshot
- 10.4.4. Operating business segments
- 10.4.5. Product portfolio
- 10.4.6. Business performance
- 10.4.7. Key strategic moves and developments
- 10.5. TEIJIN LIMITED.
- 10.5.1. Company overview
- 10.5.2. Key executives
- 10.5.3. Company snapshot
- 10.5.4. Operating business segments
- 10.5.5. Product portfolio
- 10.5.6. Business performance
- 10.6. DowAksa Advanced Composites Holdings BV
- 10.6.1. Company overview
- 10.6.2. Key executives
- 10.6.3. Company snapshot
- 10.6.4. Operating business segments
- 10.6.5. Product portfolio
- 10.7. Formosa Plastics Corporation
- 10.7.1. Company overview
- 10.7.2. Key executives
- 10.7.3. Company snapshot
- 10.7.4. Operating business segments
- 10.7.5. Product portfolio
- 10.7.6. Business performance
- 10.8. HYOSUNG ADVANCED MATERIALS
- 10.8.1. Company overview
- 10.8.2. Key executives
- 10.8.3. Company snapshot
- 10.8.4. Operating business segments
- 10.8.5. Product portfolio
- 10.9. Nippon Graphite Fiber Co., Ltd.
- 10.9.1. Company overview
- 10.9.2. Key executives
- 10.9.3. Company snapshot
- 10.9.4. Operating business segments
- 10.9.5. Product portfolio
- 10.10. Solvay S.A.
- 10.10.1. Company overview
- 10.10.2. Key executives
- 10.10.3. Company snapshot
- 10.10.4. Operating business segments
- 10.10.5. Product portfolio
- 10.10.6. Business performance
LIST OF TABLES
- TABLE 01. GLOBAL AUTOMOTIVE CARBON FIBER MARKET, BY MATERIAL, 2022-2032 ($MILLION)
- TABLE 02. AUTOMOTIVE CARBON FIBER MARKET FOR POLYACRYLONITRILE (PAN) , BY REGION, 2022-2032 ($MILLION)
- TABLE 03. AUTOMOTIVE CARBON FIBER MARKET FOR PITCH, BY REGION, 2022-2032 ($MILLION)
- TABLE 04. GLOBAL AUTOMOTIVE CARBON FIBER MARKET, BY VEHICLE TYPE, 2022-2032 ($MILLION)
- TABLE 05. AUTOMOTIVE CARBON FIBER MARKET FOR TWO-WHEELER, BY REGION, 2022-2032 ($MILLION)
- TABLE 06. AUTOMOTIVE CARBON FIBER MARKET FOR PASSENGER VEHICLE, BY REGION, 2022-2032 ($MILLION)
- TABLE 07. AUTOMOTIVE CARBON FIBER MARKET FOR COMMERCIAL VEHICLE, BY REGION, 2022-2032 ($MILLION)
- TABLE 08. GLOBAL AUTOMOTIVE CARBON FIBER MARKET, BY SALES CHANNEL, 2022-2032 ($MILLION)
- TABLE 09. AUTOMOTIVE CARBON FIBER MARKET FOR OEM, BY REGION, 2022-2032 ($MILLION)
- TABLE 10. AUTOMOTIVE CARBON FIBER MARKET FOR AFTERMARKET, BY REGION, 2022-2032 ($MILLION)
- TABLE 11. GLOBAL AUTOMOTIVE CARBON FIBER MARKET, BY APPLICATION, 2022-2032 ($MILLION)
- TABLE 12. AUTOMOTIVE CARBON FIBER MARKET FOR STRUCTURAL ASSEMBLY, BY REGION, 2022-2032 ($MILLION)
- TABLE 13. AUTOMOTIVE CARBON FIBER MARKET FOR POWERTRAIN COMPONENTS, BY REGION, 2022-2032 ($MILLION)
- TABLE 14. AUTOMOTIVE CARBON FIBER MARKET FOR INTERIOR AND EXTERIOR, BY REGION, 2022-2032 ($MILLION)
- TABLE 15. AUTOMOTIVE CARBON FIBER MARKET, BY REGION, 2022-2032 ($MILLION)
- TABLE 16. NORTH AMERICA AUTOMOTIVE CARBON FIBER MARKET, BY MATERIAL, 2022-2032 ($MILLION)
- TABLE 17. NORTH AMERICA AUTOMOTIVE CARBON FIBER MARKET, BY VEHICLE TYPE, 2022-2032 ($MILLION)
- TABLE 18. NORTH AMERICA AUTOMOTIVE CARBON FIBER MARKET, BY SALES CHANNEL, 2022-2032 ($MILLION)
- TABLE 19. NORTH AMERICA AUTOMOTIVE CARBON FIBER MARKET, BY APPLICATION, 2022-2032 ($MILLION)
- TABLE 20. NORTH AMERICA AUTOMOTIVE CARBON FIBER MARKET, BY COUNTRY, 2022-2032 ($MILLION)
- TABLE 21. U.S. AUTOMOTIVE CARBON FIBER MARKET, BY MATERIAL, 2022-2032 ($MILLION)
- TABLE 22. U.S. AUTOMOTIVE CARBON FIBER MARKET, BY VEHICLE TYPE, 2022-2032 ($MILLION)
- TABLE 23. U.S. AUTOMOTIVE CARBON FIBER MARKET, BY SALES CHANNEL, 2022-2032 ($MILLION)
- TABLE 24. U.S. AUTOMOTIVE CARBON FIBER MARKET, BY APPLICATION, 2022-2032 ($MILLION)
- TABLE 25. CANADA AUTOMOTIVE CARBON FIBER MARKET, BY MATERIAL, 2022-2032 ($MILLION)
- TABLE 26. CANADA AUTOMOTIVE CARBON FIBER MARKET, BY VEHICLE TYPE, 2022-2032 ($MILLION)
- TABLE 27. CANADA AUTOMOTIVE CARBON FIBER MARKET, BY SALES CHANNEL, 2022-2032 ($MILLION)
- TABLE 28. CANADA AUTOMOTIVE CARBON FIBER MARKET, BY APPLICATION, 2022-2032 ($MILLION)
- TABLE 29. MEXICO AUTOMOTIVE CARBON FIBER MARKET, BY MATERIAL, 2022-2032 ($MILLION)
- TABLE 30. MEXICO AUTOMOTIVE CARBON FIBER MARKET, BY VEHICLE TYPE, 2022-2032 ($MILLION)
- TABLE 31. MEXICO AUTOMOTIVE CARBON FIBER MARKET, BY SALES CHANNEL, 2022-2032 ($MILLION)
- TABLE 32. MEXICO AUTOMOTIVE CARBON FIBER MARKET, BY APPLICATION, 2022-2032 ($MILLION)
- TABLE 33. EUROPE AUTOMOTIVE CARBON FIBER MARKET, BY MATERIAL, 2022-2032 ($MILLION)
- TABLE 34. EUROPE AUTOMOTIVE CARBON FIBER MARKET, BY VEHICLE TYPE, 2022-2032 ($MILLION)
- TABLE 35. EUROPE AUTOMOTIVE CARBON FIBER MARKET, BY SALES CHANNEL, 2022-2032 ($MILLION)
- TABLE 36. EUROPE AUTOMOTIVE CARBON FIBER MARKET, BY APPLICATION, 2022-2032 ($MILLION)
- TABLE 37. EUROPE AUTOMOTIVE CARBON FIBER MARKET, BY COUNTRY, 2022-2032 ($MILLION)
- TABLE 38. GERMANY AUTOMOTIVE CARBON FIBER MARKET, BY MATERIAL, 2022-2032 ($MILLION)
- TABLE 39. GERMANY AUTOMOTIVE CARBON FIBER MARKET, BY VEHICLE TYPE, 2022-2032 ($MILLION)
- TABLE 40. GERMANY AUTOMOTIVE CARBON FIBER MARKET, BY SALES CHANNEL, 2022-2032 ($MILLION)
- TABLE 41. GERMANY AUTOMOTIVE CARBON FIBER MARKET, BY APPLICATION, 2022-2032 ($MILLION)
- TABLE 42. UK AUTOMOTIVE CARBON FIBER MARKET, BY MATERIAL, 2022-2032 ($MILLION)
- TABLE 43. UK AUTOMOTIVE CARBON FIBER MARKET, BY VEHICLE TYPE, 2022-2032 ($MILLION)
- TABLE 44. UK AUTOMOTIVE CARBON FIBER MARKET, BY SALES CHANNEL, 2022-2032 ($MILLION)
- TABLE 45. UK AUTOMOTIVE CARBON FIBER MARKET, BY APPLICATION, 2022-2032 ($MILLION)
- TABLE 46. FRANCE AUTOMOTIVE CARBON FIBER MARKET, BY MATERIAL, 2022-2032 ($MILLION)
- TABLE 47. FRANCE AUTOMOTIVE CARBON FIBER MARKET, BY VEHICLE TYPE, 2022-2032 ($MILLION)
- TABLE 48. FRANCE AUTOMOTIVE CARBON FIBER MARKET, BY SALES CHANNEL, 2022-2032 ($MILLION)
- TABLE 49. FRANCE AUTOMOTIVE CARBON FIBER MARKET, BY APPLICATION, 2022-2032 ($MILLION)
- TABLE 50. ITALY AUTOMOTIVE CARBON FIBER MARKET, BY MATERIAL, 2022-2032 ($MILLION)
- TABLE 51. ITALY AUTOMOTIVE CARBON FIBER MARKET, BY VEHICLE TYPE, 2022-2032 ($MILLION)
- TABLE 52. ITALY AUTOMOTIVE CARBON FIBER MARKET, BY SALES CHANNEL, 2022-2032 ($MILLION)
- TABLE 53. ITALY AUTOMOTIVE CARBON FIBER MARKET, BY APPLICATION, 2022-2032 ($MILLION)
- TABLE 54. REST OF THE EUROPE AUTOMOTIVE CARBON FIBER MARKET, BY MATERIAL, 2022-2032 ($MILLION)
- TABLE 55. REST OF THE EUROPE AUTOMOTIVE CARBON FIBER MARKET, BY VEHICLE TYPE, 2022-2032 ($MILLION)
- TABLE 56. REST OF THE EUROPE AUTOMOTIVE CARBON FIBER MARKET, BY SALES CHANNEL, 2022-2032 ($MILLION)
- TABLE 57. REST OF THE EUROPE AUTOMOTIVE CARBON FIBER MARKET, BY APPLICATION, 2022-2032 ($MILLION)
- TABLE 58. ASIA-PACIFIC AUTOMOTIVE CARBON FIBER MARKET, BY MATERIAL, 2022-2032 ($MILLION)
- TABLE 59. ASIA-PACIFIC AUTOMOTIVE CARBON FIBER MARKET, BY VEHICLE TYPE, 2022-2032 ($MILLION)
- TABLE 60. ASIA-PACIFIC AUTOMOTIVE CARBON FIBER MARKET, BY SALES CHANNEL, 2022-2032 ($MILLION)
- TABLE 61. ASIA-PACIFIC AUTOMOTIVE CARBON FIBER MARKET, BY APPLICATION, 2022-2032 ($MILLION)
- TABLE 62. ASIA-PACIFIC AUTOMOTIVE CARBON FIBER MARKET, BY COUNTRY, 2022-2032 ($MILLION)
- TABLE 63. CHINA AUTOMOTIVE CARBON FIBER MARKET, BY MATERIAL, 2022-2032 ($MILLION)
- TABLE 64. CHINA AUTOMOTIVE CARBON FIBER MARKET, BY VEHICLE TYPE, 2022-2032 ($MILLION)
- TABLE 65. CHINA AUTOMOTIVE CARBON FIBER MARKET, BY SALES CHANNEL, 2022-2032 ($MILLION)
- TABLE 66. CHINA AUTOMOTIVE CARBON FIBER MARKET, BY APPLICATION, 2022-2032 ($MILLION)
- TABLE 67. JAPAN AUTOMOTIVE CARBON FIBER MARKET, BY MATERIAL, 2022-2032 ($MILLION)
- TABLE 68. JAPAN AUTOMOTIVE CARBON FIBER MARKET, BY VEHICLE TYPE, 2022-2032 ($MILLION)
- TABLE 69. JAPAN AUTOMOTIVE CARBON FIBER MARKET, BY SALES CHANNEL, 2022-2032 ($MILLION)
- TABLE 70. JAPAN AUTOMOTIVE CARBON FIBER MARKET, BY APPLICATION, 2022-2032 ($MILLION)
- TABLE 71. INDIA AUTOMOTIVE CARBON FIBER MARKET, BY MATERIAL, 2022-2032 ($MILLION)
- TABLE 72. INDIA AUTOMOTIVE CARBON FIBER MARKET, BY VEHICLE TYPE, 2022-2032 ($MILLION)
- TABLE 73. INDIA AUTOMOTIVE CARBON FIBER MARKET, BY SALES CHANNEL, 2022-2032 ($MILLION)
- TABLE 74. INDIA AUTOMOTIVE CARBON FIBER MARKET, BY APPLICATION, 2022-2032 ($MILLION)
- TABLE 75. SOUTH KOREA AUTOMOTIVE CARBON FIBER MARKET, BY MATERIAL, 2022-2032 ($MILLION)
- TABLE 76. SOUTH KOREA AUTOMOTIVE CARBON FIBER MARKET, BY VEHICLE TYPE, 2022-2032 ($MILLION)
- TABLE 77. SOUTH KOREA AUTOMOTIVE CARBON FIBER MARKET, BY SALES CHANNEL, 2022-2032 ($MILLION)
- TABLE 78. SOUTH KOREA AUTOMOTIVE CARBON FIBER MARKET, BY APPLICATION, 2022-2032 ($MILLION)
- TABLE 79. REST OF ASIA-PACIFIC AUTOMOTIVE CARBON FIBER MARKET, BY MATERIAL, 2022-2032 ($MILLION)
- TABLE 80. REST OF ASIA-PACIFIC AUTOMOTIVE CARBON FIBER MARKET, BY VEHICLE TYPE, 2022-2032 ($MILLION)
- TABLE 81. REST OF ASIA-PACIFIC AUTOMOTIVE CARBON FIBER MARKET, BY SALES CHANNEL, 2022-2032 ($MILLION)
- TABLE 82. REST OF ASIA-PACIFIC AUTOMOTIVE CARBON FIBER MARKET, BY APPLICATION, 2022-2032 ($MILLION)
- TABLE 83. LAMEA AUTOMOTIVE CARBON FIBER MARKET, BY MATERIAL, 2022-2032 ($MILLION)
- TABLE 84. LAMEA AUTOMOTIVE CARBON FIBER MARKET, BY VEHICLE TYPE, 2022-2032 ($MILLION)
- TABLE 85. LAMEA AUTOMOTIVE CARBON FIBER MARKET, BY SALES CHANNEL, 2022-2032 ($MILLION)
- TABLE 86. LAMEA AUTOMOTIVE CARBON FIBER MARKET, BY APPLICATION, 2022-2032 ($MILLION)
- TABLE 87. LAMEA AUTOMOTIVE CARBON FIBER MARKET, BY COUNTRY, 2022-2032 ($MILLION)
- TABLE 88. LATIN AMERICA AUTOMOTIVE CARBON FIBER MARKET, BY MATERIAL, 2022-2032 ($MILLION)
- TABLE 89. LATIN AMERICA AUTOMOTIVE CARBON FIBER MARKET, BY VEHICLE TYPE, 2022-2032 ($MILLION)
- TABLE 90. LATIN AMERICA AUTOMOTIVE CARBON FIBER MARKET, BY SALES CHANNEL, 2022-2032 ($MILLION)
- TABLE 91. LATIN AMERICA AUTOMOTIVE CARBON FIBER MARKET, BY APPLICATION, 2022-2032 ($MILLION)
- TABLE 92. MIDDLE-EAST AUTOMOTIVE CARBON FIBER MARKET, BY MATERIAL, 2022-2032 ($MILLION)
- TABLE 93. MIDDLE-EAST AUTOMOTIVE CARBON FIBER MARKET, BY VEHICLE TYPE, 2022-2032 ($MILLION)
- TABLE 94. MIDDLE-EAST AUTOMOTIVE CARBON FIBER MARKET, BY SALES CHANNEL, 2022-2032 ($MILLION)
- TABLE 95. MIDDLE-EAST AUTOMOTIVE CARBON FIBER MARKET, BY APPLICATION, 2022-2032 ($MILLION)
- TABLE 96. AFRICA AUTOMOTIVE CARBON FIBER MARKET, BY MATERIAL, 2022-2032 ($MILLION)
- TABLE 97. AFRICA AUTOMOTIVE CARBON FIBER MARKET, BY VEHICLE TYPE, 2022-2032 ($MILLION)
- TABLE 98. AFRICA AUTOMOTIVE CARBON FIBER MARKET, BY SALES CHANNEL, 2022-2032 ($MILLION)
- TABLE 99. AFRICA AUTOMOTIVE CARBON FIBER MARKET, BY APPLICATION, 2022-2032 ($MILLION)
- TABLE 100. MITSUBISHI CHEMICAL CORPORATION: KEY EXECUTIVES
- TABLE 101. MITSUBISHI CHEMICAL CORPORATION: COMPANY SNAPSHOT
- TABLE 102. MITSUBISHI CHEMICAL CORPORATION: PRODUCT SEGMENTS
- TABLE 103. MITSUBISHI CHEMICAL CORPORATION: PRODUCT PORTFOLIO
- TABLE 104. MITSUBISHI CHEMICAL CORPORATION: KEY STRATERGIES
- TABLE 105. TORAY INDUSTRIES, INC.: KEY EXECUTIVES
- TABLE 106. TORAY INDUSTRIES, INC.: COMPANY SNAPSHOT
- TABLE 107. TORAY INDUSTRIES, INC.: PRODUCT SEGMENTS
- TABLE 108. TORAY INDUSTRIES, INC.: PRODUCT PORTFOLIO
- TABLE 109. TORAY INDUSTRIES, INC.: KEY STRATERGIES
- TABLE 110. HEXCEL CORPORATION: KEY EXECUTIVES
- TABLE 111. HEXCEL CORPORATION: COMPANY SNAPSHOT
- TABLE 112. HEXCEL CORPORATION: PRODUCT SEGMENTS
- TABLE 113. HEXCEL CORPORATION: PRODUCT PORTFOLIO
- TABLE 114. SGL CARBON: KEY EXECUTIVES
- TABLE 115. SGL CARBON: COMPANY SNAPSHOT
- TABLE 116. SGL CARBON: PRODUCT SEGMENTS
- TABLE 117. SGL CARBON: PRODUCT PORTFOLIO
- TABLE 118. SGL CARBON: KEY STRATERGIES
- TABLE 119. TEIJIN LIMITED.: KEY EXECUTIVES
- TABLE 120. TEIJIN LIMITED.: COMPANY SNAPSHOT
- TABLE 121. TEIJIN LIMITED.: PRODUCT SEGMENTS
- TABLE 122. TEIJIN LIMITED.: PRODUCT PORTFOLIO
- TABLE 123. DOWAKSA ADVANCED COMPOSITES HOLDINGS BV: KEY EXECUTIVES
- TABLE 124. DOWAKSA ADVANCED COMPOSITES HOLDINGS BV: COMPANY SNAPSHOT
- TABLE 125. DOWAKSA ADVANCED COMPOSITES HOLDINGS BV: PRODUCT SEGMENTS
- TABLE 126. DOWAKSA ADVANCED COMPOSITES HOLDINGS BV: SERVICE SEGMENTS
- TABLE 127. DOWAKSA ADVANCED COMPOSITES HOLDINGS BV: PRODUCT PORTFOLIO
- TABLE 128. FORMOSA PLASTICS CORPORATION: KEY EXECUTIVES
- TABLE 129. FORMOSA PLASTICS CORPORATION: COMPANY SNAPSHOT
- TABLE 130. FORMOSA PLASTICS CORPORATION: PRODUCT SEGMENTS
- TABLE 131. FORMOSA PLASTICS CORPORATION: PRODUCT PORTFOLIO
- TABLE 132. HYOSUNG ADVANCED MATERIALS: KEY EXECUTIVES
- TABLE 133. HYOSUNG ADVANCED MATERIALS: COMPANY SNAPSHOT
- TABLE 134. HYOSUNG ADVANCED MATERIALS: PRODUCT SEGMENTS
- TABLE 135. HYOSUNG ADVANCED MATERIALS: PRODUCT PORTFOLIO
- TABLE 136. NIPPON GRAPHITE FIBER CO., LTD.: KEY EXECUTIVES
- TABLE 137. NIPPON GRAPHITE FIBER CO., LTD.: COMPANY SNAPSHOT
- TABLE 138. NIPPON GRAPHITE FIBER CO., LTD.: PRODUCT SEGMENTS
- TABLE 139. NIPPON GRAPHITE FIBER CO., LTD.: PRODUCT PORTFOLIO
- TABLE 140. SOLVAY S.A.: KEY EXECUTIVES
- TABLE 141. SOLVAY S.A.: COMPANY SNAPSHOT
- TABLE 142. SOLVAY S.A.: PRODUCT SEGMENTS
- TABLE 143. SOLVAY S.A.: PRODUCT PORTFOLIO
LIST OF FIGURES
- FIGURE 01. AUTOMOTIVE CARBON FIBER MARKET, 2022-2032
- FIGURE 02. SEGMENTATION OF AUTOMOTIVE CARBON FIBER MARKET,2022-2032
- FIGURE 03. TOP IMPACTING FACTORS IN AUTOMOTIVE CARBON FIBER MARKET (2022 TO 2032)
- FIGURE 04. TOP INVESTMENT POCKETS IN AUTOMOTIVE CARBON FIBER MARKET (2023-2032)
- FIGURE 05. LOW BARGAINING POWER OF SUPPLIERS
- FIGURE 06. LOW THREAT OF NEW ENTRANTS
- FIGURE 07. LOW THREAT OF SUBSTITUTES
- FIGURE 08. LOW INTENSITY OF RIVALRY
- FIGURE 09. LOW BARGAINING POWER OF BUYERS
- FIGURE 10. GLOBAL AUTOMOTIVE CARBON FIBER MARKET:DRIVERS, RESTRAINTS AND OPPORTUNITIES
- FIGURE 11. AUTOMOTIVE CARBON FIBER MARKET, BY MATERIAL, 2022 AND 2032(%)
- FIGURE 12. COMPARATIVE SHARE ANALYSIS OF AUTOMOTIVE CARBON FIBER MARKET FOR POLYACRYLONITRILE (PAN) , BY COUNTRY 2022 AND 2032(%)
- FIGURE 13. COMPARATIVE SHARE ANALYSIS OF AUTOMOTIVE CARBON FIBER MARKET FOR PITCH, BY COUNTRY 2022 AND 2032(%)
- FIGURE 14. AUTOMOTIVE CARBON FIBER MARKET, BY VEHICLE TYPE, 2022 AND 2032(%)
- FIGURE 15. COMPARATIVE SHARE ANALYSIS OF AUTOMOTIVE CARBON FIBER MARKET FOR TWO-WHEELER, BY COUNTRY 2022 AND 2032(%)
- FIGURE 16. COMPARATIVE SHARE ANALYSIS OF AUTOMOTIVE CARBON FIBER MARKET FOR PASSENGER VEHICLE, BY COUNTRY 2022 AND 2032(%)
- FIGURE 17. COMPARATIVE SHARE ANALYSIS OF AUTOMOTIVE CARBON FIBER MARKET FOR COMMERCIAL VEHICLE, BY COUNTRY 2022 AND 2032(%)
- FIGURE 18. AUTOMOTIVE CARBON FIBER MARKET, BY SALES CHANNEL, 2022 AND 2032(%)
- FIGURE 19. COMPARATIVE SHARE ANALYSIS OF AUTOMOTIVE CARBON FIBER MARKET FOR OEM, BY COUNTRY 2022 AND 2032(%)
- FIGURE 20. COMPARATIVE SHARE ANALYSIS OF AUTOMOTIVE CARBON FIBER MARKET FOR AFTERMARKET, BY COUNTRY 2022 AND 2032(%)
- FIGURE 21. AUTOMOTIVE CARBON FIBER MARKET, BY APPLICATION, 2022 AND 2032(%)
- FIGURE 22. COMPARATIVE SHARE ANALYSIS OF AUTOMOTIVE CARBON FIBER MARKET FOR STRUCTURAL ASSEMBLY, BY COUNTRY 2022 AND 2032(%)
- FIGURE 23. COMPARATIVE SHARE ANALYSIS OF AUTOMOTIVE CARBON FIBER MARKET FOR POWERTRAIN COMPONENTS, BY COUNTRY 2022 AND 2032(%)
- FIGURE 24. COMPARATIVE SHARE ANALYSIS OF AUTOMOTIVE CARBON FIBER MARKET FOR INTERIOR AND EXTERIOR, BY COUNTRY 2022 AND 2032(%)
- FIGURE 25. AUTOMOTIVE CARBON FIBER MARKET BY REGION, 2022 AND 2032(%)
- FIGURE 26. U.S. AUTOMOTIVE CARBON FIBER MARKET, 2022-2032 ($MILLION)
- FIGURE 27. CANADA AUTOMOTIVE CARBON FIBER MARKET, 2022-2032 ($MILLION)
- FIGURE 28. MEXICO AUTOMOTIVE CARBON FIBER MARKET, 2022-2032 ($MILLION)
- FIGURE 29. GERMANY AUTOMOTIVE CARBON FIBER MARKET, 2022-2032 ($MILLION)
- FIGURE 30. UK AUTOMOTIVE CARBON FIBER MARKET, 2022-2032 ($MILLION)
- FIGURE 31. FRANCE AUTOMOTIVE CARBON FIBER MARKET, 2022-2032 ($MILLION)
- FIGURE 32. ITALY AUTOMOTIVE CARBON FIBER MARKET, 2022-2032 ($MILLION)
- FIGURE 33. REST OF THE EUROPE AUTOMOTIVE CARBON FIBER MARKET, 2022-2032 ($MILLION)
- FIGURE 34. CHINA AUTOMOTIVE CARBON FIBER MARKET, 2022-2032 ($MILLION)
- FIGURE 35. JAPAN AUTOMOTIVE CARBON FIBER MARKET, 2022-2032 ($MILLION)
- FIGURE 36. INDIA AUTOMOTIVE CARBON FIBER MARKET, 2022-2032 ($MILLION)
- FIGURE 37. SOUTH KOREA AUTOMOTIVE CARBON FIBER MARKET, 2022-2032 ($MILLION)
- FIGURE 38. REST OF ASIA-PACIFIC AUTOMOTIVE CARBON FIBER MARKET, 2022-2032 ($MILLION)
- FIGURE 39. LATIN AMERICA AUTOMOTIVE CARBON FIBER MARKET, 2022-2032 ($MILLION)
- FIGURE 40. MIDDLE-EAST AUTOMOTIVE CARBON FIBER MARKET, 2022-2032 ($MILLION)
- FIGURE 41. AFRICA AUTOMOTIVE CARBON FIBER MARKET, 2022-2032 ($MILLION)
- FIGURE 42. TOP WINNING STRATEGIES, BY YEAR (2020-2023)
- FIGURE 43. TOP WINNING STRATEGIES, BY DEVELOPMENT (2020-2023)
- FIGURE 44. TOP WINNING STRATEGIES, BY COMPANY (2020-2023)
- FIGURE 45. PRODUCT MAPPING OF TOP 10 PLAYERS
- FIGURE 46. COMPETITIVE DASHBOARD
- FIGURE 47. COMPETITIVE HEATMAP: AUTOMOTIVE CARBON FIBER MARKET
- FIGURE 48. TOP PLAYER POSITIONING, 2022
- FIGURE 49. MITSUBISHI CHEMICAL CORPORATION: NET REVENUE, 2020-2022 ($MILLION)
- FIGURE 50. MITSUBISHI CHEMICAL CORPORATION: REVENUE SHARE BY SEGMENT, 2022 (%)
- FIGURE 51. TORAY INDUSTRIES, INC.: NET SALES, 2020-2022 ($MILLION)
- FIGURE 52. TORAY INDUSTRIES, INC.: REVENUE SHARE BY SEGMENT, 2022 (%)
- FIGURE 53. TORAY INDUSTRIES, INC.: REVENUE SHARE BY REGION, 2022 (%)
- FIGURE 54. HEXCEL CORPORATION: NET SALES, 2020-2022 ($MILLION)
- FIGURE 55. HEXCEL CORPORATION: REVENUE SHARE BY SEGMENT, 2022 (%)
- FIGURE 56. HEXCEL CORPORATION: REVENUE SHARE BY REGION, 2022 (%)
- FIGURE 57. SGL CARBON: NET REVENUE, 2020-2022 ($MILLION)
- FIGURE 58. SGL CARBON: RESEARCH & DEVELOPMENT EXPENDITURE, 2020-2022 ($MILLION)
- FIGURE 59. SGL CARBON: REVENUE SHARE BY SEGMENT, 2022 (%)
- FIGURE 60. SGL CARBON: REVENUE SHARE BY REGION, 2022 (%)
- FIGURE 61. TEIJIN LIMITED.: NET SALES, 2020-2022 ($MILLION)
- FIGURE 62. TEIJIN LIMITED.: REVENUE SHARE BY SEGMENT, 2022 (%)
- FIGURE 63. TEIJIN LIMITED.: REVENUE SHARE BY REGION, 2022 (%)
- FIGURE 64. FORMOSA PLASTICS CORPORATION: NET SALES, 2020-2022 ($MILLION)
- FIGURE 65. SOLVAY S.A.: NET SALES, 2020-2022 ($MILLION)
- FIGURE 66. SOLVAY S.A.: REVENUE SHARE BY SEGMENT, 2022 (%)
- FIGURE 67. SOLVAY S.A.: REVENUE SHARE BY REGION, 2022 (%)

