
PUBLISHER: Allied Market Research | PRODUCT CODE: 1415002

PUBLISHER: Allied Market Research | PRODUCT CODE: 1415002
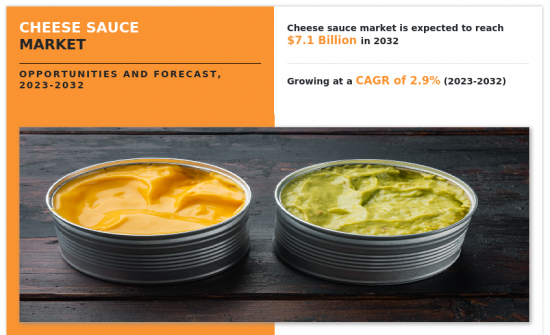
Cheese Sauce Market By Cheese Type, By Source, By End User, By Distribution Channel : Global Opportunity Analysis and Industry Forecast, 2023-2032
According to a new report published by Allied Market Research, titled, "Cheese Sauce Market," The cheese sauce market was valued at $5.4 billion in 2022, and is estimated to reach $7.1 billion by 2032, growing at a CAGR of 2.9% from 2023 to 2032.
The growth of the cheese sauce market is driven by increase in consumption of fast food items, such as pasta, pizza, and burger, in quick-service restaurants (QSRs). Moreover, longer shelf life of cheese sauce products, rise in disposable income, and surge in demand for food products rich in protein content boost the market growth. However, alarming obesity rates coupled with rise in health consciousness among adults, unhealthy additives & ingredients in processed cheese, and perishable nature of cheese products act as major restraints of the market.
The spread of fast-food chains and quick-service restaurants globally is making cheese sauces a popular addition to various menu items. This global trend is boosting the use of cheese sauces, reaching more people in different places. As fast-food places expand globally, they are including cheese sauces in many different dishes, making them more widely available. It not only adds to the variety of food options but also introduces more people to the goodness of cheese sauces.
On the contrary, cheese with low-fat content is gaining significant popularity. This is achieved by manipulation of its rheological & chemical properties. This leads to desirable characteristics and a longer shelf life to cheese products, providing numerous opportunities for market expansion during the forecast period.
Today's consumers, especially millennials and Generation Z, prefer food that is both convenient and nutritious. To obtain the most nutritional benefits for the body, more emphasis is being placed on healthy eating habits and balanced diets. The European Union classifies cheese as a functional food due to the numerous health benefits associated with its consumption. It contains a lot of protein, healthy fats, calcium, vitamin A, B6, and B12 vitamins, as well as phosphorus, zinc, and copper. Cheese is also less lactose and easier to digest.
Lactose intolerance is a clinical disorder in which the body is not able to properly digest lactose, a form of sugar found within milk, resulting in ailments such as stomach cramps, diarrhoea, and gastrointestinal discomfort. Although Parmesan cheese sauce contains little lactose, it can cause discomfort in lactose intolerant individuals. Lactose intolerance is becoming more common worldwide, and it can occur at any age. Market growth is being hampered as a result of this. Furthermore, parmesan cheese is high in sodium. Five grams of parmesan cheese contain 76mg of sodium, making the cheese's sodium concentration very high. Because of its high sodium content, many consumers are avoiding parmesan cheese.
Cheese sauce has grown in popularity in recent years. However, the global vegan population has grown dramatically. According to a report by Grubhub, a leading prepared food delivery service in the U.S., orders for plant-based food and beverages increased by 17%. Many market participants, including a few new entrants, are including plant-based cheese made from cashews, soy, coconut, and almonds in their product offerings.
The cheese sauce market is segmented on the basis of type, source, end user, distribution channel and region. By type, the market is divided into cheddar, mozzarella, parmesan, american cheese, blue cheese, provolone, gouda, montero jack, and others. By source, the market is divided into organic and conventional. By end user, the market is divided into households, restaurants, cafes, hotels, corporate canteen, fast food joints, and others. By distribution channel, the market is segmented into convenience stores, hypermarkets/supermarkets, specialty stores, direct, online channels, and others. Region-wise, the market is analysed across North America (the U.S., Canada, and Mexico), Europe (the UK, Germany, France, Russia, Italy, Spain, and the rest of Europe), Asia-Pacific (China, Japan, India, South Korea, Australia, South Korea, Indonesia, and the rest of Asia-Pacific), and LAMEA (Brazil, Argentina, UAE, South Africa, Saudi Arabia, and the rest of LAMEA).
The major players operating in the market focus on key market strategies, such as mergers, product launches, acquisitions, collaborations, and partnerships. They have been also focusing on strengthening their market reach to maintain their reputation in the ever-competitive market. Some of the key players in the cheese sauce market include Nestle S.A., Campbell Soup Company, Conagra Brands, Inc., The Kraft Heinz Company, Kerry Group plc., Unilever Plc., TreeHouse Foods, Inc., Gehl Foods, LLC., AFP Advanced Food Products, LLC., and Tatua.
Key Benefits For Stakeholders
- This report provides a quantitative analysis of the market segments, current trends, estimations, and dynamics of the cheese sauce market analysis from 2022 to 2032 to identify the prevailing cheese sauce market opportunities.
- The market research is offered along with information related to key drivers, restraints, and opportunities.
- Porter's five forces analysis highlights the potency of buyers and suppliers to enable stakeholders make profit-oriented business decisions and strengthen their supplier-buyer network.
- In-depth analysis of the cheese sauce market segmentation assists to determine the prevailing market opportunities.
- Major countries in each region are mapped according to their revenue contribution to the global market.
- Market player positioning facilitates benchmarking and provides a clear understanding of the present position of the market players.
- The report includes the analysis of the regional as well as global cheese sauce market trends, key players, market segments, application areas, and market growth strategies.
Additional benefits you will get with this purchase are:
- Quarterly Update and* (only available with a corporate license, on listed price)
- 5 additional Company Profile of client Choice pre- or Post-purchase, as a free update.
- Free Upcoming Version on the Purchase of Five and Enterprise User License.
- 16 analyst hours of support* (post-purchase, if you find additional data requirements upon review of the report, you may receive support amounting to 16 analyst hours to solve questions, and post-sale queries)
- 15% Free Customization* (in case the scope or segment of the report does not match your requirements, 15% is equivalent to 3 working days of free work, applicable once)
- Free data Pack on the Five and Enterprise User License. (Excel version of the report)
- Free Updated report if the report is 6-12 months old or older.
- 24-hour priority response*
- Free Industry updates and white papers.
Possible Customization with this report (with additional cost and timeline, please talk to the sales executive to know more)
- Senario Analysis & Growth Trend Comparision
- Supply Chain Analysis & Vendor Margins
- Pain Point Analysis
- Additional company profiles with specific to client's interest
- Additional country or region analysis- market size and forecast
- Average Selling Price Analysis / Price Point Analysis
- Expanded list for Company Profiles
- Historic market data
Key Market Segments
By Cheese Type
- Cheddar
- Mozzarella
- Parmesan
- American Cheese
- Blue Cheese
- Provolone
- Gouda
- Montero Jack
- Others
By Source
- Organic
- Conventional
By End User
- Households
- Restaurants
- Cafes
- Hotels
- Corporate Canteen
- Fast Food Joints
- Others
By Distribution Channel
- Convenience Stores
- Hypermarkets/Supermarkets
- Specialty Stores
- Direct
- Online Channels
- Others
By Region
- North America
- U.S.
- Canada
- Mexico
- Europe
- Germany
- France
- UK
- Italy
- Spain
- Russia
- Rest of Europe
- Asia-Pacific
- China
- Japan
- India
- Australia
- South Korea
- Indonesia
- Rest of Asia-Pacific
- LAMEA
- Brazil
- Argentina
- UAE
- South Africa
- Saudi Arabia
- Rest of LAMEA
Key Market Players:
- Campbell Soup Company
- Conagra Brands, Inc.
- Kerry Group plc.
- Unilever Plc.
- Gehl Foods, LLC.
- AFP Advanced Food Products, LLC.
- Tatua
- Nestle S.A.
- The Kraft Heinz Company
- TreeHouse Foods, Inc.
TABLE OF CONTENTS
CHAPTER 1: INTRODUCTION
- 1.1. Report description
- 1.2. Key market segments
- 1.3. Key benefits to the stakeholders
- 1.4. Research methodology
- 1.4.1. Primary research
- 1.4.2. Secondary research
- 1.4.3. Analyst tools and models
CHAPTER 2: EXECUTIVE SUMMARY
- 2.1. CXO Perspective
CHAPTER 3: MARKET OVERVIEW
- 3.1. Market definition and scope
- 3.2. Key findings
- 3.2.1. Top impacting factors
- 3.2.2. Top investment pockets
- 3.3. Porter's five forces analysis
- 3.3.1. Moderate bargaining power of suppliers
- 3.3.2. Low threat of new entrants
- 3.3.3. Moderate threat of substitutes
- 3.3.4. Moderate intensity of rivalry
- 3.3.5. Moderate bargaining power of buyers
- 3.4. Market dynamics
- 3.4.1. Drivers
- 3.4.1.1. Growing Demand for Convenience Foods
- 3.4.1.2. Maximise in-home consumption
- 3.4.1.3. Expanding Fast Food and QSR Industry
- 3.4.2. Restraints
- 3.4.2.1. Fluctuating Cheese Prices $Serious health risks associated with heavy cheese intake
- 3.4.3. Opportunities
- 3.4.3.1. Demand for Convenience and Ready-to-Use Products
- 3.4.1. Drivers
CHAPTER 4: CHEESE SAUCE MARKET, BY CHEESE TYPE
- 4.1. Overview
- 4.1.1. Market size and forecast
- 4.2. Cheddar
- 4.2.1. Key market trends, growth factors and opportunities
- 4.2.2. Market size and forecast, by region
- 4.2.3. Market share analysis by country
- 4.3. Mozzarella
- 4.3.1. Key market trends, growth factors and opportunities
- 4.3.2. Market size and forecast, by region
- 4.3.3. Market share analysis by country
- 4.4. Parmesan
- 4.4.1. Key market trends, growth factors and opportunities
- 4.4.2. Market size and forecast, by region
- 4.4.3. Market share analysis by country
- 4.5. American Cheese
- 4.5.1. Key market trends, growth factors and opportunities
- 4.5.2. Market size and forecast, by region
- 4.5.3. Market share analysis by country
- 4.6. Blue Cheese
- 4.6.1. Key market trends, growth factors and opportunities
- 4.6.2. Market size and forecast, by region
- 4.6.3. Market share analysis by country
- 4.7. Provolone
- 4.7.1. Key market trends, growth factors and opportunities
- 4.7.2. Market size and forecast, by region
- 4.7.3. Market share analysis by country
- 4.8. Gouda
- 4.8.1. Key market trends, growth factors and opportunities
- 4.8.2. Market size and forecast, by region
- 4.8.3. Market share analysis by country
- 4.9. Montero Jack
- 4.9.1. Key market trends, growth factors and opportunities
- 4.9.2. Market size and forecast, by region
- 4.9.3. Market share analysis by country
- 4.10. Others
- 4.10.1. Key market trends, growth factors and opportunities
- 4.10.2. Market size and forecast, by region
- 4.10.3. Market share analysis by country
CHAPTER 5: CHEESE SAUCE MARKET, BY SOURCE
- 5.1. Overview
- 5.1.1. Market size and forecast
- 5.2. Organic
- 5.2.1. Key market trends, growth factors and opportunities
- 5.2.2. Market size and forecast, by region
- 5.2.3. Market share analysis by country
- 5.3. Conventional
- 5.3.1. Key market trends, growth factors and opportunities
- 5.3.2. Market size and forecast, by region
- 5.3.3. Market share analysis by country
CHAPTER 6: CHEESE SAUCE MARKET, BY END USER
- 6.1. Overview
- 6.1.1. Market size and forecast
- 6.2. Households
- 6.2.1. Key market trends, growth factors and opportunities
- 6.2.2. Market size and forecast, by region
- 6.2.3. Market share analysis by country
- 6.3. Restaurants
- 6.3.1. Key market trends, growth factors and opportunities
- 6.3.2. Market size and forecast, by region
- 6.3.3. Market share analysis by country
- 6.4. Cafes
- 6.4.1. Key market trends, growth factors and opportunities
- 6.4.2. Market size and forecast, by region
- 6.4.3. Market share analysis by country
- 6.5. Hotels
- 6.5.1. Key market trends, growth factors and opportunities
- 6.5.2. Market size and forecast, by region
- 6.5.3. Market share analysis by country
- 6.6. Corporate Canteen
- 6.6.1. Key market trends, growth factors and opportunities
- 6.6.2. Market size and forecast, by region
- 6.6.3. Market share analysis by country
- 6.7. Fast Food Joints
- 6.7.1. Key market trends, growth factors and opportunities
- 6.7.2. Market size and forecast, by region
- 6.7.3. Market share analysis by country
- 6.8. Others
- 6.8.1. Key market trends, growth factors and opportunities
- 6.8.2. Market size and forecast, by region
- 6.8.3. Market share analysis by country
CHAPTER 7: CHEESE SAUCE MARKET, BY DISTRIBUTION CHANNEL
- 7.1. Overview
- 7.1.1. Market size and forecast
- 7.2. Convenience Stores
- 7.2.1. Key market trends, growth factors and opportunities
- 7.2.2. Market size and forecast, by region
- 7.2.3. Market share analysis by country
- 7.3. Hypermarkets/Supermarkets
- 7.3.1. Key market trends, growth factors and opportunities
- 7.3.2. Market size and forecast, by region
- 7.3.3. Market share analysis by country
- 7.4. Specialty Stores
- 7.4.1. Key market trends, growth factors and opportunities
- 7.4.2. Market size and forecast, by region
- 7.4.3. Market share analysis by country
- 7.5. Direct
- 7.5.1. Key market trends, growth factors and opportunities
- 7.5.2. Market size and forecast, by region
- 7.5.3. Market share analysis by country
- 7.6. Online Channels
- 7.6.1. Key market trends, growth factors and opportunities
- 7.6.2. Market size and forecast, by region
- 7.6.3. Market share analysis by country
- 7.7. Others
- 7.7.1. Key market trends, growth factors and opportunities
- 7.7.2. Market size and forecast, by region
- 7.7.3. Market share analysis by country
CHAPTER 8: CHEESE SAUCE MARKET, BY REGION
- 8.1. Overview
- 8.1.1. Market size and forecast By Region
- 8.2. North America
- 8.2.1. Key market trends, growth factors and opportunities
- 8.2.2. Market size and forecast, by Cheese Type
- 8.2.3. Market size and forecast, by Source
- 8.2.4. Market size and forecast, by End User
- 8.2.5. Market size and forecast, by Distribution Channel
- 8.2.6. Market size and forecast, by country
- 8.2.6.1. U.S.
- 8.2.6.1.1. Market size and forecast, by Cheese Type
- 8.2.6.1.2. Market size and forecast, by Source
- 8.2.6.1.3. Market size and forecast, by End User
- 8.2.6.1.4. Market size and forecast, by Distribution Channel
- 8.2.6.2. Canada
- 8.2.6.2.1. Market size and forecast, by Cheese Type
- 8.2.6.2.2. Market size and forecast, by Source
- 8.2.6.2.3. Market size and forecast, by End User
- 8.2.6.2.4. Market size and forecast, by Distribution Channel
- 8.2.6.3. Mexico
- 8.2.6.3.1. Market size and forecast, by Cheese Type
- 8.2.6.3.2. Market size and forecast, by Source
- 8.2.6.3.3. Market size and forecast, by End User
- 8.2.6.3.4. Market size and forecast, by Distribution Channel
- 8.3. Europe
- 8.3.1. Key market trends, growth factors and opportunities
- 8.3.2. Market size and forecast, by Cheese Type
- 8.3.3. Market size and forecast, by Source
- 8.3.4. Market size and forecast, by End User
- 8.3.5. Market size and forecast, by Distribution Channel
- 8.3.6. Market size and forecast, by country
- 8.3.6.1. Germany
- 8.3.6.1.1. Market size and forecast, by Cheese Type
- 8.3.6.1.2. Market size and forecast, by Source
- 8.3.6.1.3. Market size and forecast, by End User
- 8.3.6.1.4. Market size and forecast, by Distribution Channel
- 8.3.6.2. France
- 8.3.6.2.1. Market size and forecast, by Cheese Type
- 8.3.6.2.2. Market size and forecast, by Source
- 8.3.6.2.3. Market size and forecast, by End User
- 8.3.6.2.4. Market size and forecast, by Distribution Channel
- 8.3.6.3. UK
- 8.3.6.3.1. Market size and forecast, by Cheese Type
- 8.3.6.3.2. Market size and forecast, by Source
- 8.3.6.3.3. Market size and forecast, by End User
- 8.3.6.3.4. Market size and forecast, by Distribution Channel
- 8.3.6.4. Italy
- 8.3.6.4.1. Market size and forecast, by Cheese Type
- 8.3.6.4.2. Market size and forecast, by Source
- 8.3.6.4.3. Market size and forecast, by End User
- 8.3.6.4.4. Market size and forecast, by Distribution Channel
- 8.3.6.5. Spain
- 8.3.6.5.1. Market size and forecast, by Cheese Type
- 8.3.6.5.2. Market size and forecast, by Source
- 8.3.6.5.3. Market size and forecast, by End User
- 8.3.6.5.4. Market size and forecast, by Distribution Channel
- 8.3.6.6. Russia
- 8.3.6.6.1. Market size and forecast, by Cheese Type
- 8.3.6.6.2. Market size and forecast, by Source
- 8.3.6.6.3. Market size and forecast, by End User
- 8.3.6.6.4. Market size and forecast, by Distribution Channel
- 8.3.6.7. Rest of Europe
- 8.3.6.7.1. Market size and forecast, by Cheese Type
- 8.3.6.7.2. Market size and forecast, by Source
- 8.3.6.7.3. Market size and forecast, by End User
- 8.3.6.7.4. Market size and forecast, by Distribution Channel
- 8.4. Asia-Pacific
- 8.4.1. Key market trends, growth factors and opportunities
- 8.4.2. Market size and forecast, by Cheese Type
- 8.4.3. Market size and forecast, by Source
- 8.4.4. Market size and forecast, by End User
- 8.4.5. Market size and forecast, by Distribution Channel
- 8.4.6. Market size and forecast, by country
- 8.4.6.1. China
- 8.4.6.1.1. Market size and forecast, by Cheese Type
- 8.4.6.1.2. Market size and forecast, by Source
- 8.4.6.1.3. Market size and forecast, by End User
- 8.4.6.1.4. Market size and forecast, by Distribution Channel
- 8.4.6.2. Japan
- 8.4.6.2.1. Market size and forecast, by Cheese Type
- 8.4.6.2.2. Market size and forecast, by Source
- 8.4.6.2.3. Market size and forecast, by End User
- 8.4.6.2.4. Market size and forecast, by Distribution Channel
- 8.4.6.3. India
- 8.4.6.3.1. Market size and forecast, by Cheese Type
- 8.4.6.3.2. Market size and forecast, by Source
- 8.4.6.3.3. Market size and forecast, by End User
- 8.4.6.3.4. Market size and forecast, by Distribution Channel
- 8.4.6.4. Australia
- 8.4.6.4.1. Market size and forecast, by Cheese Type
- 8.4.6.4.2. Market size and forecast, by Source
- 8.4.6.4.3. Market size and forecast, by End User
- 8.4.6.4.4. Market size and forecast, by Distribution Channel
- 8.4.6.5. South Korea
- 8.4.6.5.1. Market size and forecast, by Cheese Type
- 8.4.6.5.2. Market size and forecast, by Source
- 8.4.6.5.3. Market size and forecast, by End User
- 8.4.6.5.4. Market size and forecast, by Distribution Channel
- 8.4.6.6. Indonesia
- 8.4.6.6.1. Market size and forecast, by Cheese Type
- 8.4.6.6.2. Market size and forecast, by Source
- 8.4.6.6.3. Market size and forecast, by End User
- 8.4.6.6.4. Market size and forecast, by Distribution Channel
- 8.4.6.7. Rest of Asia-Pacific
- 8.4.6.7.1. Market size and forecast, by Cheese Type
- 8.4.6.7.2. Market size and forecast, by Source
- 8.4.6.7.3. Market size and forecast, by End User
- 8.4.6.7.4. Market size and forecast, by Distribution Channel
- 8.5. LAMEA
- 8.5.1. Key market trends, growth factors and opportunities
- 8.5.2. Market size and forecast, by Cheese Type
- 8.5.3. Market size and forecast, by Source
- 8.5.4. Market size and forecast, by End User
- 8.5.5. Market size and forecast, by Distribution Channel
- 8.5.6. Market size and forecast, by country
- 8.5.6.1. Brazil
- 8.5.6.1.1. Market size and forecast, by Cheese Type
- 8.5.6.1.2. Market size and forecast, by Source
- 8.5.6.1.3. Market size and forecast, by End User
- 8.5.6.1.4. Market size and forecast, by Distribution Channel
- 8.5.6.2. Argentina
- 8.5.6.2.1. Market size and forecast, by Cheese Type
- 8.5.6.2.2. Market size and forecast, by Source
- 8.5.6.2.3. Market size and forecast, by End User
- 8.5.6.2.4. Market size and forecast, by Distribution Channel
- 8.5.6.3. UAE
- 8.5.6.3.1. Market size and forecast, by Cheese Type
- 8.5.6.3.2. Market size and forecast, by Source
- 8.5.6.3.3. Market size and forecast, by End User
- 8.5.6.3.4. Market size and forecast, by Distribution Channel
- 8.5.6.4. South Africa
- 8.5.6.4.1. Market size and forecast, by Cheese Type
- 8.5.6.4.2. Market size and forecast, by Source
- 8.5.6.4.3. Market size and forecast, by End User
- 8.5.6.4.4. Market size and forecast, by Distribution Channel
- 8.5.6.5. Saudi Arabia
- 8.5.6.5.1. Market size and forecast, by Cheese Type
- 8.5.6.5.2. Market size and forecast, by Source
- 8.5.6.5.3. Market size and forecast, by End User
- 8.5.6.5.4. Market size and forecast, by Distribution Channel
- 8.5.6.6. Rest of LAMEA
- 8.5.6.6.1. Market size and forecast, by Cheese Type
- 8.5.6.6.2. Market size and forecast, by Source
- 8.5.6.6.3. Market size and forecast, by End User
- 8.5.6.6.4. Market size and forecast, by Distribution Channel
CHAPTER 9: COMPETITIVE LANDSCAPE
- 9.1. Introduction
- 9.2. Top winning strategies
- 9.3. Product mapping of top 10 player
- 9.4. Competitive dashboard
- 9.5. Competitive heatmap
- 9.6. Top player positioning, 2022
CHAPTER 10: COMPANY PROFILES
- 10.1. Nestle S.A.
- 10.1.1. Company overview
- 10.1.2. Key executives
- 10.1.3. Company snapshot
- 10.1.4. Operating business segments
- 10.1.5. Product portfolio
- 10.1.6. Business performance
- 10.2. Unilever Plc.
- 10.2.1. Company overview
- 10.2.2. Key executives
- 10.2.3. Company snapshot
- 10.2.4. Operating business segments
- 10.2.5. Product portfolio
- 10.2.6. Business performance
- 10.3. Campbell Soup Company
- 10.3.1. Company overview
- 10.3.2. Key executives
- 10.3.3. Company snapshot
- 10.3.4. Operating business segments
- 10.3.5. Product portfolio
- 10.3.6. Business performance
- 10.4. TreeHouse Foods, Inc.
- 10.4.1. Company overview
- 10.4.2. Key executives
- 10.4.3. Company snapshot
- 10.4.4. Operating business segments
- 10.4.5. Product portfolio
- 10.4.6. Business performance
- 10.5. Conagra Brands, Inc.
- 10.5.1. Company overview
- 10.5.2. Key executives
- 10.5.3. Company snapshot
- 10.5.4. Operating business segments
- 10.5.5. Product portfolio
- 10.5.6. Business performance
- 10.6. The Kraft Heinz Company
- 10.6.1. Company overview
- 10.6.2. Key executives
- 10.6.3. Company snapshot
- 10.6.4. Operating business segments
- 10.6.5. Product portfolio
- 10.6.6. Business performance
- 10.6.7. Key strategic moves and developments
- 10.7. Kerry Group plc.
- 10.7.1. Company overview
- 10.7.2. Key executives
- 10.7.3. Company snapshot
- 10.7.4. Operating business segments
- 10.7.5. Product portfolio
- 10.7.6. Business performance
- 10.8. Gehl Foods, LLC.
- 10.8.1. Company overview
- 10.8.2. Key executives
- 10.8.3. Company snapshot
- 10.8.4. Operating business segments
- 10.8.5. Product portfolio
- 10.8.6. Key strategic moves and developments
- 10.9. AFP Advanced Food Products, LLC.
- 10.9.1. Company overview
- 10.9.2. Key executives
- 10.9.3. Company snapshot
- 10.9.4. Operating business segments
- 10.9.5. Product portfolio
- 10.9.6. Key strategic moves and developments
- 10.10. Tatua
- 10.10.1. Company overview
- 10.10.2. Key executives
- 10.10.3. Company snapshot
- 10.10.4. Operating business segments
- 10.10.5. Product portfolio
- 10.10.6. Business performance
LIST OF TABLES
- TABLE 01. GLOBAL CHEESE SAUCE MARKET, BY CHEESE TYPE, 2022-2032 ($MILLION)
- TABLE 02. CHEESE SAUCE MARKET FOR CHEDDAR, BY REGION, 2022-2032 ($MILLION)
- TABLE 03. CHEESE SAUCE MARKET FOR MOZZARELLA, BY REGION, 2022-2032 ($MILLION)
- TABLE 04. CHEESE SAUCE MARKET FOR PARMESAN, BY REGION, 2022-2032 ($MILLION)
- TABLE 05. CHEESE SAUCE MARKET FOR AMERICAN CHEESE, BY REGION, 2022-2032 ($MILLION)
- TABLE 06. CHEESE SAUCE MARKET FOR BLUE CHEESE, BY REGION, 2022-2032 ($MILLION)
- TABLE 07. CHEESE SAUCE MARKET FOR PROVOLONE, BY REGION, 2022-2032 ($MILLION)
- TABLE 08. CHEESE SAUCE MARKET FOR GOUDA, BY REGION, 2022-2032 ($MILLION)
- TABLE 09. CHEESE SAUCE MARKET FOR MONTERO JACK, BY REGION, 2022-2032 ($MILLION)
- TABLE 10. CHEESE SAUCE MARKET FOR OTHERS, BY REGION, 2022-2032 ($MILLION)
- TABLE 11. GLOBAL CHEESE SAUCE MARKET, BY SOURCE, 2022-2032 ($MILLION)
- TABLE 12. CHEESE SAUCE MARKET FOR ORGANIC, BY REGION, 2022-2032 ($MILLION)
- TABLE 13. CHEESE SAUCE MARKET FOR CONVENTIONAL, BY REGION, 2022-2032 ($MILLION)
- TABLE 14. GLOBAL CHEESE SAUCE MARKET, BY END USER, 2022-2032 ($MILLION)
- TABLE 15. CHEESE SAUCE MARKET FOR HOUSEHOLDS, BY REGION, 2022-2032 ($MILLION)
- TABLE 16. CHEESE SAUCE MARKET FOR RESTAURANTS, BY REGION, 2022-2032 ($MILLION)
- TABLE 17. CHEESE SAUCE MARKET FOR CAFES, BY REGION, 2022-2032 ($MILLION)
- TABLE 18. CHEESE SAUCE MARKET FOR HOTELS, BY REGION, 2022-2032 ($MILLION)
- TABLE 19. CHEESE SAUCE MARKET FOR CORPORATE CANTEEN, BY REGION, 2022-2032 ($MILLION)
- TABLE 20. CHEESE SAUCE MARKET FOR FAST FOOD JOINTS, BY REGION, 2022-2032 ($MILLION)
- TABLE 21. CHEESE SAUCE MARKET FOR OTHERS, BY REGION, 2022-2032 ($MILLION)
- TABLE 22. GLOBAL CHEESE SAUCE MARKET, BY DISTRIBUTION CHANNEL, 2022-2032 ($MILLION)
- TABLE 23. CHEESE SAUCE MARKET FOR CONVENIENCE STORES, BY REGION, 2022-2032 ($MILLION)
- TABLE 24. CHEESE SAUCE MARKET FOR HYPERMARKETS/SUPERMARKETS, BY REGION, 2022-2032 ($MILLION)
- TABLE 25. CHEESE SAUCE MARKET FOR SPECIALTY STORES, BY REGION, 2022-2032 ($MILLION)
- TABLE 26. CHEESE SAUCE MARKET FOR DIRECT, BY REGION, 2022-2032 ($MILLION)
- TABLE 27. CHEESE SAUCE MARKET FOR ONLINE CHANNELS, BY REGION, 2022-2032 ($MILLION)
- TABLE 28. CHEESE SAUCE MARKET FOR OTHERS, BY REGION, 2022-2032 ($MILLION)
- TABLE 29. CHEESE SAUCE MARKET, BY REGION, 2022-2032 ($MILLION)
- TABLE 30. NORTH AMERICA CHEESE SAUCE MARKET, BY CHEESE TYPE, 2022-2032 ($MILLION)
- TABLE 31. NORTH AMERICA CHEESE SAUCE MARKET, BY SOURCE, 2022-2032 ($MILLION)
- TABLE 32. NORTH AMERICA CHEESE SAUCE MARKET, BY END USER, 2022-2032 ($MILLION)
- TABLE 33. NORTH AMERICA CHEESE SAUCE MARKET, BY DISTRIBUTION CHANNEL, 2022-2032 ($MILLION)
- TABLE 34. NORTH AMERICA CHEESE SAUCE MARKET, BY COUNTRY, 2022-2032 ($MILLION)
- TABLE 35. U.S. CHEESE SAUCE MARKET, BY CHEESE TYPE, 2022-2032 ($MILLION)
- TABLE 36. U.S. CHEESE SAUCE MARKET, BY SOURCE, 2022-2032 ($MILLION)
- TABLE 37. U.S. CHEESE SAUCE MARKET, BY END USER, 2022-2032 ($MILLION)
- TABLE 38. U.S. CHEESE SAUCE MARKET, BY DISTRIBUTION CHANNEL, 2022-2032 ($MILLION)
- TABLE 39. CANADA CHEESE SAUCE MARKET, BY CHEESE TYPE, 2022-2032 ($MILLION)
- TABLE 40. CANADA CHEESE SAUCE MARKET, BY SOURCE, 2022-2032 ($MILLION)
- TABLE 41. CANADA CHEESE SAUCE MARKET, BY END USER, 2022-2032 ($MILLION)
- TABLE 42. CANADA CHEESE SAUCE MARKET, BY DISTRIBUTION CHANNEL, 2022-2032 ($MILLION)
- TABLE 43. MEXICO CHEESE SAUCE MARKET, BY CHEESE TYPE, 2022-2032 ($MILLION)
- TABLE 44. MEXICO CHEESE SAUCE MARKET, BY SOURCE, 2022-2032 ($MILLION)
- TABLE 45. MEXICO CHEESE SAUCE MARKET, BY END USER, 2022-2032 ($MILLION)
- TABLE 46. MEXICO CHEESE SAUCE MARKET, BY DISTRIBUTION CHANNEL, 2022-2032 ($MILLION)
- TABLE 47. EUROPE CHEESE SAUCE MARKET, BY CHEESE TYPE, 2022-2032 ($MILLION)
- TABLE 48. EUROPE CHEESE SAUCE MARKET, BY SOURCE, 2022-2032 ($MILLION)
- TABLE 49. EUROPE CHEESE SAUCE MARKET, BY END USER, 2022-2032 ($MILLION)
- TABLE 50. EUROPE CHEESE SAUCE MARKET, BY DISTRIBUTION CHANNEL, 2022-2032 ($MILLION)
- TABLE 51. EUROPE CHEESE SAUCE MARKET, BY COUNTRY, 2022-2032 ($MILLION)
- TABLE 52. GERMANY CHEESE SAUCE MARKET, BY CHEESE TYPE, 2022-2032 ($MILLION)
- TABLE 53. GERMANY CHEESE SAUCE MARKET, BY SOURCE, 2022-2032 ($MILLION)
- TABLE 54. GERMANY CHEESE SAUCE MARKET, BY END USER, 2022-2032 ($MILLION)
- TABLE 55. GERMANY CHEESE SAUCE MARKET, BY DISTRIBUTION CHANNEL, 2022-2032 ($MILLION)
- TABLE 56. FRANCE CHEESE SAUCE MARKET, BY CHEESE TYPE, 2022-2032 ($MILLION)
- TABLE 57. FRANCE CHEESE SAUCE MARKET, BY SOURCE, 2022-2032 ($MILLION)
- TABLE 58. FRANCE CHEESE SAUCE MARKET, BY END USER, 2022-2032 ($MILLION)
- TABLE 59. FRANCE CHEESE SAUCE MARKET, BY DISTRIBUTION CHANNEL, 2022-2032 ($MILLION)
- TABLE 60. UK CHEESE SAUCE MARKET, BY CHEESE TYPE, 2022-2032 ($MILLION)
- TABLE 61. UK CHEESE SAUCE MARKET, BY SOURCE, 2022-2032 ($MILLION)
- TABLE 62. UK CHEESE SAUCE MARKET, BY END USER, 2022-2032 ($MILLION)
- TABLE 63. UK CHEESE SAUCE MARKET, BY DISTRIBUTION CHANNEL, 2022-2032 ($MILLION)
- TABLE 64. ITALY CHEESE SAUCE MARKET, BY CHEESE TYPE, 2022-2032 ($MILLION)
- TABLE 65. ITALY CHEESE SAUCE MARKET, BY SOURCE, 2022-2032 ($MILLION)
- TABLE 66. ITALY CHEESE SAUCE MARKET, BY END USER, 2022-2032 ($MILLION)
- TABLE 67. ITALY CHEESE SAUCE MARKET, BY DISTRIBUTION CHANNEL, 2022-2032 ($MILLION)
- TABLE 68. SPAIN CHEESE SAUCE MARKET, BY CHEESE TYPE, 2022-2032 ($MILLION)
- TABLE 69. SPAIN CHEESE SAUCE MARKET, BY SOURCE, 2022-2032 ($MILLION)
- TABLE 70. SPAIN CHEESE SAUCE MARKET, BY END USER, 2022-2032 ($MILLION)
- TABLE 71. SPAIN CHEESE SAUCE MARKET, BY DISTRIBUTION CHANNEL, 2022-2032 ($MILLION)
- TABLE 72. RUSSIA CHEESE SAUCE MARKET, BY CHEESE TYPE, 2022-2032 ($MILLION)
- TABLE 73. RUSSIA CHEESE SAUCE MARKET, BY SOURCE, 2022-2032 ($MILLION)
- TABLE 74. RUSSIA CHEESE SAUCE MARKET, BY END USER, 2022-2032 ($MILLION)
- TABLE 75. RUSSIA CHEESE SAUCE MARKET, BY DISTRIBUTION CHANNEL, 2022-2032 ($MILLION)
- TABLE 76. REST OF EUROPE CHEESE SAUCE MARKET, BY CHEESE TYPE, 2022-2032 ($MILLION)
- TABLE 77. REST OF EUROPE CHEESE SAUCE MARKET, BY SOURCE, 2022-2032 ($MILLION)
- TABLE 78. REST OF EUROPE CHEESE SAUCE MARKET, BY END USER, 2022-2032 ($MILLION)
- TABLE 79. REST OF EUROPE CHEESE SAUCE MARKET, BY DISTRIBUTION CHANNEL, 2022-2032 ($MILLION)
- TABLE 80. ASIA-PACIFIC CHEESE SAUCE MARKET, BY CHEESE TYPE, 2022-2032 ($MILLION)
- TABLE 81. ASIA-PACIFIC CHEESE SAUCE MARKET, BY SOURCE, 2022-2032 ($MILLION)
- TABLE 82. ASIA-PACIFIC CHEESE SAUCE MARKET, BY END USER, 2022-2032 ($MILLION)
- TABLE 83. ASIA-PACIFIC CHEESE SAUCE MARKET, BY DISTRIBUTION CHANNEL, 2022-2032 ($MILLION)
- TABLE 84. ASIA-PACIFIC CHEESE SAUCE MARKET, BY COUNTRY, 2022-2032 ($MILLION)
- TABLE 85. CHINA CHEESE SAUCE MARKET, BY CHEESE TYPE, 2022-2032 ($MILLION)
- TABLE 86. CHINA CHEESE SAUCE MARKET, BY SOURCE, 2022-2032 ($MILLION)
- TABLE 87. CHINA CHEESE SAUCE MARKET, BY END USER, 2022-2032 ($MILLION)
- TABLE 88. CHINA CHEESE SAUCE MARKET, BY DISTRIBUTION CHANNEL, 2022-2032 ($MILLION)
- TABLE 89. JAPAN CHEESE SAUCE MARKET, BY CHEESE TYPE, 2022-2032 ($MILLION)
- TABLE 90. JAPAN CHEESE SAUCE MARKET, BY SOURCE, 2022-2032 ($MILLION)
- TABLE 91. JAPAN CHEESE SAUCE MARKET, BY END USER, 2022-2032 ($MILLION)
- TABLE 92. JAPAN CHEESE SAUCE MARKET, BY DISTRIBUTION CHANNEL, 2022-2032 ($MILLION)
- TABLE 93. INDIA CHEESE SAUCE MARKET, BY CHEESE TYPE, 2022-2032 ($MILLION)
- TABLE 94. INDIA CHEESE SAUCE MARKET, BY SOURCE, 2022-2032 ($MILLION)
- TABLE 95. INDIA CHEESE SAUCE MARKET, BY END USER, 2022-2032 ($MILLION)
- TABLE 96. INDIA CHEESE SAUCE MARKET, BY DISTRIBUTION CHANNEL, 2022-2032 ($MILLION)
- TABLE 97. AUSTRALIA CHEESE SAUCE MARKET, BY CHEESE TYPE, 2022-2032 ($MILLION)
- TABLE 98. AUSTRALIA CHEESE SAUCE MARKET, BY SOURCE, 2022-2032 ($MILLION)
- TABLE 99. AUSTRALIA CHEESE SAUCE MARKET, BY END USER, 2022-2032 ($MILLION)
- TABLE 100. AUSTRALIA CHEESE SAUCE MARKET, BY DISTRIBUTION CHANNEL, 2022-2032 ($MILLION)
- TABLE 101. SOUTH KOREA CHEESE SAUCE MARKET, BY CHEESE TYPE, 2022-2032 ($MILLION)
- TABLE 102. SOUTH KOREA CHEESE SAUCE MARKET, BY SOURCE, 2022-2032 ($MILLION)
- TABLE 103. SOUTH KOREA CHEESE SAUCE MARKET, BY END USER, 2022-2032 ($MILLION)
- TABLE 104. SOUTH KOREA CHEESE SAUCE MARKET, BY DISTRIBUTION CHANNEL, 2022-2032 ($MILLION)
- TABLE 105. INDONESIA CHEESE SAUCE MARKET, BY CHEESE TYPE, 2022-2032 ($MILLION)
- TABLE 106. INDONESIA CHEESE SAUCE MARKET, BY SOURCE, 2022-2032 ($MILLION)
- TABLE 107. INDONESIA CHEESE SAUCE MARKET, BY END USER, 2022-2032 ($MILLION)
- TABLE 108. INDONESIA CHEESE SAUCE MARKET, BY DISTRIBUTION CHANNEL, 2022-2032 ($MILLION)
- TABLE 109. REST OF ASIA-PACIFIC CHEESE SAUCE MARKET, BY CHEESE TYPE, 2022-2032 ($MILLION)
- TABLE 110. REST OF ASIA-PACIFIC CHEESE SAUCE MARKET, BY SOURCE, 2022-2032 ($MILLION)
- TABLE 111. REST OF ASIA-PACIFIC CHEESE SAUCE MARKET, BY END USER, 2022-2032 ($MILLION)
- TABLE 112. REST OF ASIA-PACIFIC CHEESE SAUCE MARKET, BY DISTRIBUTION CHANNEL, 2022-2032 ($MILLION)
- TABLE 113. LAMEA CHEESE SAUCE MARKET, BY CHEESE TYPE, 2022-2032 ($MILLION)
- TABLE 114. LAMEA CHEESE SAUCE MARKET, BY SOURCE, 2022-2032 ($MILLION)
- TABLE 115. LAMEA CHEESE SAUCE MARKET, BY END USER, 2022-2032 ($MILLION)
- TABLE 116. LAMEA CHEESE SAUCE MARKET, BY DISTRIBUTION CHANNEL, 2022-2032 ($MILLION)
- TABLE 117. LAMEA CHEESE SAUCE MARKET, BY COUNTRY, 2022-2032 ($MILLION)
- TABLE 118. BRAZIL CHEESE SAUCE MARKET, BY CHEESE TYPE, 2022-2032 ($MILLION)
- TABLE 119. BRAZIL CHEESE SAUCE MARKET, BY SOURCE, 2022-2032 ($MILLION)
- TABLE 120. BRAZIL CHEESE SAUCE MARKET, BY END USER, 2022-2032 ($MILLION)
- TABLE 121. BRAZIL CHEESE SAUCE MARKET, BY DISTRIBUTION CHANNEL, 2022-2032 ($MILLION)
- TABLE 122. ARGENTINA CHEESE SAUCE MARKET, BY CHEESE TYPE, 2022-2032 ($MILLION)
- TABLE 123. ARGENTINA CHEESE SAUCE MARKET, BY SOURCE, 2022-2032 ($MILLION)
- TABLE 124. ARGENTINA CHEESE SAUCE MARKET, BY END USER, 2022-2032 ($MILLION)
- TABLE 125. ARGENTINA CHEESE SAUCE MARKET, BY DISTRIBUTION CHANNEL, 2022-2032 ($MILLION)
- TABLE 126. UAE CHEESE SAUCE MARKET, BY CHEESE TYPE, 2022-2032 ($MILLION)
- TABLE 127. UAE CHEESE SAUCE MARKET, BY SOURCE, 2022-2032 ($MILLION)
- TABLE 128. UAE CHEESE SAUCE MARKET, BY END USER, 2022-2032 ($MILLION)
- TABLE 129. UAE CHEESE SAUCE MARKET, BY DISTRIBUTION CHANNEL, 2022-2032 ($MILLION)
- TABLE 130. SOUTH AFRICA CHEESE SAUCE MARKET, BY CHEESE TYPE, 2022-2032 ($MILLION)
- TABLE 131. SOUTH AFRICA CHEESE SAUCE MARKET, BY SOURCE, 2022-2032 ($MILLION)
- TABLE 132. SOUTH AFRICA CHEESE SAUCE MARKET, BY END USER, 2022-2032 ($MILLION)
- TABLE 133. SOUTH AFRICA CHEESE SAUCE MARKET, BY DISTRIBUTION CHANNEL, 2022-2032 ($MILLION)
- TABLE 134. SAUDI ARABIA CHEESE SAUCE MARKET, BY CHEESE TYPE, 2022-2032 ($MILLION)
- TABLE 135. SAUDI ARABIA CHEESE SAUCE MARKET, BY SOURCE, 2022-2032 ($MILLION)
- TABLE 136. SAUDI ARABIA CHEESE SAUCE MARKET, BY END USER, 2022-2032 ($MILLION)
- TABLE 137. SAUDI ARABIA CHEESE SAUCE MARKET, BY DISTRIBUTION CHANNEL, 2022-2032 ($MILLION)
- TABLE 138. REST OF LAMEA CHEESE SAUCE MARKET, BY CHEESE TYPE, 2022-2032 ($MILLION)
- TABLE 139. REST OF LAMEA CHEESE SAUCE MARKET, BY SOURCE, 2022-2032 ($MILLION)
- TABLE 140. REST OF LAMEA CHEESE SAUCE MARKET, BY END USER, 2022-2032 ($MILLION)
- TABLE 141. REST OF LAMEA CHEESE SAUCE MARKET, BY DISTRIBUTION CHANNEL, 2022-2032 ($MILLION)
- TABLE 142. NESTLE S.A.: KEY EXECUTIVES
- TABLE 143. NESTLE S.A.: COMPANY SNAPSHOT
- TABLE 144. NESTLE S.A.: PRODUCT SEGMENTS
- TABLE 145. NESTLE S.A.: PRODUCT PORTFOLIO
- TABLE 146. UNILEVER PLC.: KEY EXECUTIVES
- TABLE 147. UNILEVER PLC.: COMPANY SNAPSHOT
- TABLE 148. UNILEVER PLC.: PRODUCT SEGMENTS
- TABLE 149. UNILEVER PLC.: PRODUCT PORTFOLIO
- TABLE 150. CAMPBELL SOUP COMPANY: KEY EXECUTIVES
- TABLE 151. CAMPBELL SOUP COMPANY: COMPANY SNAPSHOT
- TABLE 152. CAMPBELL SOUP COMPANY: PRODUCT SEGMENTS
- TABLE 153. CAMPBELL SOUP COMPANY: PRODUCT PORTFOLIO
- TABLE 154. TREEHOUSE FOODS, INC.: KEY EXECUTIVES
- TABLE 155. TREEHOUSE FOODS, INC.: COMPANY SNAPSHOT
- TABLE 156. TREEHOUSE FOODS, INC.: PRODUCT SEGMENTS
- TABLE 157. TREEHOUSE FOODS, INC.: PRODUCT PORTFOLIO
- TABLE 158. CONAGRA BRANDS, INC.: KEY EXECUTIVES
- TABLE 159. CONAGRA BRANDS, INC.: COMPANY SNAPSHOT
- TABLE 160. CONAGRA BRANDS, INC.: PRODUCT SEGMENTS
- TABLE 161. CONAGRA BRANDS, INC.: SERVICE SEGMENTS
- TABLE 162. CONAGRA BRANDS, INC.: PRODUCT PORTFOLIO
- TABLE 163. THE KRAFT HEINZ COMPANY: KEY EXECUTIVES
- TABLE 164. THE KRAFT HEINZ COMPANY: COMPANY SNAPSHOT
- TABLE 165. THE KRAFT HEINZ COMPANY: PRODUCT SEGMENTS
- TABLE 166. THE KRAFT HEINZ COMPANY: PRODUCT PORTFOLIO
- TABLE 167. THE KRAFT HEINZ COMPANY: KEY STRATERGIES
- TABLE 168. KERRY GROUP PLC.: KEY EXECUTIVES
- TABLE 169. KERRY GROUP PLC.: COMPANY SNAPSHOT
- TABLE 170. KERRY GROUP PLC.: PRODUCT SEGMENTS
- TABLE 171. KERRY GROUP PLC.: PRODUCT PORTFOLIO
- TABLE 172. GEHL FOODS, LLC.: KEY EXECUTIVES
- TABLE 173. GEHL FOODS, LLC.: COMPANY SNAPSHOT
- TABLE 174. GEHL FOODS, LLC.: PRODUCT SEGMENTS
- TABLE 175. GEHL FOODS, LLC.: PRODUCT PORTFOLIO
- TABLE 176. GEHL FOODS, LLC.: KEY STRATERGIES
- TABLE 177. AFP ADVANCED FOOD PRODUCTS, LLC.: KEY EXECUTIVES
- TABLE 178. AFP ADVANCED FOOD PRODUCTS, LLC.: COMPANY SNAPSHOT
- TABLE 179. AFP ADVANCED FOOD PRODUCTS, LLC.: SERVICE SEGMENTS
- TABLE 180. AFP ADVANCED FOOD PRODUCTS, LLC.: PRODUCT PORTFOLIO
- TABLE 181. AFP ADVANCED FOOD PRODUCTS, LLC.: KEY STRATERGIES
- TABLE 182. TATUA: KEY EXECUTIVES
- TABLE 183. TATUA: COMPANY SNAPSHOT
- TABLE 184. TATUA: PRODUCT SEGMENTS
- TABLE 185. TATUA: PRODUCT PORTFOLIO
LIST OF FIGURES
- FIGURE 01. CHEESE SAUCE MARKET, 2022-2032
- FIGURE 02. SEGMENTATION OF CHEESE SAUCE MARKET,2022-2032
- FIGURE 03. TOP IMPACTING FACTORS IN CHEESE SAUCE MARKET (2022 TO 2032)
- FIGURE 04. TOP INVESTMENT POCKETS IN CHEESE SAUCE MARKET (2023-2032)
- FIGURE 05. MODERATE BARGAINING POWER OF SUPPLIERS
- FIGURE 06. LOW THREAT OF NEW ENTRANTS
- FIGURE 07. MODERATE THREAT OF SUBSTITUTES
- FIGURE 08. MODERATE INTENSITY OF RIVALRY
- FIGURE 09. MODERATE BARGAINING POWER OF BUYERS
- FIGURE 10. GLOBAL CHEESE SAUCE MARKET:DRIVERS, RESTRAINTS AND OPPORTUNITIES
- FIGURE 11. CHEESE SAUCE MARKET, BY CHEESE TYPE, 2022 AND 2032(%)
- FIGURE 12. COMPARATIVE SHARE ANALYSIS OF CHEESE SAUCE MARKET FOR CHEDDAR, BY COUNTRY 2022 AND 2032(%)
- FIGURE 13. COMPARATIVE SHARE ANALYSIS OF CHEESE SAUCE MARKET FOR MOZZARELLA, BY COUNTRY 2022 AND 2032(%)
- FIGURE 14. COMPARATIVE SHARE ANALYSIS OF CHEESE SAUCE MARKET FOR PARMESAN, BY COUNTRY 2022 AND 2032(%)
- FIGURE 15. COMPARATIVE SHARE ANALYSIS OF CHEESE SAUCE MARKET FOR AMERICAN CHEESE, BY COUNTRY 2022 AND 2032(%)
- FIGURE 16. COMPARATIVE SHARE ANALYSIS OF CHEESE SAUCE MARKET FOR BLUE CHEESE, BY COUNTRY 2022 AND 2032(%)
- FIGURE 17. COMPARATIVE SHARE ANALYSIS OF CHEESE SAUCE MARKET FOR PROVOLONE, BY COUNTRY 2022 AND 2032(%)
- FIGURE 18. COMPARATIVE SHARE ANALYSIS OF CHEESE SAUCE MARKET FOR GOUDA, BY COUNTRY 2022 AND 2032(%)
- FIGURE 19. COMPARATIVE SHARE ANALYSIS OF CHEESE SAUCE MARKET FOR MONTERO JACK, BY COUNTRY 2022 AND 2032(%)
- FIGURE 20. COMPARATIVE SHARE ANALYSIS OF CHEESE SAUCE MARKET FOR OTHERS, BY COUNTRY 2022 AND 2032(%)
- FIGURE 21. CHEESE SAUCE MARKET, BY SOURCE, 2022 AND 2032(%)
- FIGURE 22. COMPARATIVE SHARE ANALYSIS OF CHEESE SAUCE MARKET FOR ORGANIC, BY COUNTRY 2022 AND 2032(%)
- FIGURE 23. COMPARATIVE SHARE ANALYSIS OF CHEESE SAUCE MARKET FOR CONVENTIONAL, BY COUNTRY 2022 AND 2032(%)
- FIGURE 24. CHEESE SAUCE MARKET, BY END USER, 2022 AND 2032(%)
- FIGURE 25. COMPARATIVE SHARE ANALYSIS OF CHEESE SAUCE MARKET FOR HOUSEHOLDS, BY COUNTRY 2022 AND 2032(%)
- FIGURE 26. COMPARATIVE SHARE ANALYSIS OF CHEESE SAUCE MARKET FOR RESTAURANTS, BY COUNTRY 2022 AND 2032(%)
- FIGURE 27. COMPARATIVE SHARE ANALYSIS OF CHEESE SAUCE MARKET FOR CAFES, BY COUNTRY 2022 AND 2032(%)
- FIGURE 28. COMPARATIVE SHARE ANALYSIS OF CHEESE SAUCE MARKET FOR HOTELS, BY COUNTRY 2022 AND 2032(%)
- FIGURE 29. COMPARATIVE SHARE ANALYSIS OF CHEESE SAUCE MARKET FOR CORPORATE CANTEEN, BY COUNTRY 2022 AND 2032(%)
- FIGURE 30. COMPARATIVE SHARE ANALYSIS OF CHEESE SAUCE MARKET FOR FAST FOOD JOINTS, BY COUNTRY 2022 AND 2032(%)
- FIGURE 31. COMPARATIVE SHARE ANALYSIS OF CHEESE SAUCE MARKET FOR OTHERS, BY COUNTRY 2022 AND 2032(%)
- FIGURE 32. CHEESE SAUCE MARKET, BY DISTRIBUTION CHANNEL, 2022 AND 2032(%)
- FIGURE 33. COMPARATIVE SHARE ANALYSIS OF CHEESE SAUCE MARKET FOR CONVENIENCE STORES, BY COUNTRY 2022 AND 2032(%)
- FIGURE 34. COMPARATIVE SHARE ANALYSIS OF CHEESE SAUCE MARKET FOR HYPERMARKETS/SUPERMARKETS, BY COUNTRY 2022 AND 2032(%)
- FIGURE 35. COMPARATIVE SHARE ANALYSIS OF CHEESE SAUCE MARKET FOR SPECIALTY STORES, BY COUNTRY 2022 AND 2032(%)
- FIGURE 36. COMPARATIVE SHARE ANALYSIS OF CHEESE SAUCE MARKET FOR DIRECT, BY COUNTRY 2022 AND 2032(%)
- FIGURE 37. COMPARATIVE SHARE ANALYSIS OF CHEESE SAUCE MARKET FOR ONLINE CHANNELS, BY COUNTRY 2022 AND 2032(%)
- FIGURE 38. COMPARATIVE SHARE ANALYSIS OF CHEESE SAUCE MARKET FOR OTHERS, BY COUNTRY 2022 AND 2032(%)
- FIGURE 39. CHEESE SAUCE MARKET BY REGION, 2022 AND 2032(%)
- FIGURE 40. U.S. CHEESE SAUCE MARKET, 2022-2032 ($MILLION)
- FIGURE 41. CANADA CHEESE SAUCE MARKET, 2022-2032 ($MILLION)
- FIGURE 42. MEXICO CHEESE SAUCE MARKET, 2022-2032 ($MILLION)
- FIGURE 43. GERMANY CHEESE SAUCE MARKET, 2022-2032 ($MILLION)
- FIGURE 44. FRANCE CHEESE SAUCE MARKET, 2022-2032 ($MILLION)
- FIGURE 45. UK CHEESE SAUCE MARKET, 2022-2032 ($MILLION)
- FIGURE 46. ITALY CHEESE SAUCE MARKET, 2022-2032 ($MILLION)
- FIGURE 47. SPAIN CHEESE SAUCE MARKET, 2022-2032 ($MILLION)
- FIGURE 48. RUSSIA CHEESE SAUCE MARKET, 2022-2032 ($MILLION)
- FIGURE 49. REST OF EUROPE CHEESE SAUCE MARKET, 2022-2032 ($MILLION)
- FIGURE 50. CHINA CHEESE SAUCE MARKET, 2022-2032 ($MILLION)
- FIGURE 51. JAPAN CHEESE SAUCE MARKET, 2022-2032 ($MILLION)
- FIGURE 52. INDIA CHEESE SAUCE MARKET, 2022-2032 ($MILLION)
- FIGURE 53. AUSTRALIA CHEESE SAUCE MARKET, 2022-2032 ($MILLION)
- FIGURE 54. SOUTH KOREA CHEESE SAUCE MARKET, 2022-2032 ($MILLION)
- FIGURE 55. INDONESIA CHEESE SAUCE MARKET, 2022-2032 ($MILLION)
- FIGURE 56. REST OF ASIA-PACIFIC CHEESE SAUCE MARKET, 2022-2032 ($MILLION)
- FIGURE 57. BRAZIL CHEESE SAUCE MARKET, 2022-2032 ($MILLION)
- FIGURE 58. ARGENTINA CHEESE SAUCE MARKET, 2022-2032 ($MILLION)
- FIGURE 59. UAE CHEESE SAUCE MARKET, 2022-2032 ($MILLION)
- FIGURE 60. SOUTH AFRICA CHEESE SAUCE MARKET, 2022-2032 ($MILLION)
- FIGURE 61. SAUDI ARABIA CHEESE SAUCE MARKET, 2022-2032 ($MILLION)
- FIGURE 62. REST OF LAMEA CHEESE SAUCE MARKET, 2022-2032 ($MILLION)
- FIGURE 63. TOP WINNING STRATEGIES, BY YEAR (2021-2022)
- FIGURE 64. TOP WINNING STRATEGIES, BY DEVELOPMENT (2021-2022)
- FIGURE 65. TOP WINNING STRATEGIES, BY COMPANY (2021-2022)
- FIGURE 66. PRODUCT MAPPING OF TOP 10 PLAYERS
- FIGURE 67. COMPETITIVE DASHBOARD
- FIGURE 68. COMPETITIVE HEATMAP: CHEESE SAUCE MARKET
- FIGURE 69. TOP PLAYER POSITIONING, 2022
- FIGURE 70. NESTLE S.A.: NET REVENUE, 2020-2022 ($MILLION)
- FIGURE 71. NESTLE S.A.: RESEARCH & DEVELOPMENT EXPENDITURE, 2020-2022 ($MILLION)
- FIGURE 72. NESTLE S.A.: REVENUE SHARE BY SEGMENT, 2022 (%)
- FIGURE 73. NESTLE S.A.: REVENUE SHARE BY REGION, 2022 (%)
- FIGURE 74. UNILEVER PLC.: SALES REVENUE, 2020-2022 ($MILLION)
- FIGURE 75. UNILEVER PLC.: REVENUE SHARE BY SEGMENT, 2022 (%)
- FIGURE 76. CAMPBELL SOUP COMPANY: NET SALES, 2020-2022 ($MILLION)
- FIGURE 77. CAMPBELL SOUP COMPANY: RESEARCH & DEVELOPMENT EXPENDITURE, 2020-2022
- FIGURE 78. CAMPBELL SOUP COMPANY: REVENUE SHARE BY SEGMENT, 2022 (%)
- FIGURE 79. TREEHOUSE FOODS, INC.: NET SALES, 2020-2022 ($MILLION)
- FIGURE 80. TREEHOUSE FOODS, INC.: REVENUE SHARE BY SEGMENT, 2022 (%)
- FIGURE 81. CONAGRA BRANDS, INC.: NET SALES, 2020-2022 ($MILLION)
- FIGURE 82. CONAGRA BRANDS, INC.: RESEARCH & DEVELOPMENT EXPENDITURE, 2020-2022
- FIGURE 83. CONAGRA BRANDS, INC.: REVENUE SHARE BY SEGMENT, 2022 (%)
- FIGURE 84. THE KRAFT HEINZ COMPANY: NET SALES, 2020-2022 ($MILLION)
- FIGURE 85. THE KRAFT HEINZ COMPANY: RESEARCH & DEVELOPMENT EXPENDITURE, 2020-2022 ($MILLION)
- FIGURE 86. THE KRAFT HEINZ COMPANY: REVENUE SHARE BY SEGMENT, 2022 (%)
- FIGURE 87. THE KRAFT HEINZ COMPANY: REVENUE SHARE BY REGION, 2022 (%)
- FIGURE 88. KERRY GROUP PLC.: NET REVENUE, 2020-2022 ($MILLION)
- FIGURE 89. KERRY GROUP PLC.: REVENUE SHARE BY REGION, 2022 (%)
- FIGURE 90. KERRY GROUP PLC.: REVENUE SHARE BY SEGMENT, 2022 (%)
- FIGURE 91. TATUA: SALES REVENUE, 2020-2022 ($MILLION)
- FIGURE 92. TATUA: REVENUE SHARE BY REGION, 2022 (%)

