
PUBLISHER: Allied Market Research | PRODUCT CODE: 1415006

PUBLISHER: Allied Market Research | PRODUCT CODE: 1415006
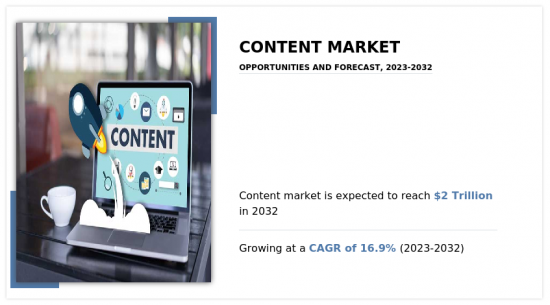
Content marketing Market By Channel Type (Social Media, Blogs, Video Platforms, Others), By End Use (Brand Awareness, Lead Generation, Others): Global Opportunity Analysis and Industry Forecast, 2023-2032
According to a new report published by Allied Market Research, titled, "Content marketing Market," The content marketing market was valued at $413.20 billion in 2022, and is estimated to reach $1956.4 billion by 2032, growing at a CAGR of 16.9% from 2023 to 2032. The content marketing industry is a dynamic and ever-evolving landscape driven by the diverse range of content formats and platforms available to businesses today. One of the fundamental components of content marketing is blogs which serve as a valuable resource for promoting products, discussing industry trends, and showcasing expertise. Blogs are often complemented with custom images and videos to enhance engagement.
In today's digital age, social media has emerged as a global platform that connects people from all corners of the world. It serves as a hub for individuals to connect, communicate, and share experiences with friends and acquaintances. However, the evolution of social media has not only transformed personal interactions but has also revolutionized the business world. Social media has evolved into one of the most indispensable tools in the realm of marketing strategy particularly in the context of brand health and development.
Social Media Content Marketing (SMCM) is the cornerstone of effective brand communication through social media platforms. It serves as the conduit for delivering impactful information to consumers captivating their attention and encouraging continued engagement with brands. Brand health, on the other hand, represents the long-term evaluation of a brand's awareness and equity among digital audiences. The role of SMCM in brand health is indispensable as it acts as the medium through which consumers gather information about brands and products. Effective SMCM has a direct impact on brand health, influencing the perception of consumers. A well-executed SMCM strategy can elevate a brand's health score by increasing awareness, building credibility, and enhancing brand equity. Therefore, it is imperative for businesses to excel in content marketing to attract and retain customers enticing them to visit their pages, stay updated with the latest news, and ultimately become repeat purchasers. The content marketing industry finds itself at the intersection of this digital transformation, with SMCM playing a pivotal role in shaping brand health and success in the contemporary market.
Lack of knowledge and expertise in effectively delivery the content to generate leads, create brand awareness, and increase the business revenue are few of the major factors estimated to restrain the content marketing market revenue growth in the upcoming years.
The growing popularity of video platforms to generate excellent opportunities in the market. Video platforms are increasingly using algorithms and user data to personalize content recommendations. This helps keep viewers engaged and encourages them to spend more time on the platform. Encouraging user-generated content (UGC) through challenges, contests, or user testimonials can be a powerful driver for video marketing. UGC adds authenticity and engagement to brand campaigns. A variety of content formats, such as explainer videos, tutorials, interviews, webinars, and storytelling, cater to different audience preferences and needs. Diversifying content keeps viewers engaged and informed.
Furthermore, partnering with social media influencers and content creators can help brands reach a broader and more engaged audience. Influencer marketing has become a significant driver of video content promotion. Advanced analytics tools provide valuable data on video performance, viewer behavior, and engagement metrics. This data-driven approach allows content creators to refine their strategies and optimize their content. Emerging technologies like Augmented Reality and Virtual Reality (AR/VR) are being integrated into video content marketing to create immersive experiences. These technologies can be particularly effective for industries like gaming, tourism, and real estate.
The COVID-19 pandemic led to positive impact on the content marketing industry owing to increase in digitization in the business globally and growing popularity of online platforms for shopping, entertainment, and others. The post-COVID content marketing industry is characterized by a continued emphasis on digital channels, an increased focus on authenticity and empathy, and an increasing reliance on data-driven personalization. While the pandemic accelerated these trends, they are now integral to the evolving landscape of content marketing.
The key players profiled in this report include: Jack In The Box, Media.Monks, Watconsult, BC Web Wise, Lowe Lintas, Wavemaker Global, Dentsu Webchutney, Ogilvy, Mindshare, and Social Beat. The market players are continuously striving to achieve a dominant position in this competitive market using strategies such as collaborations and acquisitions.
Key Benefits For Stakeholders
- This report provides a quantitative analysis of the market segments, current trends, estimations, and dynamics of the content marketing market analysis from 2022 to 2032 to identify the prevailing content marketing market opportunities.
- The market research is offered along with information related to key drivers, restraints, and opportunities.
- Porter's five forces analysis highlights the potency of buyers and suppliers to enable stakeholders make profit-oriented business decisions and strengthen their supplier-buyer network.
- In-depth analysis of the content marketing market segmentation assists to determine the prevailing market opportunities.
- Major countries in each region are mapped according to their revenue contribution to the global market.
- Market player positioning facilitates benchmarking and provides a clear understanding of the present position of the market players.
- The report includes the analysis of the regional as well as global content marketing market trends, key players, market segments, application areas, and market growth strategies.
Additional benefits you will get with this purchase are:
- Quarterly Update and* (only available with a corporate license, on listed price)
- 5 additional Company Profile of client Choice pre- or Post-purchase, as a free update.
- Free Upcoming Version on the Purchase of Five and Enterprise User License.
- 16 analyst hours of support* (post-purchase, if you find additional data requirements upon review of the report, you may receive support amounting to 16 analyst hours to solve questions, and post-sale queries)
- 15% Free Customization* (in case the scope or segment of the report does not match your requirements, 15% is equivalent to 3 working days of free work, applicable once)
- Free data Pack on the Five and Enterprise User License. (Excel version of the report)
- Free Updated report if the report is 6-12 months old or older.
- 24-hour priority response*
- Free Industry updates and white papers.
Possible Customization with this report (with additional cost and timeline, please talk to the sales executive to know more)
- Consumer Buying Behavior Analysis
- End user preferences and pain points
- Investment Opportunities
- Upcoming/New Entrant by Regions
- Technology Trend Analysis
- Go To Market Strategy
- Market share analysis of players by products/segments
- Pain Point Analysis
- Regulatory Guidelines
- Strategic Recommedations
- Additional company profiles with specific to client's interest
- Additional country or region analysis- market size and forecast
- Criss-cross segment analysis- market size and forecast
- Expanded list for Company Profiles
- Historic market data
- Market share analysis of players at global/region/country level
- SWOT Analysis
Key Market Segments
By Channel Type
- Social Media
- Blogs
- Video Platforms
- Others
By End Use
- Brand Awareness
- Lead Generation
- Others
By Region
- North America
- U.S.
- Canada
- Mexico
- Europe
- Germany
- UK
- France
- Spain
- Italy
- Rest of Europe
- Asia-Pacific
- China
- Japan
- India
- South Korea
- Australia
- Rest of Asia-Pacific
- LAMEA
- Brazil
- Saudi Arabia
- UAE
- South Africa
- Rest of LAMEA
Key Market Players:
- JACK IN THE BOX WORLDWIDE
- MEDIA.MONKS
- WATCONSULT
- bc web wise
- lowe lintas
- WAVEMAKER GLOBAL
- DENTSU WEBCHUTNEY
- Ogilvy
- Mindshare Media Ltd
- Social Beat Digital Marketing LLP
- TAG
- schbang
- ZOO MEDIA
- the glitch
TABLE OF CONTENTS
CHAPTER 1: INTRODUCTION
- 1.1. Report description
- 1.2. Key market segments
- 1.3. Key benefits to the stakeholders
- 1.4. Research methodology
- 1.4.1. Primary research
- 1.4.2. Secondary research
- 1.4.3. Analyst tools and models
CHAPTER 2: EXECUTIVE SUMMARY
- 2.1. CXO Perspective
CHAPTER 3: MARKET OVERVIEW
- 3.1. Market definition and scope
- 3.2. Key findings
- 3.2.1. Top impacting factors
- 3.2.2. Top investment pockets
- 3.3. Porter's five forces analysis
- 3.4. Market dynamics
- 3.4.1. Drivers
- 3.4.2. Restraints
- 3.4.3. Opportunities
- 3.5. Market Share Analysis
- 3.6. Value Chain Analysis
- 3.7. Key Regulation Analysis
- 3.8. Patent Landscape
CHAPTER 4: CONTENT MARKETING MARKET, BY CHANNEL TYPE
- 4.1. Overview
- 4.1.1. Market size and forecast
- 4.2. Social Media
- 4.2.1. Key market trends, growth factors and opportunities
- 4.2.2. Market size and forecast, by region
- 4.2.3. Market share analysis by country
- 4.3. Blogs
- 4.3.1. Key market trends, growth factors and opportunities
- 4.3.2. Market size and forecast, by region
- 4.3.3. Market share analysis by country
- 4.4. Video Platforms
- 4.4.1. Key market trends, growth factors and opportunities
- 4.4.2. Market size and forecast, by region
- 4.4.3. Market share analysis by country
- 4.5. Others
- 4.5.1. Key market trends, growth factors and opportunities
- 4.5.2. Market size and forecast, by region
- 4.5.3. Market share analysis by country
CHAPTER 5: CONTENT MARKETING MARKET, BY END USE
- 5.1. Overview
- 5.1.1. Market size and forecast
- 5.2. Brand Awareness
- 5.2.1. Key market trends, growth factors and opportunities
- 5.2.2. Market size and forecast, by region
- 5.2.3. Market share analysis by country
- 5.3. Lead Generation
- 5.3.1. Key market trends, growth factors and opportunities
- 5.3.2. Market size and forecast, by region
- 5.3.3. Market share analysis by country
- 5.4. Others
- 5.4.1. Key market trends, growth factors and opportunities
- 5.4.2. Market size and forecast, by region
- 5.4.3. Market share analysis by country
CHAPTER 6: CONTENT MARKETING MARKET, BY REGION
- 6.1. Overview
- 6.1.1. Market size and forecast By Region
- 6.2. North America
- 6.2.1. Key market trends, growth factors and opportunities
- 6.2.2. Market size and forecast, by Channel Type
- 6.2.3. Market size and forecast, by End Use
- 6.2.4. Market size and forecast, by country
- 6.2.4.1. U.S.
- 6.2.4.1.1. Market size and forecast, by Channel Type
- 6.2.4.1.2. Market size and forecast, by End Use
- 6.2.4.2. Canada
- 6.2.4.2.1. Market size and forecast, by Channel Type
- 6.2.4.2.2. Market size and forecast, by End Use
- 6.2.4.3. Mexico
- 6.2.4.3.1. Market size and forecast, by Channel Type
- 6.2.4.3.2. Market size and forecast, by End Use
- 6.3. Europe
- 6.3.1. Key market trends, growth factors and opportunities
- 6.3.2. Market size and forecast, by Channel Type
- 6.3.3. Market size and forecast, by End Use
- 6.3.4. Market size and forecast, by country
- 6.3.4.1. Germany
- 6.3.4.1.1. Market size and forecast, by Channel Type
- 6.3.4.1.2. Market size and forecast, by End Use
- 6.3.4.2. UK
- 6.3.4.2.1. Market size and forecast, by Channel Type
- 6.3.4.2.2. Market size and forecast, by End Use
- 6.3.4.3. France
- 6.3.4.3.1. Market size and forecast, by Channel Type
- 6.3.4.3.2. Market size and forecast, by End Use
- 6.3.4.4. Spain
- 6.3.4.4.1. Market size and forecast, by Channel Type
- 6.3.4.4.2. Market size and forecast, by End Use
- 6.3.4.5. Italy
- 6.3.4.5.1. Market size and forecast, by Channel Type
- 6.3.4.5.2. Market size and forecast, by End Use
- 6.3.4.6. Rest of Europe
- 6.3.4.6.1. Market size and forecast, by Channel Type
- 6.3.4.6.2. Market size and forecast, by End Use
- 6.4. Asia-Pacific
- 6.4.1. Key market trends, growth factors and opportunities
- 6.4.2. Market size and forecast, by Channel Type
- 6.4.3. Market size and forecast, by End Use
- 6.4.4. Market size and forecast, by country
- 6.4.4.1. China
- 6.4.4.1.1. Market size and forecast, by Channel Type
- 6.4.4.1.2. Market size and forecast, by End Use
- 6.4.4.2. Japan
- 6.4.4.2.1. Market size and forecast, by Channel Type
- 6.4.4.2.2. Market size and forecast, by End Use
- 6.4.4.3. India
- 6.4.4.3.1. Market size and forecast, by Channel Type
- 6.4.4.3.2. Market size and forecast, by End Use
- 6.4.4.4. South Korea
- 6.4.4.4.1. Market size and forecast, by Channel Type
- 6.4.4.4.2. Market size and forecast, by End Use
- 6.4.4.5. Australia
- 6.4.4.5.1. Market size and forecast, by Channel Type
- 6.4.4.5.2. Market size and forecast, by End Use
- 6.4.4.6. Rest of Asia-Pacific
- 6.4.4.6.1. Market size and forecast, by Channel Type
- 6.4.4.6.2. Market size and forecast, by End Use
- 6.5. LAMEA
- 6.5.1. Key market trends, growth factors and opportunities
- 6.5.2. Market size and forecast, by Channel Type
- 6.5.3. Market size and forecast, by End Use
- 6.5.4. Market size and forecast, by country
- 6.5.4.1. Brazil
- 6.5.4.1.1. Market size and forecast, by Channel Type
- 6.5.4.1.2. Market size and forecast, by End Use
- 6.5.4.2. Saudi Arabia
- 6.5.4.2.1. Market size and forecast, by Channel Type
- 6.5.4.2.2. Market size and forecast, by End Use
- 6.5.4.3. UAE
- 6.5.4.3.1. Market size and forecast, by Channel Type
- 6.5.4.3.2. Market size and forecast, by End Use
- 6.5.4.4. South Africa
- 6.5.4.4.1. Market size and forecast, by Channel Type
- 6.5.4.4.2. Market size and forecast, by End Use
- 6.5.4.5. Rest of LAMEA
- 6.5.4.5.1. Market size and forecast, by Channel Type
- 6.5.4.5.2. Market size and forecast, by End Use
CHAPTER 7: COMPETITIVE LANDSCAPE
- 7.1. Introduction
- 7.2. Top winning strategies
- 7.3. Product mapping of top 10 player
- 7.4. Competitive dashboard
- 7.5. Competitive heatmap
- 7.6. Top player positioning, 2022
CHAPTER 8: COMPANY PROFILES
- 8.1. JACK IN THE BOX WORLDWIDE
- 8.1.1. Company overview
- 8.1.2. Key executives
- 8.1.3. Company snapshot
- 8.2. MEDIA.MONKS
- 8.2.1. Company overview
- 8.2.2. Key executives
- 8.2.3. Company snapshot
- 8.3. WATCONSULT
- 8.3.1. Company overview
- 8.3.2. Key executives
- 8.3.3. Company snapshot
- 8.4. bc web wise
- 8.4.1. Company overview
- 8.4.2. Key executives
- 8.4.3. Company snapshot
- 8.5. lowe lintas
- 8.5.1. Company overview
- 8.5.2. Key executives
- 8.5.3. Company snapshot
- 8.6. WAVEMAKER GLOBAL
- 8.6.1. Company overview
- 8.6.2. Key executives
- 8.6.3. Company snapshot
- 8.7. DENTSU WEBCHUTNEY
- 8.7.1. Company overview
- 8.7.2. Key executives
- 8.7.3. Company snapshot
- 8.8. Ogilvy
- 8.8.1. Company overview
- 8.8.2. Key executives
- 8.8.3. Company snapshot
- 8.9. Mindshare Media Ltd
- 8.9.1. Company overview
- 8.9.2. Key executives
- 8.9.3. Company snapshot
- 8.10. Social Beat Digital Marketing LLP
- 8.10.1. Company overview
- 8.10.2. Key executives
- 8.10.3. Company snapshot
- 8.11. TAG
- 8.11.1. Company overview
- 8.11.2. Key executives
- 8.11.3. Company snapshot
- 8.12. schbang
- 8.12.1. Company overview
- 8.12.2. Key executives
- 8.12.3. Company snapshot
- 8.13. ZOO MEDIA
- 8.13.1. Company overview
- 8.13.2. Key executives
- 8.13.3. Company snapshot
- 8.14. the glitch
- 8.14.1. Company overview
- 8.14.2. Key executives
- 8.14.3. Company snapshot
LIST OF TABLES
- TABLE 01. GLOBAL CONTENT MARKETING MARKET, BY CHANNEL TYPE, 2022-2032 ($BILLION)
- TABLE 02. CONTENT MARKETING MARKET FOR SOCIAL MEDIA, BY REGION, 2022-2032 ($BILLION)
- TABLE 03. CONTENT MARKETING MARKET FOR BLOGS, BY REGION, 2022-2032 ($BILLION)
- TABLE 04. CONTENT MARKETING MARKET FOR VIDEO PLATFORMS, BY REGION, 2022-2032 ($BILLION)
- TABLE 05. CONTENT MARKETING MARKET FOR OTHERS, BY REGION, 2022-2032 ($BILLION)
- TABLE 06. GLOBAL CONTENT MARKETING MARKET, BY END USE, 2022-2032 ($BILLION)
- TABLE 07. CONTENT MARKETING MARKET FOR BRAND AWARENESS, BY REGION, 2022-2032 ($BILLION)
- TABLE 08. CONTENT MARKETING MARKET FOR LEAD GENERATION, BY REGION, 2022-2032 ($BILLION)
- TABLE 09. CONTENT MARKETING MARKET FOR OTHERS, BY REGION, 2022-2032 ($BILLION)
- TABLE 10. CONTENT MARKETING MARKET, BY REGION, 2022-2032 ($BILLION)
- TABLE 11. NORTH AMERICA CONTENT MARKETING MARKET, BY CHANNEL TYPE, 2022-2032 ($BILLION)
- TABLE 12. NORTH AMERICA CONTENT MARKETING MARKET, BY END USE, 2022-2032 ($BILLION)
- TABLE 13. NORTH AMERICA CONTENT MARKETING MARKET, BY COUNTRY, 2022-2032 ($BILLION)
- TABLE 14. U.S. CONTENT MARKETING MARKET, BY CHANNEL TYPE, 2022-2032 ($BILLION)
- TABLE 15. U.S. CONTENT MARKETING MARKET, BY END USE, 2022-2032 ($BILLION)
- TABLE 16. CANADA CONTENT MARKETING MARKET, BY CHANNEL TYPE, 2022-2032 ($BILLION)
- TABLE 17. CANADA CONTENT MARKETING MARKET, BY END USE, 2022-2032 ($BILLION)
- TABLE 18. MEXICO CONTENT MARKETING MARKET, BY CHANNEL TYPE, 2022-2032 ($BILLION)
- TABLE 19. MEXICO CONTENT MARKETING MARKET, BY END USE, 2022-2032 ($BILLION)
- TABLE 20. EUROPE CONTENT MARKETING MARKET, BY CHANNEL TYPE, 2022-2032 ($BILLION)
- TABLE 21. EUROPE CONTENT MARKETING MARKET, BY END USE, 2022-2032 ($BILLION)
- TABLE 22. EUROPE CONTENT MARKETING MARKET, BY COUNTRY, 2022-2032 ($BILLION)
- TABLE 23. GERMANY CONTENT MARKETING MARKET, BY CHANNEL TYPE, 2022-2032 ($BILLION)
- TABLE 24. GERMANY CONTENT MARKETING MARKET, BY END USE, 2022-2032 ($BILLION)
- TABLE 25. UK CONTENT MARKETING MARKET, BY CHANNEL TYPE, 2022-2032 ($BILLION)
- TABLE 26. UK CONTENT MARKETING MARKET, BY END USE, 2022-2032 ($BILLION)
- TABLE 27. FRANCE CONTENT MARKETING MARKET, BY CHANNEL TYPE, 2022-2032 ($BILLION)
- TABLE 28. FRANCE CONTENT MARKETING MARKET, BY END USE, 2022-2032 ($BILLION)
- TABLE 29. SPAIN CONTENT MARKETING MARKET, BY CHANNEL TYPE, 2022-2032 ($BILLION)
- TABLE 30. SPAIN CONTENT MARKETING MARKET, BY END USE, 2022-2032 ($BILLION)
- TABLE 31. ITALY CONTENT MARKETING MARKET, BY CHANNEL TYPE, 2022-2032 ($BILLION)
- TABLE 32. ITALY CONTENT MARKETING MARKET, BY END USE, 2022-2032 ($BILLION)
- TABLE 33. REST OF EUROPE CONTENT MARKETING MARKET, BY CHANNEL TYPE, 2022-2032 ($BILLION)
- TABLE 34. REST OF EUROPE CONTENT MARKETING MARKET, BY END USE, 2022-2032 ($BILLION)
- TABLE 35. ASIA-PACIFIC CONTENT MARKETING MARKET, BY CHANNEL TYPE, 2022-2032 ($BILLION)
- TABLE 36. ASIA-PACIFIC CONTENT MARKETING MARKET, BY END USE, 2022-2032 ($BILLION)
- TABLE 37. ASIA-PACIFIC CONTENT MARKETING MARKET, BY COUNTRY, 2022-2032 ($BILLION)
- TABLE 38. CHINA CONTENT MARKETING MARKET, BY CHANNEL TYPE, 2022-2032 ($BILLION)
- TABLE 39. CHINA CONTENT MARKETING MARKET, BY END USE, 2022-2032 ($BILLION)
- TABLE 40. JAPAN CONTENT MARKETING MARKET, BY CHANNEL TYPE, 2022-2032 ($BILLION)
- TABLE 41. JAPAN CONTENT MARKETING MARKET, BY END USE, 2022-2032 ($BILLION)
- TABLE 42. INDIA CONTENT MARKETING MARKET, BY CHANNEL TYPE, 2022-2032 ($BILLION)
- TABLE 43. INDIA CONTENT MARKETING MARKET, BY END USE, 2022-2032 ($BILLION)
- TABLE 44. SOUTH KOREA CONTENT MARKETING MARKET, BY CHANNEL TYPE, 2022-2032 ($BILLION)
- TABLE 45. SOUTH KOREA CONTENT MARKETING MARKET, BY END USE, 2022-2032 ($BILLION)
- TABLE 46. AUSTRALIA CONTENT MARKETING MARKET, BY CHANNEL TYPE, 2022-2032 ($BILLION)
- TABLE 47. AUSTRALIA CONTENT MARKETING MARKET, BY END USE, 2022-2032 ($BILLION)
- TABLE 48. REST OF ASIA-PACIFIC CONTENT MARKETING MARKET, BY CHANNEL TYPE, 2022-2032 ($BILLION)
- TABLE 49. REST OF ASIA-PACIFIC CONTENT MARKETING MARKET, BY END USE, 2022-2032 ($BILLION)
- TABLE 50. LAMEA CONTENT MARKETING MARKET, BY CHANNEL TYPE, 2022-2032 ($BILLION)
- TABLE 51. LAMEA CONTENT MARKETING MARKET, BY END USE, 2022-2032 ($BILLION)
- TABLE 52. LAMEA CONTENT MARKETING MARKET, BY COUNTRY, 2022-2032 ($BILLION)
- TABLE 53. BRAZIL CONTENT MARKETING MARKET, BY CHANNEL TYPE, 2022-2032 ($BILLION)
- TABLE 54. BRAZIL CONTENT MARKETING MARKET, BY END USE, 2022-2032 ($BILLION)
- TABLE 55. SAUDI ARABIA CONTENT MARKETING MARKET, BY CHANNEL TYPE, 2022-2032 ($BILLION)
- TABLE 56. SAUDI ARABIA CONTENT MARKETING MARKET, BY END USE, 2022-2032 ($BILLION)
- TABLE 57. UAE CONTENT MARKETING MARKET, BY CHANNEL TYPE, 2022-2032 ($BILLION)
- TABLE 58. UAE CONTENT MARKETING MARKET, BY END USE, 2022-2032 ($BILLION)
- TABLE 59. SOUTH AFRICA CONTENT MARKETING MARKET, BY CHANNEL TYPE, 2022-2032 ($BILLION)
- TABLE 60. SOUTH AFRICA CONTENT MARKETING MARKET, BY END USE, 2022-2032 ($BILLION)
- TABLE 61. REST OF LAMEA CONTENT MARKETING MARKET, BY CHANNEL TYPE, 2022-2032 ($BILLION)
- TABLE 62. REST OF LAMEA CONTENT MARKETING MARKET, BY END USE, 2022-2032 ($BILLION)
- TABLE 63. JACK IN THE BOX WORLDWIDE: KEY EXECUTIVES
- TABLE 64. JACK IN THE BOX WORLDWIDE: COMPANY SNAPSHOT
- TABLE 65. MEDIA.MONKS: KEY EXECUTIVES
- TABLE 66. MEDIA.MONKS: COMPANY SNAPSHOT
- TABLE 67. WATCONSULT: KEY EXECUTIVES
- TABLE 68. WATCONSULT: COMPANY SNAPSHOT
- TABLE 69. BC WEB WISE: KEY EXECUTIVES
- TABLE 70. BC WEB WISE: COMPANY SNAPSHOT
- TABLE 71. LOWE LINTAS: KEY EXECUTIVES
- TABLE 72. LOWE LINTAS: COMPANY SNAPSHOT
- TABLE 73. WAVEMAKER GLOBAL: KEY EXECUTIVES
- TABLE 74. WAVEMAKER GLOBAL: COMPANY SNAPSHOT
- TABLE 75. DENTSU WEBCHUTNEY: KEY EXECUTIVES
- TABLE 76. DENTSU WEBCHUTNEY: COMPANY SNAPSHOT
- TABLE 77. OGILVY: KEY EXECUTIVES
- TABLE 78. OGILVY: COMPANY SNAPSHOT
- TABLE 79. MINDSHARE MEDIA LTD: KEY EXECUTIVES
- TABLE 80. MINDSHARE MEDIA LTD: COMPANY SNAPSHOT
- TABLE 81. SOCIAL BEAT DIGITAL MARKETING LLP: KEY EXECUTIVES
- TABLE 82. SOCIAL BEAT DIGITAL MARKETING LLP: COMPANY SNAPSHOT
- TABLE 83. TAG: KEY EXECUTIVES
- TABLE 84. TAG: COMPANY SNAPSHOT
- TABLE 85. SCHBANG: KEY EXECUTIVES
- TABLE 86. SCHBANG: COMPANY SNAPSHOT
- TABLE 87. ZOO MEDIA: KEY EXECUTIVES
- TABLE 88. ZOO MEDIA: COMPANY SNAPSHOT
- TABLE 89. THE GLITCH: KEY EXECUTIVES
- TABLE 90. THE GLITCH: COMPANY SNAPSHOT
LIST OF FIGURES
- FIGURE 01. CONTENT MARKETING MARKET, 2022-2032
- FIGURE 02. SEGMENTATION OF CONTENT MARKETING MARKET,2022-2032
- FIGURE 03. TOP IMPACTING FACTORS IN CONTENT MARKETING MARKET
- FIGURE 04. TOP INVESTMENT POCKETS IN CONTENT MARKETING MARKET (2023-2032)
- FIGURE 05. BARGAINING POWER OF SUPPLIERS
- FIGURE 06. BARGAINING POWER OF BUYERS
- FIGURE 07. THREAT OF SUBSTITUTION
- FIGURE 08. THREAT OF SUBSTITUTION
- FIGURE 09. COMPETITIVE RIVALRY
- FIGURE 10. GLOBAL CONTENT MARKETING MARKET:DRIVERS, RESTRAINTS AND OPPORTUNITIES
- FIGURE 11. IMPACT OF KEY REGULATION: CONTENT MARKETING MARKET
- FIGURE 12. PATENT ANALYSIS BY COMPANY
- FIGURE 13. PATENT ANALYSIS BY COUNTRY
- FIGURE 14. CONTENT MARKETING MARKET, BY CHANNEL TYPE, 2022 AND 2032(%)
- FIGURE 15. COMPARATIVE SHARE ANALYSIS OF CONTENT MARKETING MARKET FOR SOCIAL MEDIA, BY COUNTRY 2022 AND 2032(%)
- FIGURE 16. COMPARATIVE SHARE ANALYSIS OF CONTENT MARKETING MARKET FOR BLOGS, BY COUNTRY 2022 AND 2032(%)
- FIGURE 17. COMPARATIVE SHARE ANALYSIS OF CONTENT MARKETING MARKET FOR VIDEO PLATFORMS, BY COUNTRY 2022 AND 2032(%)
- FIGURE 18. COMPARATIVE SHARE ANALYSIS OF CONTENT MARKETING MARKET FOR OTHERS, BY COUNTRY 2022 AND 2032(%)
- FIGURE 19. CONTENT MARKETING MARKET, BY END USE, 2022 AND 2032(%)
- FIGURE 20. COMPARATIVE SHARE ANALYSIS OF CONTENT MARKETING MARKET FOR BRAND AWARENESS, BY COUNTRY 2022 AND 2032(%)
- FIGURE 21. COMPARATIVE SHARE ANALYSIS OF CONTENT MARKETING MARKET FOR LEAD GENERATION, BY COUNTRY 2022 AND 2032(%)
- FIGURE 22. COMPARATIVE SHARE ANALYSIS OF CONTENT MARKETING MARKET FOR OTHERS, BY COUNTRY 2022 AND 2032(%)
- FIGURE 23. CONTENT MARKETING MARKET BY REGION, 2022 AND 2032(%)
- FIGURE 24. U.S. CONTENT MARKETING MARKET, 2022-2032 ($BILLION)
- FIGURE 25. CANADA CONTENT MARKETING MARKET, 2022-2032 ($BILLION)
- FIGURE 26. MEXICO CONTENT MARKETING MARKET, 2022-2032 ($BILLION)
- FIGURE 27. GERMANY CONTENT MARKETING MARKET, 2022-2032 ($BILLION)
- FIGURE 28. UK CONTENT MARKETING MARKET, 2022-2032 ($BILLION)
- FIGURE 29. FRANCE CONTENT MARKETING MARKET, 2022-2032 ($BILLION)
- FIGURE 30. SPAIN CONTENT MARKETING MARKET, 2022-2032 ($BILLION)
- FIGURE 31. ITALY CONTENT MARKETING MARKET, 2022-2032 ($BILLION)
- FIGURE 32. REST OF EUROPE CONTENT MARKETING MARKET, 2022-2032 ($BILLION)
- FIGURE 33. CHINA CONTENT MARKETING MARKET, 2022-2032 ($BILLION)
- FIGURE 34. JAPAN CONTENT MARKETING MARKET, 2022-2032 ($BILLION)
- FIGURE 35. INDIA CONTENT MARKETING MARKET, 2022-2032 ($BILLION)
- FIGURE 36. SOUTH KOREA CONTENT MARKETING MARKET, 2022-2032 ($BILLION)
- FIGURE 37. AUSTRALIA CONTENT MARKETING MARKET, 2022-2032 ($BILLION)
- FIGURE 38. REST OF ASIA-PACIFIC CONTENT MARKETING MARKET, 2022-2032 ($BILLION)
- FIGURE 39. BRAZIL CONTENT MARKETING MARKET, 2022-2032 ($BILLION)
- FIGURE 40. SAUDI ARABIA CONTENT MARKETING MARKET, 2022-2032 ($BILLION)
- FIGURE 41. UAE CONTENT MARKETING MARKET, 2022-2032 ($BILLION)
- FIGURE 42. SOUTH AFRICA CONTENT MARKETING MARKET, 2022-2032 ($BILLION)
- FIGURE 43. REST OF LAMEA CONTENT MARKETING MARKET, 2022-2032 ($BILLION)
- FIGURE 44. PRODUCT MAPPING OF TOP 10 PLAYERS
- FIGURE 45. COMPETITIVE DASHBOARD
- FIGURE 46. COMPETITIVE HEATMAP: CONTENT MARKETING MARKET
- FIGURE 47. TOP PLAYER POSITIONING, 2022

