
PUBLISHER: Allied Market Research | PRODUCT CODE: 1446395

PUBLISHER: Allied Market Research | PRODUCT CODE: 1446395
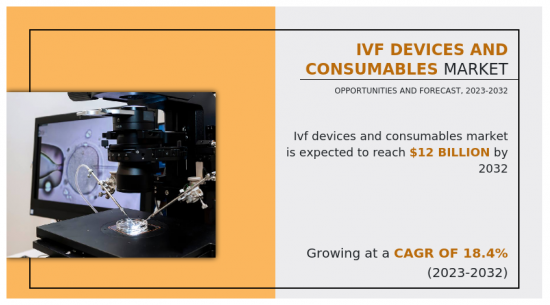
IVF Devices and Consumables Market By Product, By Technology, By End User : Global Opportunity Analysis and Industry Forecast, 2023-2032
The growth of the global IVF devices and consumables market is majorly driven by an increase in trend of delayed pregnancies, surge in awareness about fertility treatments, and technological advancements in IVF devices. Furthermore, the rise in infertility rates globally has been a significant driver of the IVF devices and consumables market. Moreover, lifestyle changes, delayed pregnancies, and various medical conditions contribute to higher incidences of infertility, prompting individuals and couples to seek assisted reproductive technologies.
In addition, the increase in the number of fertility clinics across the globe has improved accessibility to IVF procedures. As these clinics expand their reach to smaller cities and towns, more people are becoming aware of the availability of various IVF procedures and treatments. This rise in awareness, coupled with advancements in medical technologies, is expected to increase the demand for IVF devices and consumables during the forecast period.
Furthermore, government initiatives and policies supporting infertility treatments, including financial assistance and insurance coverage, surge in number of gamete donations, and increase in healthcare expenditure worldwide act as the key driving forces of the global market. Moreover, increased awareness about fertility treatments, coupled with a reduction in social stigma surrounding infertility, has led to greater acceptance of IVF as a viable solution, which is expected to drive the market growth. For instance, the National Infertility Awareness Week (NIAW) in April 2022 shed light on the commonality of fertility issues, with 186 million individuals and 48 million couples worldwide facing fertility issues. The change in societal attitudes has expanded the market by encouraging more people to consider assisted reproductive technologies.
However, higher cost of treatment, complications associated with IVF, and lack of awareness among the population especially in underdeveloped economies impede market growth. In contrast, surge in number of fertility clinics & service providers and high growth potential in emerging countries are anticipated to provides lucrative opportunity for the market growth during the forecast period.
The global IVF devices and consumables market is segmented into product, technology, end user, and region. By product, the market is classified into instruments, accessories & disposables, and reagents & media. The instruments segment is further categorized into sperm separation systems, cryosystems, incubators, imaging systems, ovum aspiration pumps, cabinets, micromanipulators, and others. The reagents & media is sub segmented into cryopreservation media, semen processing media, ovum processing media, and embryo culture media.
By technology, the market is classified into fresh embryo IVF, frozen embryo IVF, and donor egg IVF. Depending on end user, it is segregated into fertility clinics, hospital, surgical centers, and clinical research institutes. Region wise, it is analyzed across North America (U.S., Canada, and Mexico), Europe (Germany, France, UK, Italy, Spain, and rest of Europe), Asia-Pacific (Japan, China, India, Australia, South Korea, and rest of Asia-Pacific), and LAMEA (Brazil, South Africa, Saudi Arabia, and rest of LAMEA).
The key players that operate in the global IVF devices and consumables market are Cook Group, Cooper Companies, Inc. Genea Limited, Fujifilm Holdings Corporation, Hamilton Thorne Ltd., Vitrolife AB, Esco Micro Pte. Ltd., Nidacon International AB, Kitazato Corporation, and Thermo Fisher Scientific, Inc. These players have adopted product launch, expansion, agreement, acquisition, and collaboration as their key strategies to expand their product portfolio and strengthen their foothold in the market.
Key Benefits For Stakeholders
- This report provides a quantitative analysis of the market segments, current trends, estimations, and dynamics of the ivf devices and consumables market analysis from 2022 to 2032 to identify the prevailing ivf devices and consumables market opportunities.
- The market research is offered along with information related to key drivers, restraints, and opportunities.
- Porter's five forces analysis highlights the potency of buyers and suppliers to enable stakeholders make profit-oriented business decisions and strengthen their supplier-buyer network.
- In-depth analysis of the ivf devices and consumables market segmentation assists to determine the prevailing market opportunities.
- Major countries in each region are mapped according to their revenue contribution to the global market.
- Market player positioning facilitates benchmarking and provides a clear understanding of the present position of the market players.
- The report includes the analysis of the regional as well as global ivf devices and consumables market trends, key players, market segments, application areas, and market growth strategies.
Additional benefits you will get with this purchase are:
- Quarterly Update and* (only available with a corporate license, on listed price)
- 5 additional Company Profile of client Choice pre- or Post-purchase, as a free update.
- Free Upcoming Version on the Purchase of Five and Enterprise User License.
- 16 analyst hours of support* (post-purchase, if you find additional data requirements upon review of the report, you may receive support amounting to 16 analyst hours to solve questions, and post-sale queries)
- 15% Free Customization* (in case the scope or segment of the report does not match your requirements, 15% is equivalent to 3 working days of free work, applicable once)
- Free data Pack on the Five and Enterprise User License. (Excel version of the report)
- Free Updated report if the report is 6-12 months old or older.
- 24-hour priority response*
- Free Industry updates and white papers.
Possible Customization with this report (with additional cost and timeline, please talk to the sales executive to know more)
- Patient/epidemiology data at country, region, global level
- Regulatory Guidelines
- Additional company profiles with specific to client's interest
- Expanded list for Company Profiles
- Historic market data
- Reimbursement Scenario
- SWOT Analysis
Key Market Segments
By End User
- Clinical Research Institutes
- Fertility Clinics
- Hospitals
- Surgical Centers
By Product
- Instruments
- Type
- Sperm Separation System
- Cryosystem
- Incubator
- Imaging System
- Ovum Aspiration Pump
- Cabinet
- Micromanipulator
- Others
- Accessories and Disposables
- Reagents and Media
- Type
- Cryopreservation Media
- Semen Processing Media
- Ovum Processing Media
- Embryo Culture Media
By Technology
- Fresh Embryo IVF
- Frozen Embryo IVF
- Donor Egg IVF
By Region
- North America
- U.S.
- Canada
- Mexico
- Europe
- Germany
- France
- UK
- Italy
- Spain
- Rest of Europe
- Asia-Pacific
- Japan
- China
- India
- Australia
- South Korea
- Rest of Asia-Pacific
- LAMEA
- Brazil
- Saudi Arabia
- South Africa
- Rest of LAMEA
Key Market Players:
- Vitrolife AB
- Kitazato Corporation
- Hamilton Thorne Ltd.
- Nidacon International AB
- Esco Micro Pte. Ltd.
- Cooper Companies, Inc.
- Fujifilm Holdings Corporation
- Genea Limited
- Thermo Fisher Scientific, Inc.
- Cook Group
TABLE OF CONTENTS
CHAPTER 1: INTRODUCTION
- 1.1. Report description
- 1.2. Key market segments
- 1.3. Key benefits to the stakeholders
- 1.4. Research methodology
- 1.4.1. Primary research
- 1.4.2. Secondary research
- 1.4.3. Analyst tools and models
CHAPTER 2: EXECUTIVE SUMMARY
- 2.1. CXO Perspective
CHAPTER 3: MARKET OVERVIEW
- 3.1. Market definition and scope
- 3.2. Key findings
- 3.2.1. Top impacting factors
- 3.2.2. Top investment pockets
- 3.3. Porter's five forces analysis
- 3.3.1. Moderate bargaining power of suppliers
- 3.3.2. Moderate threat of new entrants
- 3.3.3. Moderate threat of substitutes
- 3.3.4. Moderate intensity of rivalry
- 3.3.5. Moderate bargaining power of buyers
- 3.4. Market dynamics
- 3.4.1. Drivers
- 3.4.1.1. Increase in infertility rates
- 3.4.1.2. Delayed pregnancies among women
- 3.4.1.3. Technological advancements in IVF devices
- 3.4.2. Restraints
- 3.4.2.1. High cost of IVF treatment
- 3.4.3. Opportunities
- 3.4.3.1. Growth opportunities in emerging markets
- 3.4.3.2. Rise in number of fertility clinics
- 3.4.3.3. Rise in trend of fertility tourism
- 3.4.1. Drivers
CHAPTER 4: IVF DEVICES AND CONSUMABLES MARKET, BY PRODUCT
- 4.1. Overview
- 4.1.1. Market size and forecast
- 4.2. Instruments
- 4.2.1. Key market trends, growth factors and opportunities
- 4.2.2. Market size and forecast, by region
- 4.2.3. Market share analysis by country
- 4.2.4. Instruments IVF Devices and Consumables Market by Type
- 4.3. Accessories and Disposables
- 4.3.1. Key market trends, growth factors and opportunities
- 4.3.2. Market size and forecast, by region
- 4.3.3. Market share analysis by country
- 4.4. Reagents and Media
- 4.4.1. Key market trends, growth factors and opportunities
- 4.4.2. Market size and forecast, by region
- 4.4.3. Market share analysis by country
- 4.4.4. Reagents and Media IVF Devices and Consumables Market by Type
CHAPTER 5: IVF DEVICES AND CONSUMABLES MARKET, BY TECHNOLOGY
- 5.1. Overview
- 5.1.1. Market size and forecast
- 5.2. Fresh Embryo IVF
- 5.2.1. Key market trends, growth factors and opportunities
- 5.2.2. Market size and forecast, by region
- 5.2.3. Market share analysis by country
- 5.3. Frozen Embryo IVF
- 5.3.1. Key market trends, growth factors and opportunities
- 5.3.2. Market size and forecast, by region
- 5.3.3. Market share analysis by country
- 5.4. Donor Egg IVF
- 5.4.1. Key market trends, growth factors and opportunities
- 5.4.2. Market size and forecast, by region
- 5.4.3. Market share analysis by country
CHAPTER 6: IVF DEVICES AND CONSUMABLES MARKET, BY END USER
- 6.1. Overview
- 6.1.1. Market size and forecast
- 6.2. Fertility Clinics
- 6.2.1. Key market trends, growth factors and opportunities
- 6.2.2. Market size and forecast, by region
- 6.2.3. Market share analysis by country
- 6.3. Hospitals
- 6.3.1. Key market trends, growth factors and opportunities
- 6.3.2. Market size and forecast, by region
- 6.3.3. Market share analysis by country
- 6.4. Surgical Centers
- 6.4.1. Key market trends, growth factors and opportunities
- 6.4.2. Market size and forecast, by region
- 6.4.3. Market share analysis by country
- 6.5. Clinical Research Institutes
- 6.5.1. Key market trends, growth factors and opportunities
- 6.5.2. Market size and forecast, by region
- 6.5.3. Market share analysis by country
CHAPTER 7: IVF DEVICES AND CONSUMABLES MARKET, BY REGION
- 7.1. Overview
- 7.1.1. Market size and forecast By Region
- 7.2. North America
- 7.2.1. Key market trends, growth factors and opportunities
- 7.2.2. Market size and forecast, by Product
- 7.2.3. Market size and forecast, by Technology
- 7.2.4. Market size and forecast, by End User
- 7.2.5. Market size and forecast, by country
- 7.2.5.1. U.S.
- 7.2.5.1.1. Market size and forecast, by Product
- 7.2.5.1.2. Market size and forecast, by Technology
- 7.2.5.1.3. Market size and forecast, by End User
- 7.2.5.2. Canada
- 7.2.5.2.1. Market size and forecast, by Product
- 7.2.5.2.2. Market size and forecast, by Technology
- 7.2.5.2.3. Market size and forecast, by End User
- 7.2.5.3. Mexico
- 7.2.5.3.1. Market size and forecast, by Product
- 7.2.5.3.2. Market size and forecast, by Technology
- 7.2.5.3.3. Market size and forecast, by End User
- 7.3. Europe
- 7.3.1. Key market trends, growth factors and opportunities
- 7.3.2. Market size and forecast, by Product
- 7.3.3. Market size and forecast, by Technology
- 7.3.4. Market size and forecast, by End User
- 7.3.5. Market size and forecast, by country
- 7.3.5.1. Germany
- 7.3.5.1.1. Market size and forecast, by Product
- 7.3.5.1.2. Market size and forecast, by Technology
- 7.3.5.1.3. Market size and forecast, by End User
- 7.3.5.2. France
- 7.3.5.2.1. Market size and forecast, by Product
- 7.3.5.2.2. Market size and forecast, by Technology
- 7.3.5.2.3. Market size and forecast, by End User
- 7.3.5.3. UK
- 7.3.5.3.1. Market size and forecast, by Product
- 7.3.5.3.2. Market size and forecast, by Technology
- 7.3.5.3.3. Market size and forecast, by End User
- 7.3.5.4. Italy
- 7.3.5.4.1. Market size and forecast, by Product
- 7.3.5.4.2. Market size and forecast, by Technology
- 7.3.5.4.3. Market size and forecast, by End User
- 7.3.5.5. Spain
- 7.3.5.5.1. Market size and forecast, by Product
- 7.3.5.5.2. Market size and forecast, by Technology
- 7.3.5.5.3. Market size and forecast, by End User
- 7.3.5.6. Rest of Europe
- 7.3.5.6.1. Market size and forecast, by Product
- 7.3.5.6.2. Market size and forecast, by Technology
- 7.3.5.6.3. Market size and forecast, by End User
- 7.4. Asia-Pacific
- 7.4.1. Key market trends, growth factors and opportunities
- 7.4.2. Market size and forecast, by Product
- 7.4.3. Market size and forecast, by Technology
- 7.4.4. Market size and forecast, by End User
- 7.4.5. Market size and forecast, by country
- 7.4.5.1. Japan
- 7.4.5.1.1. Market size and forecast, by Product
- 7.4.5.1.2. Market size and forecast, by Technology
- 7.4.5.1.3. Market size and forecast, by End User
- 7.4.5.2. China
- 7.4.5.2.1. Market size and forecast, by Product
- 7.4.5.2.2. Market size and forecast, by Technology
- 7.4.5.2.3. Market size and forecast, by End User
- 7.4.5.3. India
- 7.4.5.3.1. Market size and forecast, by Product
- 7.4.5.3.2. Market size and forecast, by Technology
- 7.4.5.3.3. Market size and forecast, by End User
- 7.4.5.4. Australia
- 7.4.5.4.1. Market size and forecast, by Product
- 7.4.5.4.2. Market size and forecast, by Technology
- 7.4.5.4.3. Market size and forecast, by End User
- 7.4.5.5. South Korea
- 7.4.5.5.1. Market size and forecast, by Product
- 7.4.5.5.2. Market size and forecast, by Technology
- 7.4.5.5.3. Market size and forecast, by End User
- 7.4.5.6. Rest of Asia-Pacific
- 7.4.5.6.1. Market size and forecast, by Product
- 7.4.5.6.2. Market size and forecast, by Technology
- 7.4.5.6.3. Market size and forecast, by End User
- 7.5. LAMEA
- 7.5.1. Key market trends, growth factors and opportunities
- 7.5.2. Market size and forecast, by Product
- 7.5.3. Market size and forecast, by Technology
- 7.5.4. Market size and forecast, by End User
- 7.5.5. Market size and forecast, by country
- 7.5.5.1. Brazil
- 7.5.5.1.1. Market size and forecast, by Product
- 7.5.5.1.2. Market size and forecast, by Technology
- 7.5.5.1.3. Market size and forecast, by End User
- 7.5.5.2. Saudi Arabia
- 7.5.5.2.1. Market size and forecast, by Product
- 7.5.5.2.2. Market size and forecast, by Technology
- 7.5.5.2.3. Market size and forecast, by End User
- 7.5.5.3. South Africa
- 7.5.5.3.1. Market size and forecast, by Product
- 7.5.5.3.2. Market size and forecast, by Technology
- 7.5.5.3.3. Market size and forecast, by End User
- 7.5.5.4. Rest of LAMEA
- 7.5.5.4.1. Market size and forecast, by Product
- 7.5.5.4.2. Market size and forecast, by Technology
- 7.5.5.4.3. Market size and forecast, by End User
CHAPTER 8: COMPETITIVE LANDSCAPE
- 8.1. Introduction
- 8.2. Top winning strategies
- 8.3. Product mapping of top 10 player
- 8.4. Competitive dashboard
- 8.5. Competitive heatmap
- 8.6. Top player positioning, 2022
CHAPTER 9: COMPANY PROFILES
- 9.1. Cook Group
- 9.1.1. Company overview
- 9.1.2. Key executives
- 9.1.3. Company snapshot
- 9.1.4. Operating business segments
- 9.1.5. Product portfolio
- 9.1.6. Key strategic moves and developments
- 9.2. Cooper Companies, Inc.
- 9.2.1. Company overview
- 9.2.2. Key executives
- 9.2.3. Company snapshot
- 9.2.4. Operating business segments
- 9.2.5. Product portfolio
- 9.2.6. Business performance
- 9.2.7. Key strategic moves and developments
- 9.3. Genea Limited
- 9.3.1. Company overview
- 9.3.2. Key executives
- 9.3.3. Company snapshot
- 9.3.4. Operating business segments
- 9.3.5. Product portfolio
- 9.3.6. Key strategic moves and developments
- 9.4. Fujifilm Holdings Corporation
- 9.4.1. Company overview
- 9.4.2. Key executives
- 9.4.3. Company snapshot
- 9.4.4. Operating business segments
- 9.4.5. Product portfolio
- 9.4.6. Business performance
- 9.4.7. Key strategic moves and developments
- 9.5. Thermo Fisher Scientific, Inc.
- 9.5.1. Company overview
- 9.5.2. Key executives
- 9.5.3. Company snapshot
- 9.5.4. Operating business segments
- 9.5.5. Product portfolio
- 9.5.6. Business performance
- 9.5.7. Key strategic moves and developments
- 9.6. Vitrolife AB
- 9.6.1. Company overview
- 9.6.2. Key executives
- 9.6.3. Company snapshot
- 9.6.4. Operating business segments
- 9.6.5. Product portfolio
- 9.6.6. Business performance
- 9.7. Hamilton Thorne Ltd.
- 9.7.1. Company overview
- 9.7.2. Key executives
- 9.7.3. Company snapshot
- 9.7.4. Operating business segments
- 9.7.5. Product portfolio
- 9.7.6. Business performance
- 9.8. Esco Micro Pte. Ltd.
- 9.8.1. Company overview
- 9.8.2. Key executives
- 9.8.3. Company snapshot
- 9.8.4. Operating business segments
- 9.8.5. Product portfolio
- 9.8.6. Key strategic moves and developments
- 9.9. Kitazato Corporation
- 9.9.1. Company overview
- 9.9.2. Key executives
- 9.9.3. Company snapshot
- 9.9.4. Operating business segments
- 9.9.5. Product portfolio
- 9.10. Nidacon International AB
- 9.10.1. Company overview
- 9.10.2. Key executives
- 9.10.3. Company snapshot
- 9.10.4. Operating business segments
- 9.10.5. Product portfolio
LIST OF TABLES
- TABLE 01. GLOBAL IVF DEVICES AND CONSUMABLES MARKET, BY PRODUCT, 2022-2032 ($MILLION)
- TABLE 02. IVF DEVICES AND CONSUMABLES MARKET FOR INSTRUMENTS, BY REGION, 2022-2032 ($MILLION)
- TABLE 03. GLOBAL INSTRUMENTS IVF DEVICES AND CONSUMABLES MARKET, BY TYPE, 2022-2032 ($MILLION)
- TABLE 04. IVF DEVICES AND CONSUMABLES MARKET FOR ACCESSORIES AND DISPOSABLES, BY REGION, 2022-2032 ($MILLION)
- TABLE 05. IVF DEVICES AND CONSUMABLES MARKET FOR REAGENTS AND MEDIA, BY REGION, 2022-2032 ($MILLION)
- TABLE 06. GLOBAL REAGENTS AND MEDIA IVF DEVICES AND CONSUMABLES MARKET, BY TYPE, 2022-2032 ($MILLION)
- TABLE 07. GLOBAL IVF DEVICES AND CONSUMABLES MARKET, BY TECHNOLOGY, 2022-2032 ($MILLION)
- TABLE 08. IVF DEVICES AND CONSUMABLES MARKET FOR FRESH EMBRYO IVF, BY REGION, 2022-2032 ($MILLION)
- TABLE 09. IVF DEVICES AND CONSUMABLES MARKET FOR FROZEN EMBRYO IVF, BY REGION, 2022-2032 ($MILLION)
- TABLE 10. IVF DEVICES AND CONSUMABLES MARKET FOR DONOR EGG IVF, BY REGION, 2022-2032 ($MILLION)
- TABLE 11. GLOBAL IVF DEVICES AND CONSUMABLES MARKET, BY END USER, 2022-2032 ($MILLION)
- TABLE 12. IVF DEVICES AND CONSUMABLES MARKET FOR FERTILITY CLINICS, BY REGION, 2022-2032 ($MILLION)
- TABLE 13. IVF DEVICES AND CONSUMABLES MARKET FOR HOSPITALS, BY REGION, 2022-2032 ($MILLION)
- TABLE 14. IVF DEVICES AND CONSUMABLES MARKET FOR SURGICAL CENTERS, BY REGION, 2022-2032 ($MILLION)
- TABLE 15. IVF DEVICES AND CONSUMABLES MARKET FOR CLINICAL RESEARCH INSTITUTES, BY REGION, 2022-2032 ($MILLION)
- TABLE 16. IVF DEVICES AND CONSUMABLES MARKET, BY REGION, 2022-2032 ($MILLION)
- TABLE 17. NORTH AMERICA IVF DEVICES AND CONSUMABLES MARKET, BY PRODUCT, 2022-2032 ($MILLION)
- TABLE 18. NORTH AMERICA IVF DEVICES AND CONSUMABLES MARKET, BY TECHNOLOGY, 2022-2032 ($MILLION)
- TABLE 19. NORTH AMERICA IVF DEVICES AND CONSUMABLES MARKET, BY END USER, 2022-2032 ($MILLION)
- TABLE 20. NORTH AMERICA IVF DEVICES AND CONSUMABLES MARKET, BY COUNTRY, 2022-2032 ($MILLION)
- TABLE 21. U.S. IVF DEVICES AND CONSUMABLES MARKET, BY PRODUCT, 2022-2032 ($MILLION)
- TABLE 22. U.S. IVF DEVICES AND CONSUMABLES MARKET, BY TECHNOLOGY, 2022-2032 ($MILLION)
- TABLE 23. U.S. IVF DEVICES AND CONSUMABLES MARKET, BY END USER, 2022-2032 ($MILLION)
- TABLE 24. CANADA IVF DEVICES AND CONSUMABLES MARKET, BY PRODUCT, 2022-2032 ($MILLION)
- TABLE 25. CANADA IVF DEVICES AND CONSUMABLES MARKET, BY TECHNOLOGY, 2022-2032 ($MILLION)
- TABLE 26. CANADA IVF DEVICES AND CONSUMABLES MARKET, BY END USER, 2022-2032 ($MILLION)
- TABLE 27. MEXICO IVF DEVICES AND CONSUMABLES MARKET, BY PRODUCT, 2022-2032 ($MILLION)
- TABLE 28. MEXICO IVF DEVICES AND CONSUMABLES MARKET, BY TECHNOLOGY, 2022-2032 ($MILLION)
- TABLE 29. MEXICO IVF DEVICES AND CONSUMABLES MARKET, BY END USER, 2022-2032 ($MILLION)
- TABLE 30. EUROPE IVF DEVICES AND CONSUMABLES MARKET, BY PRODUCT, 2022-2032 ($MILLION)
- TABLE 31. EUROPE IVF DEVICES AND CONSUMABLES MARKET, BY TECHNOLOGY, 2022-2032 ($MILLION)
- TABLE 32. EUROPE IVF DEVICES AND CONSUMABLES MARKET, BY END USER, 2022-2032 ($MILLION)
- TABLE 33. EUROPE IVF DEVICES AND CONSUMABLES MARKET, BY COUNTRY, 2022-2032 ($MILLION)
- TABLE 34. GERMANY IVF DEVICES AND CONSUMABLES MARKET, BY PRODUCT, 2022-2032 ($MILLION)
- TABLE 35. GERMANY IVF DEVICES AND CONSUMABLES MARKET, BY TECHNOLOGY, 2022-2032 ($MILLION)
- TABLE 36. GERMANY IVF DEVICES AND CONSUMABLES MARKET, BY END USER, 2022-2032 ($MILLION)
- TABLE 37. FRANCE IVF DEVICES AND CONSUMABLES MARKET, BY PRODUCT, 2022-2032 ($MILLION)
- TABLE 38. FRANCE IVF DEVICES AND CONSUMABLES MARKET, BY TECHNOLOGY, 2022-2032 ($MILLION)
- TABLE 39. FRANCE IVF DEVICES AND CONSUMABLES MARKET, BY END USER, 2022-2032 ($MILLION)
- TABLE 40. UK IVF DEVICES AND CONSUMABLES MARKET, BY PRODUCT, 2022-2032 ($MILLION)
- TABLE 41. UK IVF DEVICES AND CONSUMABLES MARKET, BY TECHNOLOGY, 2022-2032 ($MILLION)
- TABLE 42. UK IVF DEVICES AND CONSUMABLES MARKET, BY END USER, 2022-2032 ($MILLION)
- TABLE 43. ITALY IVF DEVICES AND CONSUMABLES MARKET, BY PRODUCT, 2022-2032 ($MILLION)
- TABLE 44. ITALY IVF DEVICES AND CONSUMABLES MARKET, BY TECHNOLOGY, 2022-2032 ($MILLION)
- TABLE 45. ITALY IVF DEVICES AND CONSUMABLES MARKET, BY END USER, 2022-2032 ($MILLION)
- TABLE 46. SPAIN IVF DEVICES AND CONSUMABLES MARKET, BY PRODUCT, 2022-2032 ($MILLION)
- TABLE 47. SPAIN IVF DEVICES AND CONSUMABLES MARKET, BY TECHNOLOGY, 2022-2032 ($MILLION)
- TABLE 48. SPAIN IVF DEVICES AND CONSUMABLES MARKET, BY END USER, 2022-2032 ($MILLION)
- TABLE 49. REST OF EUROPE IVF DEVICES AND CONSUMABLES MARKET, BY PRODUCT, 2022-2032 ($MILLION)
- TABLE 50. REST OF EUROPE IVF DEVICES AND CONSUMABLES MARKET, BY TECHNOLOGY, 2022-2032 ($MILLION)
- TABLE 51. REST OF EUROPE IVF DEVICES AND CONSUMABLES MARKET, BY END USER, 2022-2032 ($MILLION)
- TABLE 52. ASIA-PACIFIC IVF DEVICES AND CONSUMABLES MARKET, BY PRODUCT, 2022-2032 ($MILLION)
- TABLE 53. ASIA-PACIFIC IVF DEVICES AND CONSUMABLES MARKET, BY TECHNOLOGY, 2022-2032 ($MILLION)
- TABLE 54. ASIA-PACIFIC IVF DEVICES AND CONSUMABLES MARKET, BY END USER, 2022-2032 ($MILLION)
- TABLE 55. ASIA-PACIFIC IVF DEVICES AND CONSUMABLES MARKET, BY COUNTRY, 2022-2032 ($MILLION)
- TABLE 56. JAPAN IVF DEVICES AND CONSUMABLES MARKET, BY PRODUCT, 2022-2032 ($MILLION)
- TABLE 57. JAPAN IVF DEVICES AND CONSUMABLES MARKET, BY TECHNOLOGY, 2022-2032 ($MILLION)
- TABLE 58. JAPAN IVF DEVICES AND CONSUMABLES MARKET, BY END USER, 2022-2032 ($MILLION)
- TABLE 59. CHINA IVF DEVICES AND CONSUMABLES MARKET, BY PRODUCT, 2022-2032 ($MILLION)
- TABLE 60. CHINA IVF DEVICES AND CONSUMABLES MARKET, BY TECHNOLOGY, 2022-2032 ($MILLION)
- TABLE 61. CHINA IVF DEVICES AND CONSUMABLES MARKET, BY END USER, 2022-2032 ($MILLION)
- TABLE 62. INDIA IVF DEVICES AND CONSUMABLES MARKET, BY PRODUCT, 2022-2032 ($MILLION)
- TABLE 63. INDIA IVF DEVICES AND CONSUMABLES MARKET, BY TECHNOLOGY, 2022-2032 ($MILLION)
- TABLE 64. INDIA IVF DEVICES AND CONSUMABLES MARKET, BY END USER, 2022-2032 ($MILLION)
- TABLE 65. AUSTRALIA IVF DEVICES AND CONSUMABLES MARKET, BY PRODUCT, 2022-2032 ($MILLION)
- TABLE 66. AUSTRALIA IVF DEVICES AND CONSUMABLES MARKET, BY TECHNOLOGY, 2022-2032 ($MILLION)
- TABLE 67. AUSTRALIA IVF DEVICES AND CONSUMABLES MARKET, BY END USER, 2022-2032 ($MILLION)
- TABLE 68. SOUTH KOREA IVF DEVICES AND CONSUMABLES MARKET, BY PRODUCT, 2022-2032 ($MILLION)
- TABLE 69. SOUTH KOREA IVF DEVICES AND CONSUMABLES MARKET, BY TECHNOLOGY, 2022-2032 ($MILLION)
- TABLE 70. SOUTH KOREA IVF DEVICES AND CONSUMABLES MARKET, BY END USER, 2022-2032 ($MILLION)
- TABLE 71. REST OF ASIA-PACIFIC IVF DEVICES AND CONSUMABLES MARKET, BY PRODUCT, 2022-2032 ($MILLION)
- TABLE 72. REST OF ASIA-PACIFIC IVF DEVICES AND CONSUMABLES MARKET, BY TECHNOLOGY, 2022-2032 ($MILLION)
- TABLE 73. REST OF ASIA-PACIFIC IVF DEVICES AND CONSUMABLES MARKET, BY END USER, 2022-2032 ($MILLION)
- TABLE 74. LAMEA IVF DEVICES AND CONSUMABLES MARKET, BY PRODUCT, 2022-2032 ($MILLION)
- TABLE 75. LAMEA IVF DEVICES AND CONSUMABLES MARKET, BY TECHNOLOGY, 2022-2032 ($MILLION)
- TABLE 76. LAMEA IVF DEVICES AND CONSUMABLES MARKET, BY END USER, 2022-2032 ($MILLION)
- TABLE 77. LAMEA IVF DEVICES AND CONSUMABLES MARKET, BY COUNTRY, 2022-2032 ($MILLION)
- TABLE 78. BRAZIL IVF DEVICES AND CONSUMABLES MARKET, BY PRODUCT, 2022-2032 ($MILLION)
- TABLE 79. BRAZIL IVF DEVICES AND CONSUMABLES MARKET, BY TECHNOLOGY, 2022-2032 ($MILLION)
- TABLE 80. BRAZIL IVF DEVICES AND CONSUMABLES MARKET, BY END USER, 2022-2032 ($MILLION)
- TABLE 81. SAUDI ARABIA IVF DEVICES AND CONSUMABLES MARKET, BY PRODUCT, 2022-2032 ($MILLION)
- TABLE 82. SAUDI ARABIA IVF DEVICES AND CONSUMABLES MARKET, BY TECHNOLOGY, 2022-2032 ($MILLION)
- TABLE 83. SAUDI ARABIA IVF DEVICES AND CONSUMABLES MARKET, BY END USER, 2022-2032 ($MILLION)
- TABLE 84. SOUTH AFRICA IVF DEVICES AND CONSUMABLES MARKET, BY PRODUCT, 2022-2032 ($MILLION)
- TABLE 85. SOUTH AFRICA IVF DEVICES AND CONSUMABLES MARKET, BY TECHNOLOGY, 2022-2032 ($MILLION)
- TABLE 86. SOUTH AFRICA IVF DEVICES AND CONSUMABLES MARKET, BY END USER, 2022-2032 ($MILLION)
- TABLE 87. REST OF LAMEA IVF DEVICES AND CONSUMABLES MARKET, BY PRODUCT, 2022-2032 ($MILLION)
- TABLE 88. REST OF LAMEA IVF DEVICES AND CONSUMABLES MARKET, BY TECHNOLOGY, 2022-2032 ($MILLION)
- TABLE 89. REST OF LAMEA IVF DEVICES AND CONSUMABLES MARKET, BY END USER, 2022-2032 ($MILLION)
- TABLE 90. COOK GROUP: KEY EXECUTIVES
- TABLE 91. COOK GROUP: COMPANY SNAPSHOT
- TABLE 92. COOK GROUP: PRODUCT SEGMENTS
- TABLE 93. COOK GROUP: PRODUCT PORTFOLIO
- TABLE 94. COOK GROUP: KEY STRATERGIES
- TABLE 95. COOPER COMPANIES, INC.: KEY EXECUTIVES
- TABLE 96. COOPER COMPANIES, INC.: COMPANY SNAPSHOT
- TABLE 97. COOPER COMPANIES, INC.: PRODUCT SEGMENTS
- TABLE 98. COOPER COMPANIES, INC.: PRODUCT PORTFOLIO
- TABLE 99. COOPER COMPANIES, INC.: KEY STRATERGIES
- TABLE 100. GENEA LIMITED: KEY EXECUTIVES
- TABLE 101. GENEA LIMITED: COMPANY SNAPSHOT
- TABLE 102. GENEA LIMITED: SERVICE SEGMENTS
- TABLE 103. GENEA LIMITED: PRODUCT PORTFOLIO
- TABLE 104. GENEA LIMITED: KEY STRATERGIES
- TABLE 105. FUJIFILM HOLDINGS CORPORATION: KEY EXECUTIVES
- TABLE 106. FUJIFILM HOLDINGS CORPORATION: COMPANY SNAPSHOT
- TABLE 107. FUJIFILM HOLDINGS CORPORATION: PRODUCT SEGMENTS
- TABLE 108. FUJIFILM HOLDINGS CORPORATION: PRODUCT PORTFOLIO
- TABLE 109. FUJIFILM HOLDINGS CORPORATION: KEY STRATERGIES
- TABLE 110. THERMO FISHER SCIENTIFIC, INC.: KEY EXECUTIVES
- TABLE 111. THERMO FISHER SCIENTIFIC, INC.: COMPANY SNAPSHOT
- TABLE 112. THERMO FISHER SCIENTIFIC, INC.: PRODUCT SEGMENTS
- TABLE 113. THERMO FISHER SCIENTIFIC, INC.: PRODUCT PORTFOLIO
- TABLE 114. THERMO FISHER SCIENTIFIC, INC.: KEY STRATERGIES
- TABLE 115. VITROLIFE AB: KEY EXECUTIVES
- TABLE 116. VITROLIFE AB: COMPANY SNAPSHOT
- TABLE 117. VITROLIFE AB: PRODUCT SEGMENTS
- TABLE 118. VITROLIFE AB: PRODUCT PORTFOLIO
- TABLE 119. HAMILTON THORNE LTD.: KEY EXECUTIVES
- TABLE 120. HAMILTON THORNE LTD.: COMPANY SNAPSHOT
- TABLE 121. HAMILTON THORNE LTD.: PRODUCT SEGMENTS
- TABLE 122. HAMILTON THORNE LTD.: PRODUCT PORTFOLIO
- TABLE 123. ESCO MICRO PTE. LTD.: KEY EXECUTIVES
- TABLE 124. ESCO MICRO PTE. LTD.: COMPANY SNAPSHOT
- TABLE 125. ESCO MICRO PTE. LTD.: PRODUCT SEGMENTS
- TABLE 126. ESCO MICRO PTE. LTD.: PRODUCT PORTFOLIO
- TABLE 127. ESCO MICRO PTE. LTD.: KEY STRATERGIES
- TABLE 128. KITAZATO CORPORATION: KEY EXECUTIVES
- TABLE 129. KITAZATO CORPORATION: COMPANY SNAPSHOT
- TABLE 130. KITAZATO CORPORATION: PRODUCT SEGMENTS
- TABLE 131. KITAZATO CORPORATION: PRODUCT PORTFOLIO
- TABLE 132. NIDACON INTERNATIONAL AB: KEY EXECUTIVES
- TABLE 133. NIDACON INTERNATIONAL AB: COMPANY SNAPSHOT
- TABLE 134. NIDACON INTERNATIONAL AB: PRODUCT SEGMENTS
- TABLE 135. NIDACON INTERNATIONAL AB: PRODUCT PORTFOLIO
LIST OF FIGURES
- FIGURE 01. IVF DEVICES AND CONSUMABLES MARKET, 2022-2032
- FIGURE 02. SEGMENTATION OF IVF DEVICES AND CONSUMABLES MARKET,2022-2032
- FIGURE 03. TOP IMPACTING FACTORS IN IVF DEVICES AND CONSUMABLES MARKET (2022 TO 2032)
- FIGURE 04. TOP INVESTMENT POCKETS IN IVF DEVICES AND CONSUMABLES MARKET (2023-2032)
- FIGURE 05. MODERATE BARGAINING POWER OF SUPPLIERS
- FIGURE 06. MODERATE THREAT OF NEW ENTRANTS
- FIGURE 07. MODERATE THREAT OF SUBSTITUTES
- FIGURE 08. MODERATE INTENSITY OF RIVALRY
- FIGURE 09. MODERATE BARGAINING POWER OF BUYERS
- FIGURE 10. GLOBAL IVF DEVICES AND CONSUMABLES MARKET:DRIVERS, RESTRAINTS AND OPPORTUNITIES
- FIGURE 11. IVF DEVICES AND CONSUMABLES MARKET, BY PRODUCT, 2022 AND 2032(%)
- FIGURE 12. COMPARATIVE SHARE ANALYSIS OF IVF DEVICES AND CONSUMABLES MARKET FOR INSTRUMENTS, BY COUNTRY 2022 AND 2032(%)
- FIGURE 13. COMPARATIVE SHARE ANALYSIS OF IVF DEVICES AND CONSUMABLES MARKET FOR ACCESSORIES AND DISPOSABLES, BY COUNTRY 2022 AND 2032(%)
- FIGURE 14. COMPARATIVE SHARE ANALYSIS OF IVF DEVICES AND CONSUMABLES MARKET FOR REAGENTS AND MEDIA, BY COUNTRY 2022 AND 2032(%)
- FIGURE 15. IVF DEVICES AND CONSUMABLES MARKET, BY TECHNOLOGY, 2022 AND 2032(%)
- FIGURE 16. COMPARATIVE SHARE ANALYSIS OF IVF DEVICES AND CONSUMABLES MARKET FOR FRESH EMBRYO IVF, BY COUNTRY 2022 AND 2032(%)
- FIGURE 17. COMPARATIVE SHARE ANALYSIS OF IVF DEVICES AND CONSUMABLES MARKET FOR FROZEN EMBRYO IVF, BY COUNTRY 2022 AND 2032(%)
- FIGURE 18. COMPARATIVE SHARE ANALYSIS OF IVF DEVICES AND CONSUMABLES MARKET FOR DONOR EGG IVF, BY COUNTRY 2022 AND 2032(%)
- FIGURE 19. IVF DEVICES AND CONSUMABLES MARKET, BY END USER, 2022 AND 2032(%)
- FIGURE 20. COMPARATIVE SHARE ANALYSIS OF IVF DEVICES AND CONSUMABLES MARKET FOR FERTILITY CLINICS, BY COUNTRY 2022 AND 2032(%)
- FIGURE 21. COMPARATIVE SHARE ANALYSIS OF IVF DEVICES AND CONSUMABLES MARKET FOR HOSPITALS, BY COUNTRY 2022 AND 2032(%)
- FIGURE 22. COMPARATIVE SHARE ANALYSIS OF IVF DEVICES AND CONSUMABLES MARKET FOR SURGICAL CENTERS, BY COUNTRY 2022 AND 2032(%)
- FIGURE 23. COMPARATIVE SHARE ANALYSIS OF IVF DEVICES AND CONSUMABLES MARKET FOR CLINICAL RESEARCH INSTITUTES, BY COUNTRY 2022 AND 2032(%)
- FIGURE 24. IVF DEVICES AND CONSUMABLES MARKET BY REGION, 2022 AND 2032(%)
- FIGURE 25. U.S. IVF DEVICES AND CONSUMABLES MARKET, 2022-2032 ($MILLION)
- FIGURE 26. CANADA IVF DEVICES AND CONSUMABLES MARKET, 2022-2032 ($MILLION)
- FIGURE 27. MEXICO IVF DEVICES AND CONSUMABLES MARKET, 2022-2032 ($MILLION)
- FIGURE 28. GERMANY IVF DEVICES AND CONSUMABLES MARKET, 2022-2032 ($MILLION)
- FIGURE 29. FRANCE IVF DEVICES AND CONSUMABLES MARKET, 2022-2032 ($MILLION)
- FIGURE 30. UK IVF DEVICES AND CONSUMABLES MARKET, 2022-2032 ($MILLION)
- FIGURE 31. ITALY IVF DEVICES AND CONSUMABLES MARKET, 2022-2032 ($MILLION)
- FIGURE 32. SPAIN IVF DEVICES AND CONSUMABLES MARKET, 2022-2032 ($MILLION)
- FIGURE 33. REST OF EUROPE IVF DEVICES AND CONSUMABLES MARKET, 2022-2032 ($MILLION)
- FIGURE 34. JAPAN IVF DEVICES AND CONSUMABLES MARKET, 2022-2032 ($MILLION)
- FIGURE 35. CHINA IVF DEVICES AND CONSUMABLES MARKET, 2022-2032 ($MILLION)
- FIGURE 36. INDIA IVF DEVICES AND CONSUMABLES MARKET, 2022-2032 ($MILLION)
- FIGURE 37. AUSTRALIA IVF DEVICES AND CONSUMABLES MARKET, 2022-2032 ($MILLION)
- FIGURE 38. SOUTH KOREA IVF DEVICES AND CONSUMABLES MARKET, 2022-2032 ($MILLION)
- FIGURE 39. REST OF ASIA-PACIFIC IVF DEVICES AND CONSUMABLES MARKET, 2022-2032 ($MILLION)
- FIGURE 40. BRAZIL IVF DEVICES AND CONSUMABLES MARKET, 2022-2032 ($MILLION)
- FIGURE 41. SAUDI ARABIA IVF DEVICES AND CONSUMABLES MARKET, 2022-2032 ($MILLION)
- FIGURE 42. SOUTH AFRICA IVF DEVICES AND CONSUMABLES MARKET, 2022-2032 ($MILLION)
- FIGURE 43. REST OF LAMEA IVF DEVICES AND CONSUMABLES MARKET, 2022-2032 ($MILLION)
- FIGURE 44. TOP WINNING STRATEGIES, BY YEAR (2020-2023)
- FIGURE 45. TOP WINNING STRATEGIES, BY DEVELOPMENT (2020-2023)
- FIGURE 46. TOP WINNING STRATEGIES, BY COMPANY (2020-2023)
- FIGURE 47. PRODUCT MAPPING OF TOP 10 PLAYERS
- FIGURE 48. COMPETITIVE DASHBOARD
- FIGURE 49. COMPETITIVE HEATMAP: IVF DEVICES AND CONSUMABLES MARKET
- FIGURE 50. TOP PLAYER POSITIONING, 2022
- FIGURE 51. COOPER COMPANIES, INC.: NET REVENUE, 2020-2022 ($MILLION)
- FIGURE 52. COOPER COMPANIES, INC.: REVENUE SHARE BY SEGMENT, 2022 (%)
- FIGURE 53. COOPER COMPANIES, INC.: REVENUE SHARE BY REGION, 2022 (%)
- FIGURE 54. FUJIFILM HOLDINGS CORPORATION: NET REVENUE, 2021-2023 ($MILLION)
- FIGURE 55. FUJIFILM HOLDINGS CORPORATION: REVENUE SHARE BY SEGMENT, 2022 (%)
- FIGURE 56. FUJIFILM HOLDINGS CORPORATION: REVENUE SHARE BY REGION, 2022 (%)
- FIGURE 57. THERMO FISHER SCIENTIFIC, INC.: NET REVENUE, 2020-2022 ($MILLION)
- FIGURE 58. THERMO FISHER SCIENTIFIC, INC.: REVENUE SHARE BY SEGMENT, 2022 (%)
- FIGURE 59. THERMO FISHER SCIENTIFIC, INC.: REVENUE SHARE BY REGION, 2021 (%)
- FIGURE 60. VITROLIFE AB: NET SALES, 2020-2022 ($MILLION)
- FIGURE 61. VITROLIFE AB: REVENUE SHARE BY SEGMENT, 2022 (%)
- FIGURE 62. VITROLIFE AB: REVENUE SHARE BY REGION, 2022 (%)
- FIGURE 63. HAMILTON THORNE LTD.: NET SALES, 2020-2022 ($MILLION)

