
PUBLISHER: Allied Market Research | PRODUCT CODE: 1446416

PUBLISHER: Allied Market Research | PRODUCT CODE: 1446416
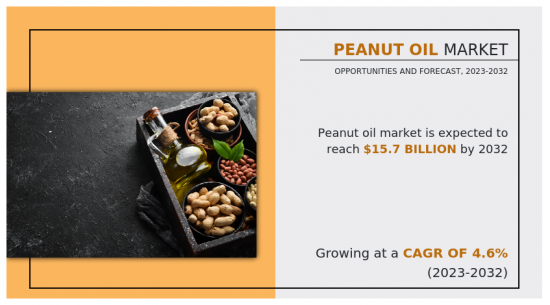
Peanut Oil Market By Type, By Application, By Distribution Channel : Global Opportunity Analysis and Industry Forecast, 2023-2032
Peanut oil has a long history of usage since ancient times. Its adaptability and health benefits have driven it across regional boundaries, making it essential in cuisines across the world. The cultural and historical journey illustrates its timeless value in cooking traditions and its continuous relevance in modern cuisines, from its origins in Asia to its incorporation into many global cuisines.
The peanut oil market has experienced rapid growth owing to its high levels of monounsaturated and polyunsaturated fats, which is often recognized as a healthier choice compared to oils rich in saturated fats. These fats in peanut oil may assist in regulating blood sugar, particularly beneficial for individuals with diabetes, and are a preferred component in the Mediterranean diet. A study revealed that incorporating peanut oil into half of one's fat intake significantly enhanced both total and LDL cholesterol, similar to the effects of olive oil. Additionally, the presence of omega-6 fatty acids in peanut oil contributes to maintaining a well-balanced lipid profile. While omega-6 fats are essential, maintaining an optimal balance with omega-3 fats is crucial for overall heart health and in reducing the risk of chronic diseases. As consumers increasingly prioritize health and seek alternatives to saturated fats, peanut oil emerges as a versatile, flavorful, and heart-healthy option.
However, peanut oil stands as a nutrient-rich source, having phytochemicals like campesterol, B-sitosterol, sigmasterol, and resveratrol. These compounds showcase the potential in preventing colon, breast, and prostate cancer. Abundant in vitamin E and B3, it provides antioxidants that protect cells from oxidative stress and offer potential protective effects against Alzheimer's disease. The bioactive compound resveratrol not only holds promise in combatting Alzheimer's but also exhibits efficacy in addressing nerve-related problems. This diverse health profile elevates peanut oil from a basic culinary ingredient to a functional food, with inherent preventive and therapeutic properties.
Moreover, the pricing of peanut oil is subject to a multitude of factors, including agricultural conditions, global supply and demand dynamics, weather phenomena, geopolitical factors, and the overarching economic environment. These variables contribute to unexpected and sudden fluctuations in peanut oil prices, impacting both producers and consumers. Consumers, in response to unexpected price shifts, may adjust their choices and budgeting for cooking oils. The prices of peanut oil experience a sudden surge or surpass that of alternative oils, consumers may gravitate towards more stable or cost-effective options, thereby influencing the demand for peanut oil. Producers, on the other hand, face challenges in planning and operational decisions due to the volatility in prices. The oscillating prices can affect profit margins, posing difficulties for peanut oil producers in effectively anticipating and managing production costs. Consequently, such uncertainties may have a restriction on investment decisions, production levels, and the overall stability of the market.
Furthermore, with the rise in consumer preference for natural and clean-label products, peanut oil has become the preferred choice for cooking. Individuals who prioritize purity and transparency in their dietary selections are expected to resonate with peanut oil's commitment to being minimally processed, non-GMO, and entirely natural. By highlighting these fundamental qualities, peanut oil can position itself as a wholesome and unadulterated cooking option, sourced directly from peanuts and without genetic modification. This strategic positioning not only gains trust but also aligns with the escalating demand for natural and clean ingredients in the culinary landscape. Additionally, it caters to the expectations of contemporary consumers who seek clear and concise information about the meals they incorporate into their diets. In meeting these criteria, peanut oil stands as a pure and health-conscious cooking alternative, perfectly attuned to the evolving preferences of the modern consumer.
The peanut oil market is segmented on the basis of type, application, distribution channel and region. By type, the market is divided into refined and unrefined. By application, the market is divided into cosmetics, food, pharmaceuticals and others. By distribution channel, the market is divided into hypermarkets/supermarkets, independent retail, business-to-business and online stores. Region-wise, the market is analyzed across North America (the U.S., Canada, and Mexico), Europe (the UK, Germany, France, Russia, Italy, and the rest of Europe), Asia-Pacific (China, Japan, India, South Korea, Australia, South Korea, Indonesia, and the rest of Asia-Pacific), Latin America (Brazil, Colombia, Argentina and rest of Latin America) and MEA (GCC, South Africa and the rest of MEA).
The major players operating in the market focus on key market strategies, such as mergers, product launches, acquisitions, collaborations, and partnerships. They have been focusing on strengthening their market reach to maintain their reputation in the ever-competitive market. Some of the key players in the peanut oil market include Olam International, CHS Inc., Cargill, Inc., Wilmar International Limited, Archer Daniels Midland, Patanjali Ayurvedic Limited Incorporated, Mother Dairy, Hain Celestial, Bettcher Industries, Inc., and COFCO Corporation.
Key Benefits For Stakeholders
- This report provides a quantitative analysis of the market segments, current trends, estimations, and dynamics of the peanut oil market analysis from 2022 to 2032 to identify the prevailing peanut oil market opportunities.
- The market research is offered along with information related to key drivers, restraints, and opportunities.
- Porter's five forces analysis highlights the potency of buyers and suppliers to enable stakeholders make profit-oriented business decisions and strengthen their supplier-buyer network.
- In-depth analysis of the peanut oil market segmentation assists to determine the prevailing market opportunities.
- Major countries in each region are mapped according to their revenue contribution to the global market.
- Market player positioning facilitates benchmarking and provides a clear understanding of the present position of the market players.
- The report includes the analysis of the regional as well as global peanut oil market trends, key players, market segments, application areas, and market growth strategies.
Additional benefits you will get with this purchase are:
- Quarterly Update and* (only available with a corporate license, on listed price)
- 5 additional Company Profile of client Choice pre- or Post-purchase, as a free update.
- Free Upcoming Version on the Purchase of Five and Enterprise User License.
- 16 analyst hours of support* (post-purchase, if you find additional data requirements upon review of the report, you may receive support amounting to 16 analyst hours to solve questions, and post-sale queries)
- 15% Free Customization* (in case the scope or segment of the report does not match your requirements, 15% is equivalent to 3 working days of free work, applicable once)
- Free data Pack on the Five and Enterprise User License. (Excel version of the report)
- Free Updated report if the report is 6-12 months old or older.
- 24-hour priority response*
- Free Industry updates and white papers.
Possible Customization with this report (with additional cost and timeline, please talk to the sales executive to know more)
- Consumer Buying Behavior Analysis
- Investment Opportunities
- Product Life Cycles
- Supply Chain Analysis & Vendor Margins
- Average Consumer Expenditure
- Distributor margin Analysis
- Market share analysis of players by products/segments
- New Product Development/ Product Matrix of Key Players
- Regulatory Guidelines
- Strategic Recommedations
- Additional company profiles with specific to client's interest
- Additional country or region analysis- market size and forecast
- Brands Share Analysis
- Expanded list for Company Profiles
- Historic market data
- Import Export Analysis/Data
- Key player details (including location, contact details, supplier/vendor network etc. in excel format)
- List of customers/consumers/raw material suppliers- value chain analysis
- Market share analysis of players at global/region/country level
- Per Capita Consumption Trends
- Product Consumption Analysis
- SWOT Analysis
- Volume Market Size and Forecast
Key Market Segments
By Type
- Refined
- Unrefined
By Application
- Cosmetics
- Food
- Pharmaceuticals
- Others
By Distribution Channel
- Hypermarket/Supermarket
- Independent Retail Stores
- Business To Business
- Online Sales Channels
By Region
- North America
- U.S.
- Canada
- Mexico
- Europe
- Germany
- UK
- France
- Italy
- Russia
- Rest of Europe
- Asia-Pacific
- China
- India
- Japan
- South Korea
- Australia
- Rest of Asia-Pacific
- Latin America
- Brazil
- Colombia
- Argentina
- Rest of Latin America
- Middle East and Africa
- Gcc
- South Africa
- Rest of Middle East And Africa
Key Market Players:
- Olam International
- CHS Inc.
- Cargill, Incorporated
- Wilmar International Limited.
- Archer Daniels Midland Company
- Patanjali Ayurvedic Limited Incorporated
- Mother Dairy
- Hain Celestial Group, Inc.
- Bettcher Industries, Inc.
- COFCO Corporation
TABLE OF CONTENTS
CHAPTER 1: INTRODUCTION
- 1.1. Report description
- 1.2. Key market segments
- 1.3. Key benefits to the stakeholders
- 1.4. Research methodology
- 1.4.1. Primary research
- 1.4.2. Secondary research
- 1.4.3. Analyst tools and models
CHAPTER 2: EXECUTIVE SUMMARY
- 2.1. CXO Perspective
CHAPTER 3: MARKET OVERVIEW
- 3.1. Market definition and scope
- 3.2. Key findings
- 3.2.1. Top impacting factors
- 3.2.2. Top investment pockets
- 3.3. Porter's five forces analysis
- 3.4. Market dynamics
- 3.4.1. Drivers
- 3.4.2. Restraints
- 3.4.3. Opportunities
CHAPTER 4: PEANUT OIL MARKET, BY TYPE
- 4.1. Overview
- 4.1.1. Market size and forecast
- 4.2. Refined
- 4.2.1. Key market trends, growth factors and opportunities
- 4.2.2. Market size and forecast, by region
- 4.2.3. Market share analysis by country
- 4.3. Unrefined
- 4.3.1. Key market trends, growth factors and opportunities
- 4.3.2. Market size and forecast, by region
- 4.3.3. Market share analysis by country
CHAPTER 5: PEANUT OIL MARKET, BY APPLICATION
- 5.1. Overview
- 5.1.1. Market size and forecast
- 5.2. Cosmetics
- 5.2.1. Key market trends, growth factors and opportunities
- 5.2.2. Market size and forecast, by region
- 5.2.3. Market share analysis by country
- 5.3. Food
- 5.3.1. Key market trends, growth factors and opportunities
- 5.3.2. Market size and forecast, by region
- 5.3.3. Market share analysis by country
- 5.4. Pharmaceuticals
- 5.4.1. Key market trends, growth factors and opportunities
- 5.4.2. Market size and forecast, by region
- 5.4.3. Market share analysis by country
- 5.5. Others
- 5.5.1. Key market trends, growth factors and opportunities
- 5.5.2. Market size and forecast, by region
- 5.5.3. Market share analysis by country
CHAPTER 6: PEANUT OIL MARKET, BY DISTRIBUTION CHANNEL
- 6.1. Overview
- 6.1.1. Market size and forecast
- 6.2. Hypermarket/Supermarket
- 6.2.1. Key market trends, growth factors and opportunities
- 6.2.2. Market size and forecast, by region
- 6.2.3. Market share analysis by country
- 6.3. Independent Retail Stores
- 6.3.1. Key market trends, growth factors and opportunities
- 6.3.2. Market size and forecast, by region
- 6.3.3. Market share analysis by country
- 6.4. Business To Business
- 6.4.1. Key market trends, growth factors and opportunities
- 6.4.2. Market size and forecast, by region
- 6.4.3. Market share analysis by country
- 6.5. Online Sales Channels
- 6.5.1. Key market trends, growth factors and opportunities
- 6.5.2. Market size and forecast, by region
- 6.5.3. Market share analysis by country
CHAPTER 7: PEANUT OIL MARKET, BY REGION
- 7.1. Overview
- 7.1.1. Market size and forecast By Region
- 7.2. North America
- 7.2.1. Key market trends, growth factors and opportunities
- 7.2.2. Market size and forecast, by Type
- 7.2.3. Market size and forecast, by Application
- 7.2.4. Market size and forecast, by Distribution Channel
- 7.2.5. Market size and forecast, by country
- 7.2.5.1. U.S.
- 7.2.5.1.1. Market size and forecast, by Type
- 7.2.5.1.2. Market size and forecast, by Application
- 7.2.5.1.3. Market size and forecast, by Distribution Channel
- 7.2.5.2. Canada
- 7.2.5.2.1. Market size and forecast, by Type
- 7.2.5.2.2. Market size and forecast, by Application
- 7.2.5.2.3. Market size and forecast, by Distribution Channel
- 7.2.5.3. Mexico
- 7.2.5.3.1. Market size and forecast, by Type
- 7.2.5.3.2. Market size and forecast, by Application
- 7.2.5.3.3. Market size and forecast, by Distribution Channel
- 7.3. Europe
- 7.3.1. Key market trends, growth factors and opportunities
- 7.3.2. Market size and forecast, by Type
- 7.3.3. Market size and forecast, by Application
- 7.3.4. Market size and forecast, by Distribution Channel
- 7.3.5. Market size and forecast, by country
- 7.3.5.1. Germany
- 7.3.5.1.1. Market size and forecast, by Type
- 7.3.5.1.2. Market size and forecast, by Application
- 7.3.5.1.3. Market size and forecast, by Distribution Channel
- 7.3.5.2. UK
- 7.3.5.2.1. Market size and forecast, by Type
- 7.3.5.2.2. Market size and forecast, by Application
- 7.3.5.2.3. Market size and forecast, by Distribution Channel
- 7.3.5.3. France
- 7.3.5.3.1. Market size and forecast, by Type
- 7.3.5.3.2. Market size and forecast, by Application
- 7.3.5.3.3. Market size and forecast, by Distribution Channel
- 7.3.5.4. Italy
- 7.3.5.4.1. Market size and forecast, by Type
- 7.3.5.4.2. Market size and forecast, by Application
- 7.3.5.4.3. Market size and forecast, by Distribution Channel
- 7.3.5.5. Russia
- 7.3.5.5.1. Market size and forecast, by Type
- 7.3.5.5.2. Market size and forecast, by Application
- 7.3.5.5.3. Market size and forecast, by Distribution Channel
- 7.3.5.6. Rest of Europe
- 7.3.5.6.1. Market size and forecast, by Type
- 7.3.5.6.2. Market size and forecast, by Application
- 7.3.5.6.3. Market size and forecast, by Distribution Channel
- 7.4. Asia-Pacific
- 7.4.1. Key market trends, growth factors and opportunities
- 7.4.2. Market size and forecast, by Type
- 7.4.3. Market size and forecast, by Application
- 7.4.4. Market size and forecast, by Distribution Channel
- 7.4.5. Market size and forecast, by country
- 7.4.5.1. China
- 7.4.5.1.1. Market size and forecast, by Type
- 7.4.5.1.2. Market size and forecast, by Application
- 7.4.5.1.3. Market size and forecast, by Distribution Channel
- 7.4.5.2. India
- 7.4.5.2.1. Market size and forecast, by Type
- 7.4.5.2.2. Market size and forecast, by Application
- 7.4.5.2.3. Market size and forecast, by Distribution Channel
- 7.4.5.3. Japan
- 7.4.5.3.1. Market size and forecast, by Type
- 7.4.5.3.2. Market size and forecast, by Application
- 7.4.5.3.3. Market size and forecast, by Distribution Channel
- 7.4.5.4. South Korea
- 7.4.5.4.1. Market size and forecast, by Type
- 7.4.5.4.2. Market size and forecast, by Application
- 7.4.5.4.3. Market size and forecast, by Distribution Channel
- 7.4.5.5. Australia
- 7.4.5.5.1. Market size and forecast, by Type
- 7.4.5.5.2. Market size and forecast, by Application
- 7.4.5.5.3. Market size and forecast, by Distribution Channel
- 7.4.5.6. Rest of Asia-Pacific
- 7.4.5.6.1. Market size and forecast, by Type
- 7.4.5.6.2. Market size and forecast, by Application
- 7.4.5.6.3. Market size and forecast, by Distribution Channel
- 7.5. Latin America
- 7.5.1. Key market trends, growth factors and opportunities
- 7.5.2. Market size and forecast, by Type
- 7.5.3. Market size and forecast, by Application
- 7.5.4. Market size and forecast, by Distribution Channel
- 7.5.5. Market size and forecast, by country
- 7.5.5.1. Brazil
- 7.5.5.1.1. Market size and forecast, by Type
- 7.5.5.1.2. Market size and forecast, by Application
- 7.5.5.1.3. Market size and forecast, by Distribution Channel
- 7.5.5.2. Colombia
- 7.5.5.2.1. Market size and forecast, by Type
- 7.5.5.2.2. Market size and forecast, by Application
- 7.5.5.2.3. Market size and forecast, by Distribution Channel
- 7.5.5.3. Argentina
- 7.5.5.3.1. Market size and forecast, by Type
- 7.5.5.3.2. Market size and forecast, by Application
- 7.5.5.3.3. Market size and forecast, by Distribution Channel
- 7.5.5.4. Rest of Latin America
- 7.5.5.4.1. Market size and forecast, by Type
- 7.5.5.4.2. Market size and forecast, by Application
- 7.5.5.4.3. Market size and forecast, by Distribution Channel
- 7.6. Middle East and Africa
- 7.6.1. Key market trends, growth factors and opportunities
- 7.6.2. Market size and forecast, by Type
- 7.6.3. Market size and forecast, by Application
- 7.6.4. Market size and forecast, by Distribution Channel
- 7.6.5. Market size and forecast, by country
- 7.6.5.1. Gcc
- 7.6.5.1.1. Market size and forecast, by Type
- 7.6.5.1.2. Market size and forecast, by Application
- 7.6.5.1.3. Market size and forecast, by Distribution Channel
- 7.6.5.2. South Africa
- 7.6.5.2.1. Market size and forecast, by Type
- 7.6.5.2.2. Market size and forecast, by Application
- 7.6.5.2.3. Market size and forecast, by Distribution Channel
- 7.6.5.3. Rest of Middle East And Africa
- 7.6.5.3.1. Market size and forecast, by Type
- 7.6.5.3.2. Market size and forecast, by Application
- 7.6.5.3.3. Market size and forecast, by Distribution Channel
CHAPTER 8: COMPETITIVE LANDSCAPE
- 8.1. Introduction
- 8.2. Top winning strategies
- 8.3. Product mapping of top 10 player
- 8.4. Competitive dashboard
- 8.5. Competitive heatmap
- 8.6. Top player positioning, 2022
CHAPTER 9: COMPANY PROFILES
- 9.1. Olam International
- 9.1.1. Company overview
- 9.1.2. Key executives
- 9.1.3. Company snapshot
- 9.1.4. Operating business segments
- 9.1.5. Product portfolio
- 9.1.6. Business performance
- 9.1.7. Key strategic moves and developments
- 9.2. CHS Inc.
- 9.2.1. Company overview
- 9.2.2. Key executives
- 9.2.3. Company snapshot
- 9.2.4. Operating business segments
- 9.2.5. Product portfolio
- 9.2.6. Business performance
- 9.2.7. Key strategic moves and developments
- 9.3. Cargill, Incorporated
- 9.3.1. Company overview
- 9.3.2. Key executives
- 9.3.3. Company snapshot
- 9.3.4. Operating business segments
- 9.3.5. Product portfolio
- 9.3.6. Business performance
- 9.3.7. Key strategic moves and developments
- 9.4. Wilmar International Limited.
- 9.4.1. Company overview
- 9.4.2. Key executives
- 9.4.3. Company snapshot
- 9.4.4. Operating business segments
- 9.4.5. Product portfolio
- 9.4.6. Business performance
- 9.4.7. Key strategic moves and developments
- 9.5. Archer Daniels Midland Company
- 9.5.1. Company overview
- 9.5.2. Key executives
- 9.5.3. Company snapshot
- 9.5.4. Operating business segments
- 9.5.5. Product portfolio
- 9.5.6. Business performance
- 9.5.7. Key strategic moves and developments
- 9.6. Patanjali Ayurvedic Limited Incorporated
- 9.6.1. Company overview
- 9.6.2. Key executives
- 9.6.3. Company snapshot
- 9.6.4. Operating business segments
- 9.6.5. Product portfolio
- 9.6.6. Business performance
- 9.6.7. Key strategic moves and developments
- 9.7. Mother Dairy
- 9.7.1. Company overview
- 9.7.2. Key executives
- 9.7.3. Company snapshot
- 9.7.4. Operating business segments
- 9.7.5. Product portfolio
- 9.7.6. Business performance
- 9.7.7. Key strategic moves and developments
- 9.8. Hain Celestial Group, Inc.
- 9.8.1. Company overview
- 9.8.2. Key executives
- 9.8.3. Company snapshot
- 9.8.4. Operating business segments
- 9.8.5. Product portfolio
- 9.8.6. Business performance
- 9.8.7. Key strategic moves and developments
- 9.9. Bettcher Industries, Inc.
- 9.9.1. Company overview
- 9.9.2. Key executives
- 9.9.3. Company snapshot
- 9.9.4. Operating business segments
- 9.9.5. Product portfolio
- 9.9.6. Business performance
- 9.9.7. Key strategic moves and developments
- 9.10. COFCO Corporation
- 9.10.1. Company overview
- 9.10.2. Key executives
- 9.10.3. Company snapshot
- 9.10.4. Operating business segments
- 9.10.5. Product portfolio
- 9.10.6. Business performance
- 9.10.7. Key strategic moves and developments
LIST OF TABLES
- TABLE 01. GLOBAL PEANUT OIL MARKET, BY TYPE, 2022-2032 ($MILLION)
- TABLE 02. PEANUT OIL MARKET FOR REFINED, BY REGION, 2022-2032 ($MILLION)
- TABLE 03. PEANUT OIL MARKET FOR UNREFINED, BY REGION, 2022-2032 ($MILLION)
- TABLE 04. GLOBAL PEANUT OIL MARKET, BY APPLICATION, 2022-2032 ($MILLION)
- TABLE 05. PEANUT OIL MARKET FOR COSMETICS, BY REGION, 2022-2032 ($MILLION)
- TABLE 06. PEANUT OIL MARKET FOR FOOD, BY REGION, 2022-2032 ($MILLION)
- TABLE 07. PEANUT OIL MARKET FOR PHARMACEUTICALS, BY REGION, 2022-2032 ($MILLION)
- TABLE 08. PEANUT OIL MARKET FOR OTHERS, BY REGION, 2022-2032 ($MILLION)
- TABLE 09. GLOBAL PEANUT OIL MARKET, BY DISTRIBUTION CHANNEL, 2022-2032 ($MILLION)
- TABLE 10. PEANUT OIL MARKET FOR HYPERMARKET/SUPERMARKET, BY REGION, 2022-2032 ($MILLION)
- TABLE 11. PEANUT OIL MARKET FOR INDEPENDENT RETAIL STORES, BY REGION, 2022-2032 ($MILLION)
- TABLE 12. PEANUT OIL MARKET FOR BUSINESS TO BUSINESS, BY REGION, 2022-2032 ($MILLION)
- TABLE 13. PEANUT OIL MARKET FOR ONLINE SALES CHANNELS, BY REGION, 2022-2032 ($MILLION)
- TABLE 14. PEANUT OIL MARKET, BY REGION, 2022-2032 ($MILLION)
- TABLE 15. NORTH AMERICA PEANUT OIL MARKET, BY TYPE, 2022-2032 ($MILLION)
- TABLE 16. NORTH AMERICA PEANUT OIL MARKET, BY APPLICATION, 2022-2032 ($MILLION)
- TABLE 17. NORTH AMERICA PEANUT OIL MARKET, BY DISTRIBUTION CHANNEL, 2022-2032 ($MILLION)
- TABLE 18. NORTH AMERICA PEANUT OIL MARKET, BY COUNTRY, 2022-2032 ($MILLION)
- TABLE 19. U.S. PEANUT OIL MARKET, BY TYPE, 2022-2032 ($MILLION)
- TABLE 20. U.S. PEANUT OIL MARKET, BY APPLICATION, 2022-2032 ($MILLION)
- TABLE 21. U.S. PEANUT OIL MARKET, BY DISTRIBUTION CHANNEL, 2022-2032 ($MILLION)
- TABLE 22. CANADA PEANUT OIL MARKET, BY TYPE, 2022-2032 ($MILLION)
- TABLE 23. CANADA PEANUT OIL MARKET, BY APPLICATION, 2022-2032 ($MILLION)
- TABLE 24. CANADA PEANUT OIL MARKET, BY DISTRIBUTION CHANNEL, 2022-2032 ($MILLION)
- TABLE 25. MEXICO PEANUT OIL MARKET, BY TYPE, 2022-2032 ($MILLION)
- TABLE 26. MEXICO PEANUT OIL MARKET, BY APPLICATION, 2022-2032 ($MILLION)
- TABLE 27. MEXICO PEANUT OIL MARKET, BY DISTRIBUTION CHANNEL, 2022-2032 ($MILLION)
- TABLE 28. EUROPE PEANUT OIL MARKET, BY TYPE, 2022-2032 ($MILLION)
- TABLE 29. EUROPE PEANUT OIL MARKET, BY APPLICATION, 2022-2032 ($MILLION)
- TABLE 30. EUROPE PEANUT OIL MARKET, BY DISTRIBUTION CHANNEL, 2022-2032 ($MILLION)
- TABLE 31. EUROPE PEANUT OIL MARKET, BY COUNTRY, 2022-2032 ($MILLION)
- TABLE 32. GERMANY PEANUT OIL MARKET, BY TYPE, 2022-2032 ($MILLION)
- TABLE 33. GERMANY PEANUT OIL MARKET, BY APPLICATION, 2022-2032 ($MILLION)
- TABLE 34. GERMANY PEANUT OIL MARKET, BY DISTRIBUTION CHANNEL, 2022-2032 ($MILLION)
- TABLE 35. UK PEANUT OIL MARKET, BY TYPE, 2022-2032 ($MILLION)
- TABLE 36. UK PEANUT OIL MARKET, BY APPLICATION, 2022-2032 ($MILLION)
- TABLE 37. UK PEANUT OIL MARKET, BY DISTRIBUTION CHANNEL, 2022-2032 ($MILLION)
- TABLE 38. FRANCE PEANUT OIL MARKET, BY TYPE, 2022-2032 ($MILLION)
- TABLE 39. FRANCE PEANUT OIL MARKET, BY APPLICATION, 2022-2032 ($MILLION)
- TABLE 40. FRANCE PEANUT OIL MARKET, BY DISTRIBUTION CHANNEL, 2022-2032 ($MILLION)
- TABLE 41. ITALY PEANUT OIL MARKET, BY TYPE, 2022-2032 ($MILLION)
- TABLE 42. ITALY PEANUT OIL MARKET, BY APPLICATION, 2022-2032 ($MILLION)
- TABLE 43. ITALY PEANUT OIL MARKET, BY DISTRIBUTION CHANNEL, 2022-2032 ($MILLION)
- TABLE 44. RUSSIA PEANUT OIL MARKET, BY TYPE, 2022-2032 ($MILLION)
- TABLE 45. RUSSIA PEANUT OIL MARKET, BY APPLICATION, 2022-2032 ($MILLION)
- TABLE 46. RUSSIA PEANUT OIL MARKET, BY DISTRIBUTION CHANNEL, 2022-2032 ($MILLION)
- TABLE 47. REST OF EUROPE PEANUT OIL MARKET, BY TYPE, 2022-2032 ($MILLION)
- TABLE 48. REST OF EUROPE PEANUT OIL MARKET, BY APPLICATION, 2022-2032 ($MILLION)
- TABLE 49. REST OF EUROPE PEANUT OIL MARKET, BY DISTRIBUTION CHANNEL, 2022-2032 ($MILLION)
- TABLE 50. ASIA-PACIFIC PEANUT OIL MARKET, BY TYPE, 2022-2032 ($MILLION)
- TABLE 51. ASIA-PACIFIC PEANUT OIL MARKET, BY APPLICATION, 2022-2032 ($MILLION)
- TABLE 52. ASIA-PACIFIC PEANUT OIL MARKET, BY DISTRIBUTION CHANNEL, 2022-2032 ($MILLION)
- TABLE 53. ASIA-PACIFIC PEANUT OIL MARKET, BY COUNTRY, 2022-2032 ($MILLION)
- TABLE 54. CHINA PEANUT OIL MARKET, BY TYPE, 2022-2032 ($MILLION)
- TABLE 55. CHINA PEANUT OIL MARKET, BY APPLICATION, 2022-2032 ($MILLION)
- TABLE 56. CHINA PEANUT OIL MARKET, BY DISTRIBUTION CHANNEL, 2022-2032 ($MILLION)
- TABLE 57. INDIA PEANUT OIL MARKET, BY TYPE, 2022-2032 ($MILLION)
- TABLE 58. INDIA PEANUT OIL MARKET, BY APPLICATION, 2022-2032 ($MILLION)
- TABLE 59. INDIA PEANUT OIL MARKET, BY DISTRIBUTION CHANNEL, 2022-2032 ($MILLION)
- TABLE 60. JAPAN PEANUT OIL MARKET, BY TYPE, 2022-2032 ($MILLION)
- TABLE 61. JAPAN PEANUT OIL MARKET, BY APPLICATION, 2022-2032 ($MILLION)
- TABLE 62. JAPAN PEANUT OIL MARKET, BY DISTRIBUTION CHANNEL, 2022-2032 ($MILLION)
- TABLE 63. SOUTH KOREA PEANUT OIL MARKET, BY TYPE, 2022-2032 ($MILLION)
- TABLE 64. SOUTH KOREA PEANUT OIL MARKET, BY APPLICATION, 2022-2032 ($MILLION)
- TABLE 65. SOUTH KOREA PEANUT OIL MARKET, BY DISTRIBUTION CHANNEL, 2022-2032 ($MILLION)
- TABLE 66. AUSTRALIA PEANUT OIL MARKET, BY TYPE, 2022-2032 ($MILLION)
- TABLE 67. AUSTRALIA PEANUT OIL MARKET, BY APPLICATION, 2022-2032 ($MILLION)
- TABLE 68. AUSTRALIA PEANUT OIL MARKET, BY DISTRIBUTION CHANNEL, 2022-2032 ($MILLION)
- TABLE 69. REST OF ASIA-PACIFIC PEANUT OIL MARKET, BY TYPE, 2022-2032 ($MILLION)
- TABLE 70. REST OF ASIA-PACIFIC PEANUT OIL MARKET, BY APPLICATION, 2022-2032 ($MILLION)
- TABLE 71. REST OF ASIA-PACIFIC PEANUT OIL MARKET, BY DISTRIBUTION CHANNEL, 2022-2032 ($MILLION)
- TABLE 72. LATIN AMERICA PEANUT OIL MARKET, BY TYPE, 2022-2032 ($MILLION)
- TABLE 73. LATIN AMERICA PEANUT OIL MARKET, BY APPLICATION, 2022-2032 ($MILLION)
- TABLE 74. LATIN AMERICA PEANUT OIL MARKET, BY DISTRIBUTION CHANNEL, 2022-2032 ($MILLION)
- TABLE 75. LATIN AMERICA PEANUT OIL MARKET, BY COUNTRY, 2022-2032 ($MILLION)
- TABLE 76. BRAZIL PEANUT OIL MARKET, BY TYPE, 2022-2032 ($MILLION)
- TABLE 77. BRAZIL PEANUT OIL MARKET, BY APPLICATION, 2022-2032 ($MILLION)
- TABLE 78. BRAZIL PEANUT OIL MARKET, BY DISTRIBUTION CHANNEL, 2022-2032 ($MILLION)
- TABLE 79. COLOMBIA PEANUT OIL MARKET, BY TYPE, 2022-2032 ($MILLION)
- TABLE 80. COLOMBIA PEANUT OIL MARKET, BY APPLICATION, 2022-2032 ($MILLION)
- TABLE 81. COLOMBIA PEANUT OIL MARKET, BY DISTRIBUTION CHANNEL, 2022-2032 ($MILLION)
- TABLE 82. ARGENTINA PEANUT OIL MARKET, BY TYPE, 2022-2032 ($MILLION)
- TABLE 83. ARGENTINA PEANUT OIL MARKET, BY APPLICATION, 2022-2032 ($MILLION)
- TABLE 84. ARGENTINA PEANUT OIL MARKET, BY DISTRIBUTION CHANNEL, 2022-2032 ($MILLION)
- TABLE 85. REST OF LATIN AMERICA PEANUT OIL MARKET, BY TYPE, 2022-2032 ($MILLION)
- TABLE 86. REST OF LATIN AMERICA PEANUT OIL MARKET, BY APPLICATION, 2022-2032 ($MILLION)
- TABLE 87. REST OF LATIN AMERICA PEANUT OIL MARKET, BY DISTRIBUTION CHANNEL, 2022-2032 ($MILLION)
- TABLE 88. MIDDLE EAST AND AFRICA PEANUT OIL MARKET, BY TYPE, 2022-2032 ($MILLION)
- TABLE 89. MIDDLE EAST AND AFRICA PEANUT OIL MARKET, BY APPLICATION, 2022-2032 ($MILLION)
- TABLE 90. MIDDLE EAST AND AFRICA PEANUT OIL MARKET, BY DISTRIBUTION CHANNEL, 2022-2032 ($MILLION)
- TABLE 91. MIDDLE EAST AND AFRICA PEANUT OIL MARKET, BY COUNTRY, 2022-2032 ($MILLION)
- TABLE 92. GCC PEANUT OIL MARKET, BY TYPE, 2022-2032 ($MILLION)
- TABLE 93. GCC PEANUT OIL MARKET, BY APPLICATION, 2022-2032 ($MILLION)
- TABLE 94. GCC PEANUT OIL MARKET, BY DISTRIBUTION CHANNEL, 2022-2032 ($MILLION)
- TABLE 95. SOUTH AFRICA PEANUT OIL MARKET, BY TYPE, 2022-2032 ($MILLION)
- TABLE 96. SOUTH AFRICA PEANUT OIL MARKET, BY APPLICATION, 2022-2032 ($MILLION)
- TABLE 97. SOUTH AFRICA PEANUT OIL MARKET, BY DISTRIBUTION CHANNEL, 2022-2032 ($MILLION)
- TABLE 98. REST OF MIDDLE EAST AND AFRICA PEANUT OIL MARKET, BY TYPE, 2022-2032 ($MILLION)
- TABLE 99. REST OF MIDDLE EAST AND AFRICA PEANUT OIL MARKET, BY APPLICATION, 2022-2032 ($MILLION)
- TABLE 100. REST OF MIDDLE EAST AND AFRICA PEANUT OIL MARKET, BY DISTRIBUTION CHANNEL, 2022-2032 ($MILLION)
- TABLE 101. OLAM INTERNATIONAL: KEY EXECUTIVES
- TABLE 102. OLAM INTERNATIONAL: COMPANY SNAPSHOT
- TABLE 103. OLAM INTERNATIONAL: PRODUCT SEGMENTS
- TABLE 104. OLAM INTERNATIONAL: SERVICE SEGMENTS
- TABLE 105. OLAM INTERNATIONAL: PRODUCT PORTFOLIO
- TABLE 106. OLAM INTERNATIONAL: KEY STRATERGIES
- TABLE 107. CHS INC.: KEY EXECUTIVES
- TABLE 108. CHS INC.: COMPANY SNAPSHOT
- TABLE 109. CHS INC.: PRODUCT SEGMENTS
- TABLE 110. CHS INC.: SERVICE SEGMENTS
- TABLE 111. CHS INC.: PRODUCT PORTFOLIO
- TABLE 112. CHS INC.: KEY STRATERGIES
- TABLE 113. CARGILL, INCORPORATED: KEY EXECUTIVES
- TABLE 114. CARGILL, INCORPORATED: COMPANY SNAPSHOT
- TABLE 115. CARGILL, INCORPORATED: PRODUCT SEGMENTS
- TABLE 116. CARGILL, INCORPORATED: SERVICE SEGMENTS
- TABLE 117. CARGILL, INCORPORATED: PRODUCT PORTFOLIO
- TABLE 118. CARGILL, INCORPORATED: KEY STRATERGIES
- TABLE 119. WILMAR INTERNATIONAL LIMITED.: KEY EXECUTIVES
- TABLE 120. WILMAR INTERNATIONAL LIMITED.: COMPANY SNAPSHOT
- TABLE 121. WILMAR INTERNATIONAL LIMITED.: PRODUCT SEGMENTS
- TABLE 122. WILMAR INTERNATIONAL LIMITED.: SERVICE SEGMENTS
- TABLE 123. WILMAR INTERNATIONAL LIMITED.: PRODUCT PORTFOLIO
- TABLE 124. WILMAR INTERNATIONAL LIMITED.: KEY STRATERGIES
- TABLE 125. ARCHER DANIELS MIDLAND COMPANY: KEY EXECUTIVES
- TABLE 126. ARCHER DANIELS MIDLAND COMPANY: COMPANY SNAPSHOT
- TABLE 127. ARCHER DANIELS MIDLAND COMPANY: PRODUCT SEGMENTS
- TABLE 128. ARCHER DANIELS MIDLAND COMPANY: SERVICE SEGMENTS
- TABLE 129. ARCHER DANIELS MIDLAND COMPANY: PRODUCT PORTFOLIO
- TABLE 130. ARCHER DANIELS MIDLAND COMPANY: KEY STRATERGIES
- TABLE 131. PATANJALI AYURVEDIC LIMITED INCORPORATED: KEY EXECUTIVES
- TABLE 132. PATANJALI AYURVEDIC LIMITED INCORPORATED: COMPANY SNAPSHOT
- TABLE 133. PATANJALI AYURVEDIC LIMITED INCORPORATED: PRODUCT SEGMENTS
- TABLE 134. PATANJALI AYURVEDIC LIMITED INCORPORATED: SERVICE SEGMENTS
- TABLE 135. PATANJALI AYURVEDIC LIMITED INCORPORATED: PRODUCT PORTFOLIO
- TABLE 136. PATANJALI AYURVEDIC LIMITED INCORPORATED: KEY STRATERGIES
- TABLE 137. MOTHER DAIRY: KEY EXECUTIVES
- TABLE 138. MOTHER DAIRY: COMPANY SNAPSHOT
- TABLE 139. MOTHER DAIRY: PRODUCT SEGMENTS
- TABLE 140. MOTHER DAIRY: SERVICE SEGMENTS
- TABLE 141. MOTHER DAIRY: PRODUCT PORTFOLIO
- TABLE 142. MOTHER DAIRY: KEY STRATERGIES
- TABLE 143. HAIN CELESTIAL GROUP, INC.: KEY EXECUTIVES
- TABLE 144. HAIN CELESTIAL GROUP, INC.: COMPANY SNAPSHOT
- TABLE 145. HAIN CELESTIAL GROUP, INC.: PRODUCT SEGMENTS
- TABLE 146. HAIN CELESTIAL GROUP, INC.: SERVICE SEGMENTS
- TABLE 147. HAIN CELESTIAL GROUP, INC.: PRODUCT PORTFOLIO
- TABLE 148. HAIN CELESTIAL GROUP, INC.: KEY STRATERGIES
- TABLE 149. BETTCHER INDUSTRIES, INC.: KEY EXECUTIVES
- TABLE 150. BETTCHER INDUSTRIES, INC.: COMPANY SNAPSHOT
- TABLE 151. BETTCHER INDUSTRIES, INC.: PRODUCT SEGMENTS
- TABLE 152. BETTCHER INDUSTRIES, INC.: SERVICE SEGMENTS
- TABLE 153. BETTCHER INDUSTRIES, INC.: PRODUCT PORTFOLIO
- TABLE 154. BETTCHER INDUSTRIES, INC.: KEY STRATERGIES
- TABLE 155. COFCO CORPORATION: KEY EXECUTIVES
- TABLE 156. COFCO CORPORATION: COMPANY SNAPSHOT
- TABLE 157. COFCO CORPORATION: PRODUCT SEGMENTS
- TABLE 158. COFCO CORPORATION: SERVICE SEGMENTS
- TABLE 159. COFCO CORPORATION: PRODUCT PORTFOLIO
- TABLE 160. COFCO CORPORATION: KEY STRATERGIES
LIST OF FIGURES
- FIGURE 01. PEANUT OIL MARKET, 2022-2032
- FIGURE 02. SEGMENTATION OF PEANUT OIL MARKET,2022-2032
- FIGURE 03. TOP IMPACTING FACTORS IN PEANUT OIL MARKET
- FIGURE 04. TOP INVESTMENT POCKETS IN PEANUT OIL MARKET (2023-2032)
- FIGURE 05. BARGAINING POWER OF SUPPLIERS
- FIGURE 06. BARGAINING POWER OF BUYERS
- FIGURE 07. THREAT OF SUBSTITUTION
- FIGURE 08. THREAT OF SUBSTITUTION
- FIGURE 09. COMPETITIVE RIVALRY
- FIGURE 10. GLOBAL PEANUT OIL MARKET:DRIVERS, RESTRAINTS AND OPPORTUNITIES
- FIGURE 11. PEANUT OIL MARKET, BY TYPE, 2022 AND 2032(%)
- FIGURE 12. COMPARATIVE SHARE ANALYSIS OF PEANUT OIL MARKET FOR REFINED, BY COUNTRY 2022 AND 2032(%)
- FIGURE 13. COMPARATIVE SHARE ANALYSIS OF PEANUT OIL MARKET FOR UNREFINED, BY COUNTRY 2022 AND 2032(%)
- FIGURE 14. PEANUT OIL MARKET, BY APPLICATION, 2022 AND 2032(%)
- FIGURE 15. COMPARATIVE SHARE ANALYSIS OF PEANUT OIL MARKET FOR COSMETICS, BY COUNTRY 2022 AND 2032(%)
- FIGURE 16. COMPARATIVE SHARE ANALYSIS OF PEANUT OIL MARKET FOR FOOD, BY COUNTRY 2022 AND 2032(%)
- FIGURE 17. COMPARATIVE SHARE ANALYSIS OF PEANUT OIL MARKET FOR PHARMACEUTICALS, BY COUNTRY 2022 AND 2032(%)
- FIGURE 18. COMPARATIVE SHARE ANALYSIS OF PEANUT OIL MARKET FOR OTHERS, BY COUNTRY 2022 AND 2032(%)
- FIGURE 19. PEANUT OIL MARKET, BY DISTRIBUTION CHANNEL, 2022 AND 2032(%)
- FIGURE 20. COMPARATIVE SHARE ANALYSIS OF PEANUT OIL MARKET FOR HYPERMARKET/SUPERMARKET, BY COUNTRY 2022 AND 2032(%)
- FIGURE 21. COMPARATIVE SHARE ANALYSIS OF PEANUT OIL MARKET FOR INDEPENDENT RETAIL STORES, BY COUNTRY 2022 AND 2032(%)
- FIGURE 22. COMPARATIVE SHARE ANALYSIS OF PEANUT OIL MARKET FOR BUSINESS TO BUSINESS, BY COUNTRY 2022 AND 2032(%)
- FIGURE 23. COMPARATIVE SHARE ANALYSIS OF PEANUT OIL MARKET FOR ONLINE SALES CHANNELS, BY COUNTRY 2022 AND 2032(%)
- FIGURE 24. PEANUT OIL MARKET BY REGION, 2022 AND 2032(%)
- FIGURE 25. U.S. PEANUT OIL MARKET, 2022-2032 ($MILLION)
- FIGURE 26. CANADA PEANUT OIL MARKET, 2022-2032 ($MILLION)
- FIGURE 27. MEXICO PEANUT OIL MARKET, 2022-2032 ($MILLION)
- FIGURE 28. GERMANY PEANUT OIL MARKET, 2022-2032 ($MILLION)
- FIGURE 29. UK PEANUT OIL MARKET, 2022-2032 ($MILLION)
- FIGURE 30. FRANCE PEANUT OIL MARKET, 2022-2032 ($MILLION)
- FIGURE 31. ITALY PEANUT OIL MARKET, 2022-2032 ($MILLION)
- FIGURE 32. RUSSIA PEANUT OIL MARKET, 2022-2032 ($MILLION)
- FIGURE 33. REST OF EUROPE PEANUT OIL MARKET, 2022-2032 ($MILLION)
- FIGURE 34. CHINA PEANUT OIL MARKET, 2022-2032 ($MILLION)
- FIGURE 35. INDIA PEANUT OIL MARKET, 2022-2032 ($MILLION)
- FIGURE 36. JAPAN PEANUT OIL MARKET, 2022-2032 ($MILLION)
- FIGURE 37. SOUTH KOREA PEANUT OIL MARKET, 2022-2032 ($MILLION)
- FIGURE 38. AUSTRALIA PEANUT OIL MARKET, 2022-2032 ($MILLION)
- FIGURE 39. REST OF ASIA-PACIFIC PEANUT OIL MARKET, 2022-2032 ($MILLION)
- FIGURE 40. BRAZIL PEANUT OIL MARKET, 2022-2032 ($MILLION)
- FIGURE 41. COLOMBIA PEANUT OIL MARKET, 2022-2032 ($MILLION)
- FIGURE 42. ARGENTINA PEANUT OIL MARKET, 2022-2032 ($MILLION)
- FIGURE 43. REST OF LATIN AMERICA PEANUT OIL MARKET, 2022-2032 ($MILLION)
- FIGURE 44. GCC PEANUT OIL MARKET, 2022-2032 ($MILLION)
- FIGURE 45. SOUTH AFRICA PEANUT OIL MARKET, 2022-2032 ($MILLION)
- FIGURE 46. REST OF MIDDLE EAST AND AFRICA PEANUT OIL MARKET, 2022-2032 ($MILLION)
- FIGURE 47. TOP WINNING STRATEGIES, BY YEAR
- FIGURE 48. TOP WINNING STRATEGIES, BY DEVELOPMENT
- FIGURE 49. TOP WINNING STRATEGIES, BY COMPANY
- FIGURE 50. PRODUCT MAPPING OF TOP 10 PLAYERS
- FIGURE 51. COMPETITIVE DASHBOARD
- FIGURE 52. COMPETITIVE HEATMAP: PEANUT OIL MARKET
- FIGURE 53. TOP PLAYER POSITIONING, 2022

