
PUBLISHER: Allied Market Research | PRODUCT CODE: 1446425

PUBLISHER: Allied Market Research | PRODUCT CODE: 1446425
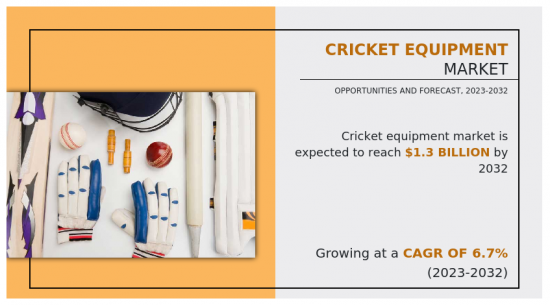
Cricket Equipment Market By Type, By Price Point, By Distribution Channel : Global Opportunity Analysis and Industry Forecast, 2023-2032
Cricket equipment refers to the specialized gear and accessories that cricket players utilize. This equipment is intended for maintaining the safety, efficiency, and comfort of players during games. Cricket equipment consists of four main components: the bat, ball, wickets, and protective gear. Batsmen, wicketkeepers, and fielders wear protective gear like as helmets, gloves, leg pads, and chest protectors to reduce the danger of damage caused by quick deliveries or irregular bounces.
The spike in player sponsorship has emerged as a major driving element behind the cricket equipment market's rapid expansion. Cricket continues to fascinate a global audience, and players have become prominent celebrities with a significant effect on consumer tastes. Major cricketers endorsing certain brands and equipment not only increases market awareness for such items but also establishes a clear relationship between the player's talent and the perceived excellence of the sponsored gear. Consumers who are motivated by their favorite cricketers are more likely to invest in equipment that has been approved by notable players. This tendency is especially noticeable in the cricket world, where players are frequently viewed as role models, and their clothing choices are intensely scrutinized by supporters. Manufacturers intentionally associate themselves with cricket players, hiring them as brand ambassadors to capitalize on their popularity. The resultant endorsements are effective marketing tools, influencing purchase decisions and increasing brand loyalty among customers. As a result, the rise in player endorsements not only raises the awareness of cricket equipment but it also greatly adds to the expansion and vitality of the cricket equipment market, resulting in a symbiotic connection between athletic heroes and industry.
Regulatory constraints have emerged as a major impediment to the expansion of the cricket equipment industry. Compliance with safety requirements, quality laws, and changing industry norms creates a difficult picture for manufacturers and suppliers. Stringent laws controlling manufacturing methods, materials, and safety requirements for cricket equipment, such as helmets and protective gear, can have a considerable influence on manufacturers' production and marketing tactics. Adherence to these rules frequently entails stringent testing processes, certification requirements, and ongoing monitoring to verify that items fulfil the required standards. This might result in higher manufacturing costs and longer time-to-market, compromising the industry's responsiveness and competitiveness. Furthermore, the variety of regulatory regimes among regions and nations adds another degree of complexity, forcing businesses to traverse a sophisticated and changing compliance landscape. Collaboration among industry stakeholders, regulatory agencies, and standardization organizations is critical in tackling these difficulties, ensuring that safety requirements are satisfied without limiting innovation. Overcoming regulatory barriers allows the cricket equipment sector to streamline procedures, improve product quality, and boost customer trust in the safety and dependability of cricket gear.
The cricket equipment market is segmented into product type, price point, and distribution channel. Depending on product type, the market is segregated into bats, balls, protective gear, and others. On the basis of price point, it is fragmented into economical, medium, and high. By distribution channel, it is categorized into hypermarkets/supermarkets, sports retail stores, branded outlets, and others. On the basis of region, the market is divided into North America, Europe, Asia-Pacific, Latin America, and Middle East & Africa.
Players operating in the cricket equipment market have adopted various developmental strategies to expand their cricket equipment market share, increase profitability, and remain competitive in the market. Key players profiled in this report include Gray-Nicolls, Kookaburra Sport Pty Ltd, Gunn & Moore (GM), Sareen Sports Industries, Adidas AG, New Balance Athletics, Inc, SG (Sanspareils Greenlands), British Cricket Balls Limited, Spartan Sports, Delux Sports Company, and Sommers Sports.
Key Benefits For Stakeholders
- This report provides a quantitative analysis of the market segments, current trends, estimations, and dynamics of the cricket equipment market analysis from 2022 to 2032 to identify the prevailing cricket equipment market opportunities.
- The market research is offered along with information related to key drivers, restraints, and opportunities.
- Porter's five forces analysis highlights the potency of buyers and suppliers to enable stakeholders make profit-oriented business decisions and strengthen their supplier-buyer network.
- In-depth analysis of the cricket equipment market segmentation assists to determine the prevailing market opportunities.
- Major countries in each region are mapped according to their revenue contribution to the global market.
- Market player positioning facilitates benchmarking and provides a clear understanding of the present position of the market players.
- The report includes the analysis of the regional as well as global cricket equipment market trends, key players, market segments, application areas, and market growth strategies.
Additional benefits you will get with this purchase are:
- Quarterly Update and* (only available with a corporate license, on listed price)
- 5 additional Company Profile of client Choice pre- or Post-purchase, as a free update.
- Free Upcoming Version on the Purchase of Five and Enterprise User License.
- 16 analyst hours of support* (post-purchase, if you find additional data requirements upon review of the report, you may receive support amounting to 16 analyst hours to solve questions, and post-sale queries)
- 15% Free Customization* (in case the scope or segment of the report does not match your requirements, 15% is equivalent to 3 working days of free work, applicable once)
- Free data Pack on the Five and Enterprise User License. (Excel version of the report)
- Free Updated report if the report is 6-12 months old or older.
- 24-hour priority response*
- Free Industry updates and white papers.
Possible Customization with this report (with additional cost and timeline, please talk to the sales executive to know more)
- Additional company profiles with specific to client's interest
- Additional country or region analysis- market size and forecast
- Criss-cross segment analysis- market size and forecast
- Expanded list for Company Profiles
- Historic market data
- SWOT Analysis
Key Market Segments
By Type
- Bats
- Balls
- Protective Gears
- Others
By Price Point
- High
- Economical
- Medium
By Distribution Channel
- Hypermarkets/Supermarkets
- Sports Retail Stores
- Branded Outlets
- Online Stores
- Others
By Region
- North America
- U.S.
- Canada
- Rest Of North America
- Europe
- UK
- Ireland
- Netherlands
- Germany
- Rest of Europe
- Asia-Pacific
- India
- Australia
- Pakistan
- New Zealand
- Sri Lanka
- Rest of Asia-Pacific
- Latin America
- Brazil
- Argentina
- Rest of Latin America
- Middle East and Africa
- South Africa
- Zimbabwe
- United Arab Emirates
- Rest of Middle East And Africa
Key Market Players:
- Gray-Nicolls
- Kookaburra
- Gunn & Moore (GM)
- Sareen Sports Industries (SS)
- Adidas
- Puma
- Sanspareils Greenlands (SG)
- Spartan Sports
- Slazenger
- Beat All Sports (BAS)
TABLE OF CONTENTS
CHAPTER 1: INTRODUCTION
- 1.1. Report description
- 1.2. Key market segments
- 1.3. Key benefits to the stakeholders
- 1.4. Research methodology
- 1.4.1. Primary research
- 1.4.2. Secondary research
- 1.4.3. Analyst tools and models
CHAPTER 2: EXECUTIVE SUMMARY
- 2.1. CXO Perspective
CHAPTER 3: MARKET OVERVIEW
- 3.1. Market definition and scope
- 3.2. Key findings
- 3.2.1. Top impacting factors
- 3.2.2. Top investment pockets
- 3.3. Porter's five forces analysis
- 3.4. Market dynamics
- 3.4.1. Drivers
- 3.4.2. Restraints
- 3.4.3. Opportunities
- 3.5. Pricing Analysis
CHAPTER 4: CRICKET EQUIPMENT MARKET, BY TYPE
- 4.1. Overview
- 4.1.1. Market size and forecast
- 4.2. Bats
- 4.2.1. Key market trends, growth factors and opportunities
- 4.2.2. Market size and forecast, by region
- 4.2.3. Market share analysis by country
- 4.3. Balls
- 4.3.1. Key market trends, growth factors and opportunities
- 4.3.2. Market size and forecast, by region
- 4.3.3. Market share analysis by country
- 4.4. Protective Gears
- 4.4.1. Key market trends, growth factors and opportunities
- 4.4.2. Market size and forecast, by region
- 4.4.3. Market share analysis by country
- 4.5. Others
- 4.5.1. Key market trends, growth factors and opportunities
- 4.5.2. Market size and forecast, by region
- 4.5.3. Market share analysis by country
CHAPTER 5: CRICKET EQUIPMENT MARKET, BY PRICE POINT
- 5.1. Overview
- 5.1.1. Market size and forecast
- 5.2. Economical
- 5.2.1. Key market trends, growth factors and opportunities
- 5.2.2. Market size and forecast, by region
- 5.2.3. Market share analysis by country
- 5.3. Medium
- 5.3.1. Key market trends, growth factors and opportunities
- 5.3.2. Market size and forecast, by region
- 5.3.3. Market share analysis by country
- 5.4. High
- 5.4.1. Key market trends, growth factors and opportunities
- 5.4.2. Market size and forecast, by region
- 5.4.3. Market share analysis by country
CHAPTER 6: CRICKET EQUIPMENT MARKET, BY DISTRIBUTION CHANNEL
- 6.1. Overview
- 6.1.1. Market size and forecast
- 6.2. Hypermarkets/Supermarkets
- 6.2.1. Key market trends, growth factors and opportunities
- 6.2.2. Market size and forecast, by region
- 6.2.3. Market share analysis by country
- 6.3. Sports Retail Stores
- 6.3.1. Key market trends, growth factors and opportunities
- 6.3.2. Market size and forecast, by region
- 6.3.3. Market share analysis by country
- 6.4. Branded Outlets
- 6.4.1. Key market trends, growth factors and opportunities
- 6.4.2. Market size and forecast, by region
- 6.4.3. Market share analysis by country
- 6.5. Online Stores
- 6.5.1. Key market trends, growth factors and opportunities
- 6.5.2. Market size and forecast, by region
- 6.5.3. Market share analysis by country
- 6.6. Others
- 6.6.1. Key market trends, growth factors and opportunities
- 6.6.2. Market size and forecast, by region
- 6.6.3. Market share analysis by country
CHAPTER 7: CRICKET EQUIPMENT MARKET, BY REGION
- 7.1. Overview
- 7.1.1. Market size and forecast By Region
- 7.2. North America
- 7.2.1. Key market trends, growth factors and opportunities
- 7.2.2. Market size and forecast, by Type
- 7.2.3. Market size and forecast, by Price Point
- 7.2.4. Market size and forecast, by Distribution Channel
- 7.2.5. Market size and forecast, by country
- 7.2.5.1. U.S.
- 7.2.5.1.1. Market size and forecast, by Type
- 7.2.5.1.2. Market size and forecast, by Price Point
- 7.2.5.1.3. Market size and forecast, by Distribution Channel
- 7.2.5.2. Canada
- 7.2.5.2.1. Market size and forecast, by Type
- 7.2.5.2.2. Market size and forecast, by Price Point
- 7.2.5.2.3. Market size and forecast, by Distribution Channel
- 7.2.5.3. Rest Of North America
- 7.2.5.3.1. Market size and forecast, by Type
- 7.2.5.3.2. Market size and forecast, by Price Point
- 7.2.5.3.3. Market size and forecast, by Distribution Channel
- 7.3. Europe
- 7.3.1. Key market trends, growth factors and opportunities
- 7.3.2. Market size and forecast, by Type
- 7.3.3. Market size and forecast, by Price Point
- 7.3.4. Market size and forecast, by Distribution Channel
- 7.3.5. Market size and forecast, by country
- 7.3.5.1. UK
- 7.3.5.1.1. Market size and forecast, by Type
- 7.3.5.1.2. Market size and forecast, by Price Point
- 7.3.5.1.3. Market size and forecast, by Distribution Channel
- 7.3.5.2. Ireland
- 7.3.5.2.1. Market size and forecast, by Type
- 7.3.5.2.2. Market size and forecast, by Price Point
- 7.3.5.2.3. Market size and forecast, by Distribution Channel
- 7.3.5.3. Netherlands
- 7.3.5.3.1. Market size and forecast, by Type
- 7.3.5.3.2. Market size and forecast, by Price Point
- 7.3.5.3.3. Market size and forecast, by Distribution Channel
- 7.3.5.4. Germany
- 7.3.5.4.1. Market size and forecast, by Type
- 7.3.5.4.2. Market size and forecast, by Price Point
- 7.3.5.4.3. Market size and forecast, by Distribution Channel
- 7.3.5.5. Rest of Europe
- 7.3.5.5.1. Market size and forecast, by Type
- 7.3.5.5.2. Market size and forecast, by Price Point
- 7.3.5.5.3. Market size and forecast, by Distribution Channel
- 7.4. Asia-Pacific
- 7.4.1. Key market trends, growth factors and opportunities
- 7.4.2. Market size and forecast, by Type
- 7.4.3. Market size and forecast, by Price Point
- 7.4.4. Market size and forecast, by Distribution Channel
- 7.4.5. Market size and forecast, by country
- 7.4.5.1. India
- 7.4.5.1.1. Market size and forecast, by Type
- 7.4.5.1.2. Market size and forecast, by Price Point
- 7.4.5.1.3. Market size and forecast, by Distribution Channel
- 7.4.5.2. Australia
- 7.4.5.2.1. Market size and forecast, by Type
- 7.4.5.2.2. Market size and forecast, by Price Point
- 7.4.5.2.3. Market size and forecast, by Distribution Channel
- 7.4.5.3. Pakistan
- 7.4.5.3.1. Market size and forecast, by Type
- 7.4.5.3.2. Market size and forecast, by Price Point
- 7.4.5.3.3. Market size and forecast, by Distribution Channel
- 7.4.5.4. New Zealand
- 7.4.5.4.1. Market size and forecast, by Type
- 7.4.5.4.2. Market size and forecast, by Price Point
- 7.4.5.4.3. Market size and forecast, by Distribution Channel
- 7.4.5.5. Sri Lanka
- 7.4.5.5.1. Market size and forecast, by Type
- 7.4.5.5.2. Market size and forecast, by Price Point
- 7.4.5.5.3. Market size and forecast, by Distribution Channel
- 7.4.5.6. Rest of Asia-Pacific
- 7.4.5.6.1. Market size and forecast, by Type
- 7.4.5.6.2. Market size and forecast, by Price Point
- 7.4.5.6.3. Market size and forecast, by Distribution Channel
- 7.5. Latin America
- 7.5.1. Key market trends, growth factors and opportunities
- 7.5.2. Market size and forecast, by Type
- 7.5.3. Market size and forecast, by Price Point
- 7.5.4. Market size and forecast, by Distribution Channel
- 7.5.5. Market size and forecast, by country
- 7.5.5.1. Brazil
- 7.5.5.1.1. Market size and forecast, by Type
- 7.5.5.1.2. Market size and forecast, by Price Point
- 7.5.5.1.3. Market size and forecast, by Distribution Channel
- 7.5.5.2. Argentina
- 7.5.5.2.1. Market size and forecast, by Type
- 7.5.5.2.2. Market size and forecast, by Price Point
- 7.5.5.2.3. Market size and forecast, by Distribution Channel
- 7.5.5.3. Rest of Latin America
- 7.5.5.3.1. Market size and forecast, by Type
- 7.5.5.3.2. Market size and forecast, by Price Point
- 7.5.5.3.3. Market size and forecast, by Distribution Channel
- 7.6. Middle East and Africa
- 7.6.1. Key market trends, growth factors and opportunities
- 7.6.2. Market size and forecast, by Type
- 7.6.3. Market size and forecast, by Price Point
- 7.6.4. Market size and forecast, by Distribution Channel
- 7.6.5. Market size and forecast, by country
- 7.6.5.1. South Africa
- 7.6.5.1.1. Market size and forecast, by Type
- 7.6.5.1.2. Market size and forecast, by Price Point
- 7.6.5.1.3. Market size and forecast, by Distribution Channel
- 7.6.5.2. Zimbabwe
- 7.6.5.2.1. Market size and forecast, by Type
- 7.6.5.2.2. Market size and forecast, by Price Point
- 7.6.5.2.3. Market size and forecast, by Distribution Channel
- 7.6.5.3. United Arab Emirates
- 7.6.5.3.1. Market size and forecast, by Type
- 7.6.5.3.2. Market size and forecast, by Price Point
- 7.6.5.3.3. Market size and forecast, by Distribution Channel
- 7.6.5.4. Rest of Middle East And Africa
- 7.6.5.4.1. Market size and forecast, by Type
- 7.6.5.4.2. Market size and forecast, by Price Point
- 7.6.5.4.3. Market size and forecast, by Distribution Channel
CHAPTER 8: COMPETITIVE LANDSCAPE
- 8.1. Introduction
- 8.2. Top winning strategies
- 8.3. Product mapping of top 10 player
- 8.4. Competitive dashboard
- 8.5. Competitive heatmap
- 8.6. Top player positioning, 2022
CHAPTER 9: COMPANY PROFILES
- 9.1. Gray-Nicolls
- 9.1.1. Company overview
- 9.1.2. Key executives
- 9.1.3. Company snapshot
- 9.1.4. Operating business segments
- 9.1.5. Product portfolio
- 9.1.6. Business performance
- 9.1.7. Key strategic moves and developments
- 9.2. Kookaburra
- 9.2.1. Company overview
- 9.2.2. Key executives
- 9.2.3. Company snapshot
- 9.2.4. Operating business segments
- 9.2.5. Product portfolio
- 9.2.6. Business performance
- 9.2.7. Key strategic moves and developments
- 9.3. Gunn & Moore (GM)
- 9.3.1. Company overview
- 9.3.2. Key executives
- 9.3.3. Company snapshot
- 9.3.4. Operating business segments
- 9.3.5. Product portfolio
- 9.3.6. Business performance
- 9.3.7. Key strategic moves and developments
- 9.4. Sareen Sports Industries (SS)
- 9.4.1. Company overview
- 9.4.2. Key executives
- 9.4.3. Company snapshot
- 9.4.4. Operating business segments
- 9.4.5. Product portfolio
- 9.4.6. Business performance
- 9.4.7. Key strategic moves and developments
- 9.5. Adidas
- 9.5.1. Company overview
- 9.5.2. Key executives
- 9.5.3. Company snapshot
- 9.5.4. Operating business segments
- 9.5.5. Product portfolio
- 9.5.6. Business performance
- 9.5.7. Key strategic moves and developments
- 9.6. Puma
- 9.6.1. Company overview
- 9.6.2. Key executives
- 9.6.3. Company snapshot
- 9.6.4. Operating business segments
- 9.6.5. Product portfolio
- 9.6.6. Business performance
- 9.6.7. Key strategic moves and developments
- 9.7. Sanspareils Greenlands (SG)
- 9.7.1. Company overview
- 9.7.2. Key executives
- 9.7.3. Company snapshot
- 9.7.4. Operating business segments
- 9.7.5. Product portfolio
- 9.7.6. Business performance
- 9.7.7. Key strategic moves and developments
- 9.8. Spartan Sports
- 9.8.1. Company overview
- 9.8.2. Key executives
- 9.8.3. Company snapshot
- 9.8.4. Operating business segments
- 9.8.5. Product portfolio
- 9.8.6. Business performance
- 9.8.7. Key strategic moves and developments
- 9.9. Slazenger
- 9.9.1. Company overview
- 9.9.2. Key executives
- 9.9.3. Company snapshot
- 9.9.4. Operating business segments
- 9.9.5. Product portfolio
- 9.9.6. Business performance
- 9.9.7. Key strategic moves and developments
- 9.10. Beat All Sports (BAS)
- 9.10.1. Company overview
- 9.10.2. Key executives
- 9.10.3. Company snapshot
- 9.10.4. Operating business segments
- 9.10.5. Product portfolio
- 9.10.6. Business performance
- 9.10.7. Key strategic moves and developments
LIST OF TABLES
- TABLE 01. GLOBAL CRICKET EQUIPMENT MARKET, BY TYPE, 2022-2032 ($MILLION)
- TABLE 02. CRICKET EQUIPMENT MARKET FOR BATS, BY REGION, 2022-2032 ($MILLION)
- TABLE 03. CRICKET EQUIPMENT MARKET FOR BALLS, BY REGION, 2022-2032 ($MILLION)
- TABLE 04. CRICKET EQUIPMENT MARKET FOR PROTECTIVE GEARS, BY REGION, 2022-2032 ($MILLION)
- TABLE 05. CRICKET EQUIPMENT MARKET FOR OTHERS, BY REGION, 2022-2032 ($MILLION)
- TABLE 06. GLOBAL CRICKET EQUIPMENT MARKET, BY PRICE POINT, 2022-2032 ($MILLION)
- TABLE 07. CRICKET EQUIPMENT MARKET FOR ECONOMICAL, BY REGION, 2022-2032 ($MILLION)
- TABLE 08. CRICKET EQUIPMENT MARKET FOR MEDIUM, BY REGION, 2022-2032 ($MILLION)
- TABLE 09. CRICKET EQUIPMENT MARKET FOR HIGH, BY REGION, 2022-2032 ($MILLION)
- TABLE 10. GLOBAL CRICKET EQUIPMENT MARKET, BY DISTRIBUTION CHANNEL, 2022-2032 ($MILLION)
- TABLE 11. CRICKET EQUIPMENT MARKET FOR HYPERMARKETS/SUPERMARKETS, BY REGION, 2022-2032 ($MILLION)
- TABLE 12. CRICKET EQUIPMENT MARKET FOR SPORTS RETAIL STORES, BY REGION, 2022-2032 ($MILLION)
- TABLE 13. CRICKET EQUIPMENT MARKET FOR BRANDED OUTLETS, BY REGION, 2022-2032 ($MILLION)
- TABLE 14. CRICKET EQUIPMENT MARKET FOR ONLINE STORES, BY REGION, 2022-2032 ($MILLION)
- TABLE 15. CRICKET EQUIPMENT MARKET FOR OTHERS, BY REGION, 2022-2032 ($MILLION)
- TABLE 16. CRICKET EQUIPMENT MARKET, BY REGION, 2022-2032 ($MILLION)
- TABLE 17. NORTH AMERICA CRICKET EQUIPMENT MARKET, BY TYPE, 2022-2032 ($MILLION)
- TABLE 18. NORTH AMERICA CRICKET EQUIPMENT MARKET, BY PRICE POINT, 2022-2032 ($MILLION)
- TABLE 19. NORTH AMERICA CRICKET EQUIPMENT MARKET, BY DISTRIBUTION CHANNEL, 2022-2032 ($MILLION)
- TABLE 20. NORTH AMERICA CRICKET EQUIPMENT MARKET, BY COUNTRY, 2022-2032 ($MILLION)
- TABLE 21. U.S. CRICKET EQUIPMENT MARKET, BY TYPE, 2022-2032 ($MILLION)
- TABLE 22. U.S. CRICKET EQUIPMENT MARKET, BY PRICE POINT, 2022-2032 ($MILLION)
- TABLE 23. U.S. CRICKET EQUIPMENT MARKET, BY DISTRIBUTION CHANNEL, 2022-2032 ($MILLION)
- TABLE 24. CANADA CRICKET EQUIPMENT MARKET, BY TYPE, 2022-2032 ($MILLION)
- TABLE 25. CANADA CRICKET EQUIPMENT MARKET, BY PRICE POINT, 2022-2032 ($MILLION)
- TABLE 26. CANADA CRICKET EQUIPMENT MARKET, BY DISTRIBUTION CHANNEL, 2022-2032 ($MILLION)
- TABLE 27. REST OF NORTH AMERICA CRICKET EQUIPMENT MARKET, BY TYPE, 2022-2032 ($MILLION)
- TABLE 28. REST OF NORTH AMERICA CRICKET EQUIPMENT MARKET, BY PRICE POINT, 2022-2032 ($MILLION)
- TABLE 29. REST OF NORTH AMERICA CRICKET EQUIPMENT MARKET, BY DISTRIBUTION CHANNEL, 2022-2032 ($MILLION)
- TABLE 30. EUROPE CRICKET EQUIPMENT MARKET, BY TYPE, 2022-2032 ($MILLION)
- TABLE 31. EUROPE CRICKET EQUIPMENT MARKET, BY PRICE POINT, 2022-2032 ($MILLION)
- TABLE 32. EUROPE CRICKET EQUIPMENT MARKET, BY DISTRIBUTION CHANNEL, 2022-2032 ($MILLION)
- TABLE 33. EUROPE CRICKET EQUIPMENT MARKET, BY COUNTRY, 2022-2032 ($MILLION)
- TABLE 34. UK CRICKET EQUIPMENT MARKET, BY TYPE, 2022-2032 ($MILLION)
- TABLE 35. UK CRICKET EQUIPMENT MARKET, BY PRICE POINT, 2022-2032 ($MILLION)
- TABLE 36. UK CRICKET EQUIPMENT MARKET, BY DISTRIBUTION CHANNEL, 2022-2032 ($MILLION)
- TABLE 37. IRELAND CRICKET EQUIPMENT MARKET, BY TYPE, 2022-2032 ($MILLION)
- TABLE 38. IRELAND CRICKET EQUIPMENT MARKET, BY PRICE POINT, 2022-2032 ($MILLION)
- TABLE 39. IRELAND CRICKET EQUIPMENT MARKET, BY DISTRIBUTION CHANNEL, 2022-2032 ($MILLION)
- TABLE 40. NETHERLANDS CRICKET EQUIPMENT MARKET, BY TYPE, 2022-2032 ($MILLION)
- TABLE 41. NETHERLANDS CRICKET EQUIPMENT MARKET, BY PRICE POINT, 2022-2032 ($MILLION)
- TABLE 42. NETHERLANDS CRICKET EQUIPMENT MARKET, BY DISTRIBUTION CHANNEL, 2022-2032 ($MILLION)
- TABLE 43. GERMANY CRICKET EQUIPMENT MARKET, BY TYPE, 2022-2032 ($MILLION)
- TABLE 44. GERMANY CRICKET EQUIPMENT MARKET, BY PRICE POINT, 2022-2032 ($MILLION)
- TABLE 45. GERMANY CRICKET EQUIPMENT MARKET, BY DISTRIBUTION CHANNEL, 2022-2032 ($MILLION)
- TABLE 46. REST OF EUROPE CRICKET EQUIPMENT MARKET, BY TYPE, 2022-2032 ($MILLION)
- TABLE 47. REST OF EUROPE CRICKET EQUIPMENT MARKET, BY PRICE POINT, 2022-2032 ($MILLION)
- TABLE 48. REST OF EUROPE CRICKET EQUIPMENT MARKET, BY DISTRIBUTION CHANNEL, 2022-2032 ($MILLION)
- TABLE 49. ASIA-PACIFIC CRICKET EQUIPMENT MARKET, BY TYPE, 2022-2032 ($MILLION)
- TABLE 50. ASIA-PACIFIC CRICKET EQUIPMENT MARKET, BY PRICE POINT, 2022-2032 ($MILLION)
- TABLE 51. ASIA-PACIFIC CRICKET EQUIPMENT MARKET, BY DISTRIBUTION CHANNEL, 2022-2032 ($MILLION)
- TABLE 52. ASIA-PACIFIC CRICKET EQUIPMENT MARKET, BY COUNTRY, 2022-2032 ($MILLION)
- TABLE 53. INDIA CRICKET EQUIPMENT MARKET, BY TYPE, 2022-2032 ($MILLION)
- TABLE 54. INDIA CRICKET EQUIPMENT MARKET, BY PRICE POINT, 2022-2032 ($MILLION)
- TABLE 55. INDIA CRICKET EQUIPMENT MARKET, BY DISTRIBUTION CHANNEL, 2022-2032 ($MILLION)
- TABLE 56. AUSTRALIA CRICKET EQUIPMENT MARKET, BY TYPE, 2022-2032 ($MILLION)
- TABLE 57. AUSTRALIA CRICKET EQUIPMENT MARKET, BY PRICE POINT, 2022-2032 ($MILLION)
- TABLE 58. AUSTRALIA CRICKET EQUIPMENT MARKET, BY DISTRIBUTION CHANNEL, 2022-2032 ($MILLION)
- TABLE 59. PAKISTAN CRICKET EQUIPMENT MARKET, BY TYPE, 2022-2032 ($MILLION)
- TABLE 60. PAKISTAN CRICKET EQUIPMENT MARKET, BY PRICE POINT, 2022-2032 ($MILLION)
- TABLE 61. PAKISTAN CRICKET EQUIPMENT MARKET, BY DISTRIBUTION CHANNEL, 2022-2032 ($MILLION)
- TABLE 62. NEW ZEALAND CRICKET EQUIPMENT MARKET, BY TYPE, 2022-2032 ($MILLION)
- TABLE 63. NEW ZEALAND CRICKET EQUIPMENT MARKET, BY PRICE POINT, 2022-2032 ($MILLION)
- TABLE 64. NEW ZEALAND CRICKET EQUIPMENT MARKET, BY DISTRIBUTION CHANNEL, 2022-2032 ($MILLION)
- TABLE 65. SRI LANKA CRICKET EQUIPMENT MARKET, BY TYPE, 2022-2032 ($MILLION)
- TABLE 66. SRI LANKA CRICKET EQUIPMENT MARKET, BY PRICE POINT, 2022-2032 ($MILLION)
- TABLE 67. SRI LANKA CRICKET EQUIPMENT MARKET, BY DISTRIBUTION CHANNEL, 2022-2032 ($MILLION)
- TABLE 68. REST OF ASIA-PACIFIC CRICKET EQUIPMENT MARKET, BY TYPE, 2022-2032 ($MILLION)
- TABLE 69. REST OF ASIA-PACIFIC CRICKET EQUIPMENT MARKET, BY PRICE POINT, 2022-2032 ($MILLION)
- TABLE 70. REST OF ASIA-PACIFIC CRICKET EQUIPMENT MARKET, BY DISTRIBUTION CHANNEL, 2022-2032 ($MILLION)
- TABLE 71. LATIN AMERICA CRICKET EQUIPMENT MARKET, BY TYPE, 2022-2032 ($MILLION)
- TABLE 72. LATIN AMERICA CRICKET EQUIPMENT MARKET, BY PRICE POINT, 2022-2032 ($MILLION)
- TABLE 73. LATIN AMERICA CRICKET EQUIPMENT MARKET, BY DISTRIBUTION CHANNEL, 2022-2032 ($MILLION)
- TABLE 74. LATIN AMERICA CRICKET EQUIPMENT MARKET, BY COUNTRY, 2022-2032 ($MILLION)
- TABLE 75. BRAZIL CRICKET EQUIPMENT MARKET, BY TYPE, 2022-2032 ($MILLION)
- TABLE 76. BRAZIL CRICKET EQUIPMENT MARKET, BY PRICE POINT, 2022-2032 ($MILLION)
- TABLE 77. BRAZIL CRICKET EQUIPMENT MARKET, BY DISTRIBUTION CHANNEL, 2022-2032 ($MILLION)
- TABLE 78. ARGENTINA CRICKET EQUIPMENT MARKET, BY TYPE, 2022-2032 ($MILLION)
- TABLE 79. ARGENTINA CRICKET EQUIPMENT MARKET, BY PRICE POINT, 2022-2032 ($MILLION)
- TABLE 80. ARGENTINA CRICKET EQUIPMENT MARKET, BY DISTRIBUTION CHANNEL, 2022-2032 ($MILLION)
- TABLE 81. REST OF LATIN AMERICA CRICKET EQUIPMENT MARKET, BY TYPE, 2022-2032 ($MILLION)
- TABLE 82. REST OF LATIN AMERICA CRICKET EQUIPMENT MARKET, BY PRICE POINT, 2022-2032 ($MILLION)
- TABLE 83. REST OF LATIN AMERICA CRICKET EQUIPMENT MARKET, BY DISTRIBUTION CHANNEL, 2022-2032 ($MILLION)
- TABLE 84. MIDDLE EAST AND AFRICA CRICKET EQUIPMENT MARKET, BY TYPE, 2022-2032 ($MILLION)
- TABLE 85. MIDDLE EAST AND AFRICA CRICKET EQUIPMENT MARKET, BY PRICE POINT, 2022-2032 ($MILLION)
- TABLE 86. MIDDLE EAST AND AFRICA CRICKET EQUIPMENT MARKET, BY DISTRIBUTION CHANNEL, 2022-2032 ($MILLION)
- TABLE 87. MIDDLE EAST AND AFRICA CRICKET EQUIPMENT MARKET, BY COUNTRY, 2022-2032 ($MILLION)
- TABLE 88. SOUTH AFRICA CRICKET EQUIPMENT MARKET, BY TYPE, 2022-2032 ($MILLION)
- TABLE 89. SOUTH AFRICA CRICKET EQUIPMENT MARKET, BY PRICE POINT, 2022-2032 ($MILLION)
- TABLE 90. SOUTH AFRICA CRICKET EQUIPMENT MARKET, BY DISTRIBUTION CHANNEL, 2022-2032 ($MILLION)
- TABLE 91. ZIMBABWE CRICKET EQUIPMENT MARKET, BY TYPE, 2022-2032 ($MILLION)
- TABLE 92. ZIMBABWE CRICKET EQUIPMENT MARKET, BY PRICE POINT, 2022-2032 ($MILLION)
- TABLE 93. ZIMBABWE CRICKET EQUIPMENT MARKET, BY DISTRIBUTION CHANNEL, 2022-2032 ($MILLION)
- TABLE 94. UNITED ARAB EMIRATES CRICKET EQUIPMENT MARKET, BY TYPE, 2022-2032 ($MILLION)
- TABLE 95. UNITED ARAB EMIRATES CRICKET EQUIPMENT MARKET, BY PRICE POINT, 2022-2032 ($MILLION)
- TABLE 96. UNITED ARAB EMIRATES CRICKET EQUIPMENT MARKET, BY DISTRIBUTION CHANNEL, 2022-2032 ($MILLION)
- TABLE 97. REST OF MIDDLE EAST AND AFRICA CRICKET EQUIPMENT MARKET, BY TYPE, 2022-2032 ($MILLION)
- TABLE 98. REST OF MIDDLE EAST AND AFRICA CRICKET EQUIPMENT MARKET, BY PRICE POINT, 2022-2032 ($MILLION)
- TABLE 99. REST OF MIDDLE EAST AND AFRICA CRICKET EQUIPMENT MARKET, BY DISTRIBUTION CHANNEL, 2022-2032 ($MILLION)
- TABLE 100. GRAY-NICOLLS: KEY EXECUTIVES
- TABLE 101. GRAY-NICOLLS: COMPANY SNAPSHOT
- TABLE 102. GRAY-NICOLLS: PRODUCT SEGMENTS
- TABLE 103. GRAY-NICOLLS: SERVICE SEGMENTS
- TABLE 104. GRAY-NICOLLS: PRODUCT PORTFOLIO
- TABLE 105. GRAY-NICOLLS: KEY STRATERGIES
- TABLE 106. KOOKABURRA: KEY EXECUTIVES
- TABLE 107. KOOKABURRA: COMPANY SNAPSHOT
- TABLE 108. KOOKABURRA: PRODUCT SEGMENTS
- TABLE 109. KOOKABURRA: SERVICE SEGMENTS
- TABLE 110. KOOKABURRA: PRODUCT PORTFOLIO
- TABLE 111. KOOKABURRA: KEY STRATERGIES
- TABLE 112. GUNN & MOORE (GM): KEY EXECUTIVES
- TABLE 113. GUNN & MOORE (GM): COMPANY SNAPSHOT
- TABLE 114. GUNN & MOORE (GM): PRODUCT SEGMENTS
- TABLE 115. GUNN & MOORE (GM): SERVICE SEGMENTS
- TABLE 116. GUNN & MOORE (GM): PRODUCT PORTFOLIO
- TABLE 117. GUNN & MOORE (GM): KEY STRATERGIES
- TABLE 118. SAREEN SPORTS INDUSTRIES (SS): KEY EXECUTIVES
- TABLE 119. SAREEN SPORTS INDUSTRIES (SS): COMPANY SNAPSHOT
- TABLE 120. SAREEN SPORTS INDUSTRIES (SS): PRODUCT SEGMENTS
- TABLE 121. SAREEN SPORTS INDUSTRIES (SS): SERVICE SEGMENTS
- TABLE 122. SAREEN SPORTS INDUSTRIES (SS): PRODUCT PORTFOLIO
- TABLE 123. SAREEN SPORTS INDUSTRIES (SS): KEY STRATERGIES
- TABLE 124. ADIDAS: KEY EXECUTIVES
- TABLE 125. ADIDAS: COMPANY SNAPSHOT
- TABLE 126. ADIDAS: PRODUCT SEGMENTS
- TABLE 127. ADIDAS: SERVICE SEGMENTS
- TABLE 128. ADIDAS: PRODUCT PORTFOLIO
- TABLE 129. ADIDAS: KEY STRATERGIES
- TABLE 130. PUMA: KEY EXECUTIVES
- TABLE 131. PUMA: COMPANY SNAPSHOT
- TABLE 132. PUMA: PRODUCT SEGMENTS
- TABLE 133. PUMA: SERVICE SEGMENTS
- TABLE 134. PUMA: PRODUCT PORTFOLIO
- TABLE 135. PUMA: KEY STRATERGIES
- TABLE 136. SANSPAREILS GREENLANDS (SG): KEY EXECUTIVES
- TABLE 137. SANSPAREILS GREENLANDS (SG): COMPANY SNAPSHOT
- TABLE 138. SANSPAREILS GREENLANDS (SG): PRODUCT SEGMENTS
- TABLE 139. SANSPAREILS GREENLANDS (SG): SERVICE SEGMENTS
- TABLE 140. SANSPAREILS GREENLANDS (SG): PRODUCT PORTFOLIO
- TABLE 141. SANSPAREILS GREENLANDS (SG): KEY STRATERGIES
- TABLE 142. SPARTAN SPORTS: KEY EXECUTIVES
- TABLE 143. SPARTAN SPORTS: COMPANY SNAPSHOT
- TABLE 144. SPARTAN SPORTS: PRODUCT SEGMENTS
- TABLE 145. SPARTAN SPORTS: SERVICE SEGMENTS
- TABLE 146. SPARTAN SPORTS: PRODUCT PORTFOLIO
- TABLE 147. SPARTAN SPORTS: KEY STRATERGIES
- TABLE 148. SLAZENGER: KEY EXECUTIVES
- TABLE 149. SLAZENGER: COMPANY SNAPSHOT
- TABLE 150. SLAZENGER: PRODUCT SEGMENTS
- TABLE 151. SLAZENGER: SERVICE SEGMENTS
- TABLE 152. SLAZENGER: PRODUCT PORTFOLIO
- TABLE 153. SLAZENGER: KEY STRATERGIES
- TABLE 154. BEAT ALL SPORTS (BAS): KEY EXECUTIVES
- TABLE 155. BEAT ALL SPORTS (BAS): COMPANY SNAPSHOT
- TABLE 156. BEAT ALL SPORTS (BAS): PRODUCT SEGMENTS
- TABLE 157. BEAT ALL SPORTS (BAS): SERVICE SEGMENTS
- TABLE 158. BEAT ALL SPORTS (BAS): PRODUCT PORTFOLIO
- TABLE 159. BEAT ALL SPORTS (BAS): KEY STRATERGIES
LIST OF FIGURES
- FIGURE 01. CRICKET EQUIPMENT MARKET, 2022-2032
- FIGURE 02. SEGMENTATION OF CRICKET EQUIPMENT MARKET,2022-2032
- FIGURE 03. TOP IMPACTING FACTORS IN CRICKET EQUIPMENT MARKET
- FIGURE 04. TOP INVESTMENT POCKETS IN CRICKET EQUIPMENT MARKET (2023-2032)
- FIGURE 05. BARGAINING POWER OF SUPPLIERS
- FIGURE 06. BARGAINING POWER OF BUYERS
- FIGURE 07. THREAT OF SUBSTITUTION
- FIGURE 08. THREAT OF SUBSTITUTION
- FIGURE 09. COMPETITIVE RIVALRY
- FIGURE 10. GLOBAL CRICKET EQUIPMENT MARKET:DRIVERS, RESTRAINTS AND OPPORTUNITIES
- FIGURE 11. PRICING ANALYSIS: CRICKET EQUIPMENT MARKET 2022 AND 2032
- FIGURE 12. CRICKET EQUIPMENT MARKET, BY TYPE, 2022 AND 2032(%)
- FIGURE 13. COMPARATIVE SHARE ANALYSIS OF CRICKET EQUIPMENT MARKET FOR BATS, BY COUNTRY 2022 AND 2032(%)
- FIGURE 14. COMPARATIVE SHARE ANALYSIS OF CRICKET EQUIPMENT MARKET FOR BALLS, BY COUNTRY 2022 AND 2032(%)
- FIGURE 15. COMPARATIVE SHARE ANALYSIS OF CRICKET EQUIPMENT MARKET FOR PROTECTIVE GEARS, BY COUNTRY 2022 AND 2032(%)
- FIGURE 16. COMPARATIVE SHARE ANALYSIS OF CRICKET EQUIPMENT MARKET FOR OTHERS, BY COUNTRY 2022 AND 2032(%)
- FIGURE 17. CRICKET EQUIPMENT MARKET, BY PRICE POINT, 2022 AND 2032(%)
- FIGURE 18. COMPARATIVE SHARE ANALYSIS OF CRICKET EQUIPMENT MARKET FOR ECONOMICAL, BY COUNTRY 2022 AND 2032(%)
- FIGURE 19. COMPARATIVE SHARE ANALYSIS OF CRICKET EQUIPMENT MARKET FOR MEDIUM, BY COUNTRY 2022 AND 2032(%)
- FIGURE 20. COMPARATIVE SHARE ANALYSIS OF CRICKET EQUIPMENT MARKET FOR HIGH, BY COUNTRY 2022 AND 2032(%)
- FIGURE 21. CRICKET EQUIPMENT MARKET, BY DISTRIBUTION CHANNEL, 2022 AND 2032(%)
- FIGURE 22. COMPARATIVE SHARE ANALYSIS OF CRICKET EQUIPMENT MARKET FOR HYPERMARKETS/SUPERMARKETS, BY COUNTRY 2022 AND 2032(%)
- FIGURE 23. COMPARATIVE SHARE ANALYSIS OF CRICKET EQUIPMENT MARKET FOR SPORTS RETAIL STORES, BY COUNTRY 2022 AND 2032(%)
- FIGURE 24. COMPARATIVE SHARE ANALYSIS OF CRICKET EQUIPMENT MARKET FOR BRANDED OUTLETS, BY COUNTRY 2022 AND 2032(%)
- FIGURE 25. COMPARATIVE SHARE ANALYSIS OF CRICKET EQUIPMENT MARKET FOR ONLINE STORES, BY COUNTRY 2022 AND 2032(%)
- FIGURE 26. COMPARATIVE SHARE ANALYSIS OF CRICKET EQUIPMENT MARKET FOR OTHERS, BY COUNTRY 2022 AND 2032(%)
- FIGURE 27. CRICKET EQUIPMENT MARKET BY REGION, 2022 AND 2032(%)
- FIGURE 28. U.S. CRICKET EQUIPMENT MARKET, 2022-2032 ($MILLION)
- FIGURE 29. CANADA CRICKET EQUIPMENT MARKET, 2022-2032 ($MILLION)
- FIGURE 30. REST OF NORTH AMERICA CRICKET EQUIPMENT MARKET, 2022-2032 ($MILLION)
- FIGURE 31. UK CRICKET EQUIPMENT MARKET, 2022-2032 ($MILLION)
- FIGURE 32. IRELAND CRICKET EQUIPMENT MARKET, 2022-2032 ($MILLION)
- FIGURE 33. NETHERLANDS CRICKET EQUIPMENT MARKET, 2022-2032 ($MILLION)
- FIGURE 34. GERMANY CRICKET EQUIPMENT MARKET, 2022-2032 ($MILLION)
- FIGURE 35. REST OF EUROPE CRICKET EQUIPMENT MARKET, 2022-2032 ($MILLION)
- FIGURE 36. INDIA CRICKET EQUIPMENT MARKET, 2022-2032 ($MILLION)
- FIGURE 37. AUSTRALIA CRICKET EQUIPMENT MARKET, 2022-2032 ($MILLION)
- FIGURE 38. PAKISTAN CRICKET EQUIPMENT MARKET, 2022-2032 ($MILLION)
- FIGURE 39. NEW ZEALAND CRICKET EQUIPMENT MARKET, 2022-2032 ($MILLION)
- FIGURE 40. SRI LANKA CRICKET EQUIPMENT MARKET, 2022-2032 ($MILLION)
- FIGURE 41. REST OF ASIA-PACIFIC CRICKET EQUIPMENT MARKET, 2022-2032 ($MILLION)
- FIGURE 42. BRAZIL CRICKET EQUIPMENT MARKET, 2022-2032 ($MILLION)
- FIGURE 43. ARGENTINA CRICKET EQUIPMENT MARKET, 2022-2032 ($MILLION)
- FIGURE 44. REST OF LATIN AMERICA CRICKET EQUIPMENT MARKET, 2022-2032 ($MILLION)
- FIGURE 45. SOUTH AFRICA CRICKET EQUIPMENT MARKET, 2022-2032 ($MILLION)
- FIGURE 46. ZIMBABWE CRICKET EQUIPMENT MARKET, 2022-2032 ($MILLION)
- FIGURE 47. UNITED ARAB EMIRATES CRICKET EQUIPMENT MARKET, 2022-2032 ($MILLION)
- FIGURE 48. REST OF MIDDLE EAST AND AFRICA CRICKET EQUIPMENT MARKET, 2022-2032 ($MILLION)
- FIGURE 49. TOP WINNING STRATEGIES, BY YEAR
- FIGURE 50. TOP WINNING STRATEGIES, BY DEVELOPMENT
- FIGURE 51. TOP WINNING STRATEGIES, BY COMPANY
- FIGURE 52. PRODUCT MAPPING OF TOP 10 PLAYERS
- FIGURE 53. COMPETITIVE DASHBOARD
- FIGURE 54. COMPETITIVE HEATMAP: CRICKET EQUIPMENT MARKET
- FIGURE 55. TOP PLAYER POSITIONING, 2022

