
PUBLISHER: Allied Market Research | PRODUCT CODE: 1446901

PUBLISHER: Allied Market Research | PRODUCT CODE: 1446901
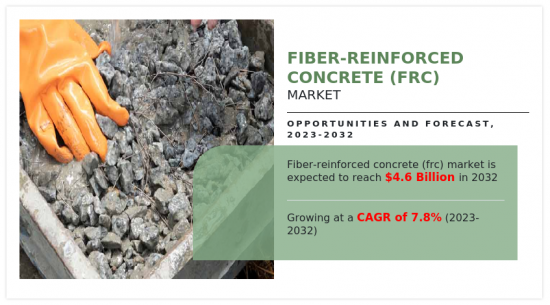
Fiber-reinforced Concrete Market By Type, By Process, By Application : Global Opportunity Analysis and Industry Forecast, 2023-2032
The global fiber-reinforced concrete (FRC) market was valued at $2,169.2 million in 2022, and is projected to reach $4,553.13 million by 2032, registering a CAGR of 7.8% from 2023 to 2032. Fiber reinforced concrete (FRC), an evolution in creation technology, integrates conventional concrete additives with reinforcing fibers to create a high-overall performance composite material. The dispersed fibers in the concrete matrix make contributions to improved structural integrity, tensile energy, and resistance to cracking. FRC's adaptability and advanced mechanical houses make it a desired preference in current creation, providing answers to demanding situations posed by means of dynamic environmental situations and annoying structural requirements.
The global population along with globalization is rising at a significant rate. Various organizations such as United Nations and The World Bank have estimated that the world population is expected to reach above 9.5 billion in 2050, from about 8 billion in 2022. This is anticipated to increase the demand for residential and commercial buildings across the world, especially in developing nations such as China, India, Brazil, and South Africa.
Furthermore, construction of public infrastructure such as airports, bridges and other structures involve utilization of the fiber reinforced concrete. Despite its advantages, limited awareness among construction experts regarding the benefits and applications of FRC poses a large restraint. Education and outreach efforts are crucial to triumph over this hurdle and foster broader popularity in the industry. Such factors restrains the market growth.
The fiber reinforced concrete market is segmented on the basis of type, process, application, and region. By type, the market is divided into natural fiber, synthetic fiber, glass fiber, steel fiber, and others. By process, it is categorized into premix, sprayed, hybrid and others. By application, it is classified into infrastructure, building & construction, mining & tunnel, industrial, and others.
On the basis of region, the market is analyzed across North America (the U.S., Canada, and Mexico), Europe (Germany, the UK, Italy, France, and rest of Europe), Asia-Pacific (China, Japan, India, South Korea, and rest of Asia-Pacific), and LAMEA (Latin America, Middle East, Africa).
The major players that operate in the global market have adopted key strategies such as product launch, acquisition, and others to strengthen their market outreach, product portfolio and sustain the stiff competition in the market.
The major players profiled in the fiber reinforced concrete market report are Fibrex Construction Group, Clark Pacific, Ultratech Cement Ltd., Formglas Products Ltd., Willis Construction Co. Inc., Stromberg Architectural, BB Fiberbeton, Generale Prefabbricati S.P.A., BarChip Pty Ltd, and GRCUK.
Key Benefits For Stakeholders
- This report provides a quantitative analysis of the market segments, current trends, estimations, and dynamics of the fiber-reinforced concrete (frc) market analysis from 2022 to 2032 to identify the prevailing fiber-reinforced concrete (frc) market opportunities.
- The market research is offered along with information related to key drivers, restraints, and opportunities.
- Porter's five forces analysis highlights the potency of buyers and suppliers to enable stakeholders make profit-oriented business decisions and strengthen their supplier-buyer network.
- In-depth analysis of the fiber-reinforced concrete (frc) market segmentation assists to determine the prevailing market opportunities.
- Major countries in each region are mapped according to their revenue contribution to the global market.
- Market player positioning facilitates benchmarking and provides a clear understanding of the present position of the market players.
- The report includes the analysis of the regional as well as global fiber-reinforced concrete (frc) market trends, key players, market segments, application areas, and market growth strategies.
Additional benefits you will get with this purchase are:
- Quarterly Update and* (only available with a corporate license, on listed price)
- 5 additional Company Profile of client Choice pre- or Post-purchase, as a free update.
- Free Upcoming Version on the Purchase of Five and Enterprise User License.
- 16 analyst hours of support* (post-purchase, if you find additional data requirements upon review of the report, you may receive support amounting to 16 analyst hours to solve questions, and post-sale queries)
- 15% Free Customization* (in case the scope or segment of the report does not match your requirements, 15% is equivalent to 3 working days of free work, applicable once)
- Free data Pack on the Five and Enterprise User License. (Excel version of the report)
- Free Updated report if the report is 6-12 months old or older.
- 24-hour priority response*
- Free Industry updates and white papers.
Possible Customization with this report (with additional cost and timeline, please talk to the sales executive to know more)
- Investment Opportunities
- Regulatory Guidelines
- Additional company profiles with specific to client's interest
- Additional country or region analysis- market size and forecast
- Expanded list for Company Profiles
- Historic market data
Key Market Segments
By Application
- Infrastructure
- Building and Construction
- Mining and Tunnel
- Industrial
- Others
By Type
- Natural Fiber
- Synthetic Fiber
- Glass Fiber
- Steel Fiber
- Others
By Process
- Premix
- Sprayed
- Hybrid
- Others
By Region
- North America
- U.S.
- Canada
- Mexico
- Europe
- Germany
- France
- Italy
- UK
- Rest of Europe
- Asia-Pacific
- China
- Japan
- India
- South Korea
- Rest of Asia-Pacific
- Latin America
- Brazil
- Chile
- Rest of Latin America
- Middle East and Africa
- Saudi Arabia
- UAE
- Nigeria
- South Africa
- Rest of Middle East And Africa
Key Market Players:
- fibrex construction group
- Clark Pacific
- Ultratech Cement Ltd.
- formglas products ltd.
- Willis Construction Co. Inc.
- Stromberg Architectural
- BB Fiberbeton
- generale prefabbricati s.p.a.
- BarChip Pty Ltd
- GRCUK
TABLE OF CONTENTS
CHAPTER 1: INTRODUCTION
- 1.1. Report description
- 1.2. Key market segments
- 1.3. Key benefits to the stakeholders
- 1.4. Research methodology
- 1.4.1. Primary research
- 1.4.2. Secondary research
- 1.4.3. Analyst tools and models
CHAPTER 2: EXECUTIVE SUMMARY
- 2.1. CXO perspective
CHAPTER 3: MARKET OVERVIEW
- 3.1. Market definition and scope
- 3.2. Key findings
- 3.2.1. Top impacting factors
- 3.2.2. Top investment pockets
- 3.3. Porter's five forces analysis
- 3.4. Market dynamics
- 3.4.1. Drivers
- 3.4.2. Restraints
- 3.4.3. Opportunities
CHAPTER 4: FIBER-REINFORCED CONCRETE (FRC) MARKET, BY TYPE
- 4.1. Overview
- 4.1.1. Market size and forecast
- 4.2. Natural Fiber
- 4.2.1. Key market trends, growth factors and opportunities
- 4.2.2. Market size and forecast, by region
- 4.2.3. Market share analysis by country
- 4.3. Synthetic Fiber
- 4.3.1. Key market trends, growth factors and opportunities
- 4.3.2. Market size and forecast, by region
- 4.3.3. Market share analysis by country
- 4.4. Glass Fiber
- 4.4.1. Key market trends, growth factors and opportunities
- 4.4.2. Market size and forecast, by region
- 4.4.3. Market share analysis by country
- 4.5. Steel Fiber
- 4.5.1. Key market trends, growth factors and opportunities
- 4.5.2. Market size and forecast, by region
- 4.5.3. Market share analysis by country
- 4.6. Others
- 4.6.1. Key market trends, growth factors and opportunities
- 4.6.2. Market size and forecast, by region
- 4.6.3. Market share analysis by country
CHAPTER 5: FIBER-REINFORCED CONCRETE (FRC) MARKET, BY PROCESS
- 5.1. Overview
- 5.1.1. Market size and forecast
- 5.2. Premix
- 5.2.1. Key market trends, growth factors and opportunities
- 5.2.2. Market size and forecast, by region
- 5.2.3. Market share analysis by country
- 5.3. Sprayed
- 5.3.1. Key market trends, growth factors and opportunities
- 5.3.2. Market size and forecast, by region
- 5.3.3. Market share analysis by country
- 5.4. Hybrid
- 5.4.1. Key market trends, growth factors and opportunities
- 5.4.2. Market size and forecast, by region
- 5.4.3. Market share analysis by country
- 5.5. Others
- 5.5.1. Key market trends, growth factors and opportunities
- 5.5.2. Market size and forecast, by region
- 5.5.3. Market share analysis by country
CHAPTER 6: FIBER-REINFORCED CONCRETE (FRC) MARKET, BY APPLICATION
- 6.1. Overview
- 6.1.1. Market size and forecast
- 6.2. Infrastructure
- 6.2.1. Key market trends, growth factors and opportunities
- 6.2.2. Market size and forecast, by region
- 6.2.3. Market share analysis by country
- 6.3. Building and Construction
- 6.3.1. Key market trends, growth factors and opportunities
- 6.3.2. Market size and forecast, by region
- 6.3.3. Market share analysis by country
- 6.4. Mining and Tunnel
- 6.4.1. Key market trends, growth factors and opportunities
- 6.4.2. Market size and forecast, by region
- 6.4.3. Market share analysis by country
- 6.5. Industrial
- 6.5.1. Key market trends, growth factors and opportunities
- 6.5.2. Market size and forecast, by region
- 6.5.3. Market share analysis by country
- 6.6. Others
- 6.6.1. Key market trends, growth factors and opportunities
- 6.6.2. Market size and forecast, by region
- 6.6.3. Market share analysis by country
CHAPTER 7: FIBER-REINFORCED CONCRETE (FRC) MARKET, BY REGION
- 7.1. Overview
- 7.1.1. Market size and forecast By Region
- 7.2. North America
- 7.2.1. Key market trends, growth factors and opportunities
- 7.2.2. Market size and forecast, by Type
- 7.2.3. Market size and forecast, by Process
- 7.2.4. Market size and forecast, by Application
- 7.2.5. Market size and forecast, by country
- 7.2.5.1. U.S.
- 7.2.5.1.1. Market size and forecast, by Type
- 7.2.5.1.2. Market size and forecast, by Process
- 7.2.5.1.3. Market size and forecast, by Application
- 7.2.5.2. Canada
- 7.2.5.2.1. Market size and forecast, by Type
- 7.2.5.2.2. Market size and forecast, by Process
- 7.2.5.2.3. Market size and forecast, by Application
- 7.2.5.3. Mexico
- 7.2.5.3.1. Market size and forecast, by Type
- 7.2.5.3.2. Market size and forecast, by Process
- 7.2.5.3.3. Market size and forecast, by Application
- 7.3. Europe
- 7.3.1. Key market trends, growth factors and opportunities
- 7.3.2. Market size and forecast, by Type
- 7.3.3. Market size and forecast, by Process
- 7.3.4. Market size and forecast, by Application
- 7.3.5. Market size and forecast, by country
- 7.3.5.1. Germany
- 7.3.5.1.1. Market size and forecast, by Type
- 7.3.5.1.2. Market size and forecast, by Process
- 7.3.5.1.3. Market size and forecast, by Application
- 7.3.5.2. France
- 7.3.5.2.1. Market size and forecast, by Type
- 7.3.5.2.2. Market size and forecast, by Process
- 7.3.5.2.3. Market size and forecast, by Application
- 7.3.5.3. Italy
- 7.3.5.3.1. Market size and forecast, by Type
- 7.3.5.3.2. Market size and forecast, by Process
- 7.3.5.3.3. Market size and forecast, by Application
- 7.3.5.4. UK
- 7.3.5.4.1. Market size and forecast, by Type
- 7.3.5.4.2. Market size and forecast, by Process
- 7.3.5.4.3. Market size and forecast, by Application
- 7.3.5.5. Rest of Europe
- 7.3.5.5.1. Market size and forecast, by Type
- 7.3.5.5.2. Market size and forecast, by Process
- 7.3.5.5.3. Market size and forecast, by Application
- 7.4. Asia-Pacific
- 7.4.1. Key market trends, growth factors and opportunities
- 7.4.2. Market size and forecast, by Type
- 7.4.3. Market size and forecast, by Process
- 7.4.4. Market size and forecast, by Application
- 7.4.5. Market size and forecast, by country
- 7.4.5.1. China
- 7.4.5.1.1. Market size and forecast, by Type
- 7.4.5.1.2. Market size and forecast, by Process
- 7.4.5.1.3. Market size and forecast, by Application
- 7.4.5.2. Japan
- 7.4.5.2.1. Market size and forecast, by Type
- 7.4.5.2.2. Market size and forecast, by Process
- 7.4.5.2.3. Market size and forecast, by Application
- 7.4.5.3. India
- 7.4.5.3.1. Market size and forecast, by Type
- 7.4.5.3.2. Market size and forecast, by Process
- 7.4.5.3.3. Market size and forecast, by Application
- 7.4.5.4. South Korea
- 7.4.5.4.1. Market size and forecast, by Type
- 7.4.5.4.2. Market size and forecast, by Process
- 7.4.5.4.3. Market size and forecast, by Application
- 7.4.5.5. Rest of Asia-Pacific
- 7.4.5.5.1. Market size and forecast, by Type
- 7.4.5.5.2. Market size and forecast, by Process
- 7.4.5.5.3. Market size and forecast, by Application
- 7.5. Latin America
- 7.5.1. Key market trends, growth factors and opportunities
- 7.5.2. Market size and forecast, by Type
- 7.5.3. Market size and forecast, by Process
- 7.5.4. Market size and forecast, by Application
- 7.5.5. Market size and forecast, by country
- 7.5.5.1. Brazil
- 7.5.5.1.1. Market size and forecast, by Type
- 7.5.5.1.2. Market size and forecast, by Process
- 7.5.5.1.3. Market size and forecast, by Application
- 7.5.5.2. Chile
- 7.5.5.2.1. Market size and forecast, by Type
- 7.5.5.2.2. Market size and forecast, by Process
- 7.5.5.2.3. Market size and forecast, by Application
- 7.5.5.3. Rest of Latin America
- 7.5.5.3.1. Market size and forecast, by Type
- 7.5.5.3.2. Market size and forecast, by Process
- 7.5.5.3.3. Market size and forecast, by Application
- 7.6. Middle East and Africa
- 7.6.1. Key market trends, growth factors and opportunities
- 7.6.2. Market size and forecast, by Type
- 7.6.3. Market size and forecast, by Process
- 7.6.4. Market size and forecast, by Application
- 7.6.5. Market size and forecast, by country
- 7.6.5.1. Saudi Arabia
- 7.6.5.1.1. Market size and forecast, by Type
- 7.6.5.1.2. Market size and forecast, by Process
- 7.6.5.1.3. Market size and forecast, by Application
- 7.6.5.2. UAE
- 7.6.5.2.1. Market size and forecast, by Type
- 7.6.5.2.2. Market size and forecast, by Process
- 7.6.5.2.3. Market size and forecast, by Application
- 7.6.5.3. Nigeria
- 7.6.5.3.1. Market size and forecast, by Type
- 7.6.5.3.2. Market size and forecast, by Process
- 7.6.5.3.3. Market size and forecast, by Application
- 7.6.5.4. South Africa
- 7.6.5.4.1. Market size and forecast, by Type
- 7.6.5.4.2. Market size and forecast, by Process
- 7.6.5.4.3. Market size and forecast, by Application
- 7.6.5.5. Rest of Middle East And Africa
- 7.6.5.5.1. Market size and forecast, by Type
- 7.6.5.5.2. Market size and forecast, by Process
- 7.6.5.5.3. Market size and forecast, by Application
CHAPTER 8: COMPETITIVE LANDSCAPE
- 8.1. Introduction
- 8.2. Top winning strategies
- 8.3. Product mapping of top 10 player
- 8.4. Competitive dashboard
- 8.5. Competitive heatmap
- 8.6. Top player positioning, 2022
CHAPTER 9: COMPANY PROFILES
- 9.1. fibrex construction group
- 9.1.1. Company overview
- 9.1.2. Key executives
- 9.1.3. Company snapshot
- 9.1.4. Operating business segments
- 9.1.5. Product portfolio
- 9.1.6. Business performance
- 9.1.7. Key strategic moves and developments
- 9.2. Clark Pacific
- 9.2.1. Company overview
- 9.2.2. Key executives
- 9.2.3. Company snapshot
- 9.2.4. Operating business segments
- 9.2.5. Product portfolio
- 9.2.6. Business performance
- 9.2.7. Key strategic moves and developments
- 9.3. Ultratech Cement Ltd.
- 9.3.1. Company overview
- 9.3.2. Key executives
- 9.3.3. Company snapshot
- 9.3.4. Operating business segments
- 9.3.5. Product portfolio
- 9.3.6. Business performance
- 9.3.7. Key strategic moves and developments
- 9.4. formglas products ltd.
- 9.4.1. Company overview
- 9.4.2. Key executives
- 9.4.3. Company snapshot
- 9.4.4. Operating business segments
- 9.4.5. Product portfolio
- 9.4.6. Business performance
- 9.4.7. Key strategic moves and developments
- 9.5. Willis Construction Co. Inc.
- 9.5.1. Company overview
- 9.5.2. Key executives
- 9.5.3. Company snapshot
- 9.5.4. Operating business segments
- 9.5.5. Product portfolio
- 9.5.6. Business performance
- 9.5.7. Key strategic moves and developments
- 9.6. Stromberg Architectural
- 9.6.1. Company overview
- 9.6.2. Key executives
- 9.6.3. Company snapshot
- 9.6.4. Operating business segments
- 9.6.5. Product portfolio
- 9.6.6. Business performance
- 9.6.7. Key strategic moves and developments
- 9.7. BB Fiberbeton
- 9.7.1. Company overview
- 9.7.2. Key executives
- 9.7.3. Company snapshot
- 9.7.4. Operating business segments
- 9.7.5. Product portfolio
- 9.7.6. Business performance
- 9.7.7. Key strategic moves and developments
- 9.8. generale prefabbricati s.p.a.
- 9.8.1. Company overview
- 9.8.2. Key executives
- 9.8.3. Company snapshot
- 9.8.4. Operating business segments
- 9.8.5. Product portfolio
- 9.8.6. Business performance
- 9.8.7. Key strategic moves and developments
- 9.9. BarChip Pty Ltd
- 9.9.1. Company overview
- 9.9.2. Key executives
- 9.9.3. Company snapshot
- 9.9.4. Operating business segments
- 9.9.5. Product portfolio
- 9.9.6. Business performance
- 9.9.7. Key strategic moves and developments
- 9.10. GRCUK
- 9.10.1. Company overview
- 9.10.2. Key executives
- 9.10.3. Company snapshot
- 9.10.4. Operating business segments
- 9.10.5. Product portfolio
- 9.10.6. Business performance
- 9.10.7. Key strategic moves and developments
LIST OF TABLES
- TABLE 01. GLOBAL FIBER-REINFORCED CONCRETE (FRC) MARKET, BY TYPE, 2022-2032 ($MILLION)
- TABLE 02. FIBER-REINFORCED CONCRETE (FRC) MARKET FOR NATURAL FIBER, BY REGION, 2022-2032 ($MILLION)
- TABLE 03. FIBER-REINFORCED CONCRETE (FRC) MARKET FOR SYNTHETIC FIBER, BY REGION, 2022-2032 ($MILLION)
- TABLE 04. FIBER-REINFORCED CONCRETE (FRC) MARKET FOR GLASS FIBER, BY REGION, 2022-2032 ($MILLION)
- TABLE 05. FIBER-REINFORCED CONCRETE (FRC) MARKET FOR STEEL FIBER, BY REGION, 2022-2032 ($MILLION)
- TABLE 06. FIBER-REINFORCED CONCRETE (FRC) MARKET FOR OTHERS, BY REGION, 2022-2032 ($MILLION)
- TABLE 07. GLOBAL FIBER-REINFORCED CONCRETE (FRC) MARKET, BY PROCESS, 2022-2032 ($MILLION)
- TABLE 08. FIBER-REINFORCED CONCRETE (FRC) MARKET FOR PREMIX, BY REGION, 2022-2032 ($MILLION)
- TABLE 09. FIBER-REINFORCED CONCRETE (FRC) MARKET FOR SPRAYED, BY REGION, 2022-2032 ($MILLION)
- TABLE 10. FIBER-REINFORCED CONCRETE (FRC) MARKET FOR HYBRID, BY REGION, 2022-2032 ($MILLION)
- TABLE 11. FIBER-REINFORCED CONCRETE (FRC) MARKET FOR OTHERS, BY REGION, 2022-2032 ($MILLION)
- TABLE 12. GLOBAL FIBER-REINFORCED CONCRETE (FRC) MARKET, BY APPLICATION, 2022-2032 ($MILLION)
- TABLE 13. FIBER-REINFORCED CONCRETE (FRC) MARKET FOR INFRASTRUCTURE, BY REGION, 2022-2032 ($MILLION)
- TABLE 14. FIBER-REINFORCED CONCRETE (FRC) MARKET FOR BUILDING AND CONSTRUCTION, BY REGION, 2022-2032 ($MILLION)
- TABLE 15. FIBER-REINFORCED CONCRETE (FRC) MARKET FOR MINING AND TUNNEL, BY REGION, 2022-2032 ($MILLION)
- TABLE 16. FIBER-REINFORCED CONCRETE (FRC) MARKET FOR INDUSTRIAL, BY REGION, 2022-2032 ($MILLION)
- TABLE 17. FIBER-REINFORCED CONCRETE (FRC) MARKET FOR OTHERS, BY REGION, 2022-2032 ($MILLION)
- TABLE 18. FIBER-REINFORCED CONCRETE (FRC) MARKET, BY REGION, 2022-2032 ($MILLION)
- TABLE 19. NORTH AMERICA FIBER-REINFORCED CONCRETE (FRC) MARKET, BY TYPE, 2022-2032 ($MILLION)
- TABLE 20. NORTH AMERICA FIBER-REINFORCED CONCRETE (FRC) MARKET, BY PROCESS, 2022-2032 ($MILLION)
- TABLE 21. NORTH AMERICA FIBER-REINFORCED CONCRETE (FRC) MARKET, BY APPLICATION, 2022-2032 ($MILLION)
- TABLE 22. NORTH AMERICA FIBER-REINFORCED CONCRETE (FRC) MARKET, BY COUNTRY, 2022-2032 ($MILLION)
- TABLE 23. U.S. FIBER-REINFORCED CONCRETE (FRC) MARKET, BY TYPE, 2022-2032 ($MILLION)
- TABLE 24. U.S. FIBER-REINFORCED CONCRETE (FRC) MARKET, BY PROCESS, 2022-2032 ($MILLION)
- TABLE 25. U.S. FIBER-REINFORCED CONCRETE (FRC) MARKET, BY APPLICATION, 2022-2032 ($MILLION)
- TABLE 26. CANADA FIBER-REINFORCED CONCRETE (FRC) MARKET, BY TYPE, 2022-2032 ($MILLION)
- TABLE 27. CANADA FIBER-REINFORCED CONCRETE (FRC) MARKET, BY PROCESS, 2022-2032 ($MILLION)
- TABLE 28. CANADA FIBER-REINFORCED CONCRETE (FRC) MARKET, BY APPLICATION, 2022-2032 ($MILLION)
- TABLE 29. MEXICO FIBER-REINFORCED CONCRETE (FRC) MARKET, BY TYPE, 2022-2032 ($MILLION)
- TABLE 30. MEXICO FIBER-REINFORCED CONCRETE (FRC) MARKET, BY PROCESS, 2022-2032 ($MILLION)
- TABLE 31. MEXICO FIBER-REINFORCED CONCRETE (FRC) MARKET, BY APPLICATION, 2022-2032 ($MILLION)
- TABLE 32. EUROPE FIBER-REINFORCED CONCRETE (FRC) MARKET, BY TYPE, 2022-2032 ($MILLION)
- TABLE 33. EUROPE FIBER-REINFORCED CONCRETE (FRC) MARKET, BY PROCESS, 2022-2032 ($MILLION)
- TABLE 34. EUROPE FIBER-REINFORCED CONCRETE (FRC) MARKET, BY APPLICATION, 2022-2032 ($MILLION)
- TABLE 35. EUROPE FIBER-REINFORCED CONCRETE (FRC) MARKET, BY COUNTRY, 2022-2032 ($MILLION)
- TABLE 36. GERMANY FIBER-REINFORCED CONCRETE (FRC) MARKET, BY TYPE, 2022-2032 ($MILLION)
- TABLE 37. GERMANY FIBER-REINFORCED CONCRETE (FRC) MARKET, BY PROCESS, 2022-2032 ($MILLION)
- TABLE 38. GERMANY FIBER-REINFORCED CONCRETE (FRC) MARKET, BY APPLICATION, 2022-2032 ($MILLION)
- TABLE 39. FRANCE FIBER-REINFORCED CONCRETE (FRC) MARKET, BY TYPE, 2022-2032 ($MILLION)
- TABLE 40. FRANCE FIBER-REINFORCED CONCRETE (FRC) MARKET, BY PROCESS, 2022-2032 ($MILLION)
- TABLE 41. FRANCE FIBER-REINFORCED CONCRETE (FRC) MARKET, BY APPLICATION, 2022-2032 ($MILLION)
- TABLE 42. ITALY FIBER-REINFORCED CONCRETE (FRC) MARKET, BY TYPE, 2022-2032 ($MILLION)
- TABLE 43. ITALY FIBER-REINFORCED CONCRETE (FRC) MARKET, BY PROCESS, 2022-2032 ($MILLION)
- TABLE 44. ITALY FIBER-REINFORCED CONCRETE (FRC) MARKET, BY APPLICATION, 2022-2032 ($MILLION)
- TABLE 45. UK FIBER-REINFORCED CONCRETE (FRC) MARKET, BY TYPE, 2022-2032 ($MILLION)
- TABLE 46. UK FIBER-REINFORCED CONCRETE (FRC) MARKET, BY PROCESS, 2022-2032 ($MILLION)
- TABLE 47. UK FIBER-REINFORCED CONCRETE (FRC) MARKET, BY APPLICATION, 2022-2032 ($MILLION)
- TABLE 48. REST OF EUROPE FIBER-REINFORCED CONCRETE (FRC) MARKET, BY TYPE, 2022-2032 ($MILLION)
- TABLE 49. REST OF EUROPE FIBER-REINFORCED CONCRETE (FRC) MARKET, BY PROCESS, 2022-2032 ($MILLION)
- TABLE 50. REST OF EUROPE FIBER-REINFORCED CONCRETE (FRC) MARKET, BY APPLICATION, 2022-2032 ($MILLION)
- TABLE 51. ASIA-PACIFIC FIBER-REINFORCED CONCRETE (FRC) MARKET, BY TYPE, 2022-2032 ($MILLION)
- TABLE 52. ASIA-PACIFIC FIBER-REINFORCED CONCRETE (FRC) MARKET, BY PROCESS, 2022-2032 ($MILLION)
- TABLE 53. ASIA-PACIFIC FIBER-REINFORCED CONCRETE (FRC) MARKET, BY APPLICATION, 2022-2032 ($MILLION)
- TABLE 54. ASIA-PACIFIC FIBER-REINFORCED CONCRETE (FRC) MARKET, BY COUNTRY, 2022-2032 ($MILLION)
- TABLE 55. CHINA FIBER-REINFORCED CONCRETE (FRC) MARKET, BY TYPE, 2022-2032 ($MILLION)
- TABLE 56. CHINA FIBER-REINFORCED CONCRETE (FRC) MARKET, BY PROCESS, 2022-2032 ($MILLION)
- TABLE 57. CHINA FIBER-REINFORCED CONCRETE (FRC) MARKET, BY APPLICATION, 2022-2032 ($MILLION)
- TABLE 58. JAPAN FIBER-REINFORCED CONCRETE (FRC) MARKET, BY TYPE, 2022-2032 ($MILLION)
- TABLE 59. JAPAN FIBER-REINFORCED CONCRETE (FRC) MARKET, BY PROCESS, 2022-2032 ($MILLION)
- TABLE 60. JAPAN FIBER-REINFORCED CONCRETE (FRC) MARKET, BY APPLICATION, 2022-2032 ($MILLION)
- TABLE 61. INDIA FIBER-REINFORCED CONCRETE (FRC) MARKET, BY TYPE, 2022-2032 ($MILLION)
- TABLE 62. INDIA FIBER-REINFORCED CONCRETE (FRC) MARKET, BY PROCESS, 2022-2032 ($MILLION)
- TABLE 63. INDIA FIBER-REINFORCED CONCRETE (FRC) MARKET, BY APPLICATION, 2022-2032 ($MILLION)
- TABLE 64. SOUTH KOREA FIBER-REINFORCED CONCRETE (FRC) MARKET, BY TYPE, 2022-2032 ($MILLION)
- TABLE 65. SOUTH KOREA FIBER-REINFORCED CONCRETE (FRC) MARKET, BY PROCESS, 2022-2032 ($MILLION)
- TABLE 66. SOUTH KOREA FIBER-REINFORCED CONCRETE (FRC) MARKET, BY APPLICATION, 2022-2032 ($MILLION)
- TABLE 67. REST OF ASIA-PACIFIC FIBER-REINFORCED CONCRETE (FRC) MARKET, BY TYPE, 2022-2032 ($MILLION)
- TABLE 68. REST OF ASIA-PACIFIC FIBER-REINFORCED CONCRETE (FRC) MARKET, BY PROCESS, 2022-2032 ($MILLION)
- TABLE 69. REST OF ASIA-PACIFIC FIBER-REINFORCED CONCRETE (FRC) MARKET, BY APPLICATION, 2022-2032 ($MILLION)
- TABLE 70. LATIN AMERICA FIBER-REINFORCED CONCRETE (FRC) MARKET, BY TYPE, 2022-2032 ($MILLION)
- TABLE 71. LATIN AMERICA FIBER-REINFORCED CONCRETE (FRC) MARKET, BY PROCESS, 2022-2032 ($MILLION)
- TABLE 72. LATIN AMERICA FIBER-REINFORCED CONCRETE (FRC) MARKET, BY APPLICATION, 2022-2032 ($MILLION)
- TABLE 73. LATIN AMERICA FIBER-REINFORCED CONCRETE (FRC) MARKET, BY COUNTRY, 2022-2032 ($MILLION)
- TABLE 74. BRAZIL FIBER-REINFORCED CONCRETE (FRC) MARKET, BY TYPE, 2022-2032 ($MILLION)
- TABLE 75. BRAZIL FIBER-REINFORCED CONCRETE (FRC) MARKET, BY PROCESS, 2022-2032 ($MILLION)
- TABLE 76. BRAZIL FIBER-REINFORCED CONCRETE (FRC) MARKET, BY APPLICATION, 2022-2032 ($MILLION)
- TABLE 77. CHILE FIBER-REINFORCED CONCRETE (FRC) MARKET, BY TYPE, 2022-2032 ($MILLION)
- TABLE 78. CHILE FIBER-REINFORCED CONCRETE (FRC) MARKET, BY PROCESS, 2022-2032 ($MILLION)
- TABLE 79. CHILE FIBER-REINFORCED CONCRETE (FRC) MARKET, BY APPLICATION, 2022-2032 ($MILLION)
- TABLE 80. REST OF LATIN AMERICA FIBER-REINFORCED CONCRETE (FRC) MARKET, BY TYPE, 2022-2032 ($MILLION)
- TABLE 81. REST OF LATIN AMERICA FIBER-REINFORCED CONCRETE (FRC) MARKET, BY PROCESS, 2022-2032 ($MILLION)
- TABLE 82. REST OF LATIN AMERICA FIBER-REINFORCED CONCRETE (FRC) MARKET, BY APPLICATION, 2022-2032 ($MILLION)
- TABLE 83. MIDDLE EAST AND AFRICA FIBER-REINFORCED CONCRETE (FRC) MARKET, BY TYPE, 2022-2032 ($MILLION)
- TABLE 84. MIDDLE EAST AND AFRICA FIBER-REINFORCED CONCRETE (FRC) MARKET, BY PROCESS, 2022-2032 ($MILLION)
- TABLE 85. MIDDLE EAST AND AFRICA FIBER-REINFORCED CONCRETE (FRC) MARKET, BY APPLICATION, 2022-2032 ($MILLION)
- TABLE 86. MIDDLE EAST AND AFRICA FIBER-REINFORCED CONCRETE (FRC) MARKET, BY COUNTRY, 2022-2032 ($MILLION)
- TABLE 87. SAUDI ARABIA FIBER-REINFORCED CONCRETE (FRC) MARKET, BY TYPE, 2022-2032 ($MILLION)
- TABLE 88. SAUDI ARABIA FIBER-REINFORCED CONCRETE (FRC) MARKET, BY PROCESS, 2022-2032 ($MILLION)
- TABLE 89. SAUDI ARABIA FIBER-REINFORCED CONCRETE (FRC) MARKET, BY APPLICATION, 2022-2032 ($MILLION)
- TABLE 90. UAE FIBER-REINFORCED CONCRETE (FRC) MARKET, BY TYPE, 2022-2032 ($MILLION)
- TABLE 91. UAE FIBER-REINFORCED CONCRETE (FRC) MARKET, BY PROCESS, 2022-2032 ($MILLION)
- TABLE 92. UAE FIBER-REINFORCED CONCRETE (FRC) MARKET, BY APPLICATION, 2022-2032 ($MILLION)
- TABLE 93. NIGERIA FIBER-REINFORCED CONCRETE (FRC) MARKET, BY TYPE, 2022-2032 ($MILLION)
- TABLE 94. NIGERIA FIBER-REINFORCED CONCRETE (FRC) MARKET, BY PROCESS, 2022-2032 ($MILLION)
- TABLE 95. NIGERIA FIBER-REINFORCED CONCRETE (FRC) MARKET, BY APPLICATION, 2022-2032 ($MILLION)
- TABLE 96. SOUTH AFRICA FIBER-REINFORCED CONCRETE (FRC) MARKET, BY TYPE, 2022-2032 ($MILLION)
- TABLE 97. SOUTH AFRICA FIBER-REINFORCED CONCRETE (FRC) MARKET, BY PROCESS, 2022-2032 ($MILLION)
- TABLE 98. SOUTH AFRICA FIBER-REINFORCED CONCRETE (FRC) MARKET, BY APPLICATION, 2022-2032 ($MILLION)
- TABLE 99. REST OF MIDDLE EAST AND AFRICA FIBER-REINFORCED CONCRETE (FRC) MARKET, BY TYPE, 2022-2032 ($MILLION)
- TABLE 100. REST OF MIDDLE EAST AND AFRICA FIBER-REINFORCED CONCRETE (FRC) MARKET, BY PROCESS, 2022-2032 ($MILLION)
- TABLE 101. REST OF MIDDLE EAST AND AFRICA FIBER-REINFORCED CONCRETE (FRC) MARKET, BY APPLICATION, 2022-2032 ($MILLION)
- TABLE 102. FIBREX CONSTRUCTION GROUP: KEY EXECUTIVES
- TABLE 103. FIBREX CONSTRUCTION GROUP: COMPANY SNAPSHOT
- TABLE 104. FIBREX CONSTRUCTION GROUP: PRODUCT SEGMENTS
- TABLE 105. FIBREX CONSTRUCTION GROUP: SERVICE SEGMENTS
- TABLE 106. FIBREX CONSTRUCTION GROUP: PRODUCT PORTFOLIO
- TABLE 107. FIBREX CONSTRUCTION GROUP: KEY STRATERGIES
- TABLE 108. CLARK PACIFIC: KEY EXECUTIVES
- TABLE 109. CLARK PACIFIC: COMPANY SNAPSHOT
- TABLE 110. CLARK PACIFIC: PRODUCT SEGMENTS
- TABLE 111. CLARK PACIFIC: SERVICE SEGMENTS
- TABLE 112. CLARK PACIFIC: PRODUCT PORTFOLIO
- TABLE 113. CLARK PACIFIC: KEY STRATERGIES
- TABLE 114. ULTRATECH CEMENT LTD.: KEY EXECUTIVES
- TABLE 115. ULTRATECH CEMENT LTD.: COMPANY SNAPSHOT
- TABLE 116. ULTRATECH CEMENT LTD.: PRODUCT SEGMENTS
- TABLE 117. ULTRATECH CEMENT LTD.: SERVICE SEGMENTS
- TABLE 118. ULTRATECH CEMENT LTD.: PRODUCT PORTFOLIO
- TABLE 119. ULTRATECH CEMENT LTD.: KEY STRATERGIES
- TABLE 120. FORMGLAS PRODUCTS LTD.: KEY EXECUTIVES
- TABLE 121. FORMGLAS PRODUCTS LTD.: COMPANY SNAPSHOT
- TABLE 122. FORMGLAS PRODUCTS LTD.: PRODUCT SEGMENTS
- TABLE 123. FORMGLAS PRODUCTS LTD.: SERVICE SEGMENTS
- TABLE 124. FORMGLAS PRODUCTS LTD.: PRODUCT PORTFOLIO
- TABLE 125. FORMGLAS PRODUCTS LTD.: KEY STRATERGIES
- TABLE 126. WILLIS CONSTRUCTION CO. INC.: KEY EXECUTIVES
- TABLE 127. WILLIS CONSTRUCTION CO. INC.: COMPANY SNAPSHOT
- TABLE 128. WILLIS CONSTRUCTION CO. INC.: PRODUCT SEGMENTS
- TABLE 129. WILLIS CONSTRUCTION CO. INC.: SERVICE SEGMENTS
- TABLE 130. WILLIS CONSTRUCTION CO. INC.: PRODUCT PORTFOLIO
- TABLE 131. WILLIS CONSTRUCTION CO. INC.: KEY STRATERGIES
- TABLE 132. STROMBERG ARCHITECTURAL: KEY EXECUTIVES
- TABLE 133. STROMBERG ARCHITECTURAL: COMPANY SNAPSHOT
- TABLE 134. STROMBERG ARCHITECTURAL: PRODUCT SEGMENTS
- TABLE 135. STROMBERG ARCHITECTURAL: SERVICE SEGMENTS
- TABLE 136. STROMBERG ARCHITECTURAL: PRODUCT PORTFOLIO
- TABLE 137. STROMBERG ARCHITECTURAL: KEY STRATERGIES
- TABLE 138. BB FIBERBETON: KEY EXECUTIVES
- TABLE 139. BB FIBERBETON: COMPANY SNAPSHOT
- TABLE 140. BB FIBERBETON: PRODUCT SEGMENTS
- TABLE 141. BB FIBERBETON: SERVICE SEGMENTS
- TABLE 142. BB FIBERBETON: PRODUCT PORTFOLIO
- TABLE 143. BB FIBERBETON: KEY STRATERGIES
- TABLE 144. GENERALE PREFABBRICATI S.P.A.: KEY EXECUTIVES
- TABLE 145. GENERALE PREFABBRICATI S.P.A.: COMPANY SNAPSHOT
- TABLE 146. GENERALE PREFABBRICATI S.P.A.: PRODUCT SEGMENTS
- TABLE 147. GENERALE PREFABBRICATI S.P.A.: SERVICE SEGMENTS
- TABLE 148. GENERALE PREFABBRICATI S.P.A.: PRODUCT PORTFOLIO
- TABLE 149. GENERALE PREFABBRICATI S.P.A.: KEY STRATERGIES
- TABLE 150. BARCHIP PTY LTD: KEY EXECUTIVES
- TABLE 151. BARCHIP PTY LTD: COMPANY SNAPSHOT
- TABLE 152. BARCHIP PTY LTD: PRODUCT SEGMENTS
- TABLE 153. BARCHIP PTY LTD: SERVICE SEGMENTS
- TABLE 154. BARCHIP PTY LTD: PRODUCT PORTFOLIO
- TABLE 155. BARCHIP PTY LTD: KEY STRATERGIES
- TABLE 156. GRCUK: KEY EXECUTIVES
- TABLE 157. GRCUK: COMPANY SNAPSHOT
- TABLE 158. GRCUK: PRODUCT SEGMENTS
- TABLE 159. GRCUK: SERVICE SEGMENTS
- TABLE 160. GRCUK: PRODUCT PORTFOLIO
- TABLE 161. GRCUK: KEY STRATERGIES
LIST OF FIGURES
- FIGURE 01. FIBER-REINFORCED CONCRETE (FRC) MARKET, 2022-2032
- FIGURE 02. SEGMENTATION OF FIBER-REINFORCED CONCRETE (FRC) MARKET,2022-2032
- FIGURE 03. TOP IMPACTING FACTORS IN FIBER-REINFORCED CONCRETE (FRC) MARKET
- FIGURE 04. TOP INVESTMENT POCKETS IN FIBER-REINFORCED CONCRETE (FRC) MARKET (2023-2032)
- FIGURE 05. BARGAINING POWER OF SUPPLIERS
- FIGURE 06. BARGAINING POWER OF BUYERS
- FIGURE 07. THREAT OF SUBSTITUTION
- FIGURE 08. THREAT OF SUBSTITUTION
- FIGURE 09. COMPETITIVE RIVALRY
- FIGURE 10. GLOBAL FIBER-REINFORCED CONCRETE (FRC) MARKET:DRIVERS, RESTRAINTS AND OPPORTUNITIES
- FIGURE 11. FIBER-REINFORCED CONCRETE (FRC) MARKET, BY TYPE, 2022 AND 2032(%)
- FIGURE 12. COMPARATIVE SHARE ANALYSIS OF FIBER-REINFORCED CONCRETE (FRC) MARKET FOR NATURAL FIBER, BY COUNTRY 2022 AND 2032(%)
- FIGURE 13. COMPARATIVE SHARE ANALYSIS OF FIBER-REINFORCED CONCRETE (FRC) MARKET FOR SYNTHETIC FIBER, BY COUNTRY 2022 AND 2032(%)
- FIGURE 14. COMPARATIVE SHARE ANALYSIS OF FIBER-REINFORCED CONCRETE (FRC) MARKET FOR GLASS FIBER, BY COUNTRY 2022 AND 2032(%)
- FIGURE 15. COMPARATIVE SHARE ANALYSIS OF FIBER-REINFORCED CONCRETE (FRC) MARKET FOR STEEL FIBER, BY COUNTRY 2022 AND 2032(%)
- FIGURE 16. COMPARATIVE SHARE ANALYSIS OF FIBER-REINFORCED CONCRETE (FRC) MARKET FOR OTHERS, BY COUNTRY 2022 AND 2032(%)
- FIGURE 17. FIBER-REINFORCED CONCRETE (FRC) MARKET, BY PROCESS, 2022 AND 2032(%)
- FIGURE 18. COMPARATIVE SHARE ANALYSIS OF FIBER-REINFORCED CONCRETE (FRC) MARKET FOR PREMIX, BY COUNTRY 2022 AND 2032(%)
- FIGURE 19. COMPARATIVE SHARE ANALYSIS OF FIBER-REINFORCED CONCRETE (FRC) MARKET FOR SPRAYED, BY COUNTRY 2022 AND 2032(%)
- FIGURE 20. COMPARATIVE SHARE ANALYSIS OF FIBER-REINFORCED CONCRETE (FRC) MARKET FOR HYBRID, BY COUNTRY 2022 AND 2032(%)
- FIGURE 21. COMPARATIVE SHARE ANALYSIS OF FIBER-REINFORCED CONCRETE (FRC) MARKET FOR OTHERS, BY COUNTRY 2022 AND 2032(%)
- FIGURE 22. FIBER-REINFORCED CONCRETE (FRC) MARKET, BY APPLICATION, 2022 AND 2032(%)
- FIGURE 23. COMPARATIVE SHARE ANALYSIS OF FIBER-REINFORCED CONCRETE (FRC) MARKET FOR INFRASTRUCTURE, BY COUNTRY 2022 AND 2032(%)
- FIGURE 24. COMPARATIVE SHARE ANALYSIS OF FIBER-REINFORCED CONCRETE (FRC) MARKET FOR BUILDING AND CONSTRUCTION, BY COUNTRY 2022 AND 2032(%)
- FIGURE 25. COMPARATIVE SHARE ANALYSIS OF FIBER-REINFORCED CONCRETE (FRC) MARKET FOR MINING AND TUNNEL, BY COUNTRY 2022 AND 2032(%)
- FIGURE 26. COMPARATIVE SHARE ANALYSIS OF FIBER-REINFORCED CONCRETE (FRC) MARKET FOR INDUSTRIAL, BY COUNTRY 2022 AND 2032(%)
- FIGURE 27. COMPARATIVE SHARE ANALYSIS OF FIBER-REINFORCED CONCRETE (FRC) MARKET FOR OTHERS, BY COUNTRY 2022 AND 2032(%)
- FIGURE 28. FIBER-REINFORCED CONCRETE (FRC) MARKET BY REGION, 2022 AND 2032(%)
- FIGURE 29. U.S. FIBER-REINFORCED CONCRETE (FRC) MARKET, 2022-2032 ($MILLION)
- FIGURE 30. CANADA FIBER-REINFORCED CONCRETE (FRC) MARKET, 2022-2032 ($MILLION)
- FIGURE 31. MEXICO FIBER-REINFORCED CONCRETE (FRC) MARKET, 2022-2032 ($MILLION)
- FIGURE 32. GERMANY FIBER-REINFORCED CONCRETE (FRC) MARKET, 2022-2032 ($MILLION)
- FIGURE 33. FRANCE FIBER-REINFORCED CONCRETE (FRC) MARKET, 2022-2032 ($MILLION)
- FIGURE 34. ITALY FIBER-REINFORCED CONCRETE (FRC) MARKET, 2022-2032 ($MILLION)
- FIGURE 35. UK FIBER-REINFORCED CONCRETE (FRC) MARKET, 2022-2032 ($MILLION)
- FIGURE 36. REST OF EUROPE FIBER-REINFORCED CONCRETE (FRC) MARKET, 2022-2032 ($MILLION)
- FIGURE 37. CHINA FIBER-REINFORCED CONCRETE (FRC) MARKET, 2022-2032 ($MILLION)
- FIGURE 38. JAPAN FIBER-REINFORCED CONCRETE (FRC) MARKET, 2022-2032 ($MILLION)
- FIGURE 39. INDIA FIBER-REINFORCED CONCRETE (FRC) MARKET, 2022-2032 ($MILLION)
- FIGURE 40. SOUTH KOREA FIBER-REINFORCED CONCRETE (FRC) MARKET, 2022-2032 ($MILLION)
- FIGURE 41. REST OF ASIA-PACIFIC FIBER-REINFORCED CONCRETE (FRC) MARKET, 2022-2032 ($MILLION)
- FIGURE 42. BRAZIL FIBER-REINFORCED CONCRETE (FRC) MARKET, 2022-2032 ($MILLION)
- FIGURE 43. CHILE FIBER-REINFORCED CONCRETE (FRC) MARKET, 2022-2032 ($MILLION)
- FIGURE 44. REST OF LATIN AMERICA FIBER-REINFORCED CONCRETE (FRC) MARKET, 2022-2032 ($MILLION)
- FIGURE 45. SAUDI ARABIA FIBER-REINFORCED CONCRETE (FRC) MARKET, 2022-2032 ($MILLION)
- FIGURE 46. UAE FIBER-REINFORCED CONCRETE (FRC) MARKET, 2022-2032 ($MILLION)
- FIGURE 47. NIGERIA FIBER-REINFORCED CONCRETE (FRC) MARKET, 2022-2032 ($MILLION)
- FIGURE 48. SOUTH AFRICA FIBER-REINFORCED CONCRETE (FRC) MARKET, 2022-2032 ($MILLION)
- FIGURE 49. REST OF MIDDLE EAST AND AFRICA FIBER-REINFORCED CONCRETE (FRC) MARKET, 2022-2032 ($MILLION)
- FIGURE 50. TOP WINNING STRATEGIES, BY YEAR
- FIGURE 51. TOP WINNING STRATEGIES, BY DEVELOPMENT
- FIGURE 52. TOP WINNING STRATEGIES, BY COMPANY
- FIGURE 53. PRODUCT MAPPING OF TOP 10 PLAYERS
- FIGURE 54. COMPETITIVE DASHBOARD
- FIGURE 55. COMPETITIVE HEATMAP: FIBER-REINFORCED CONCRETE (FRC) MARKET
- FIGURE 56. TOP PLAYER POSITIONING, 2022

