
PUBLISHER: Allied Market Research | PRODUCT CODE: 1446935

PUBLISHER: Allied Market Research | PRODUCT CODE: 1446935
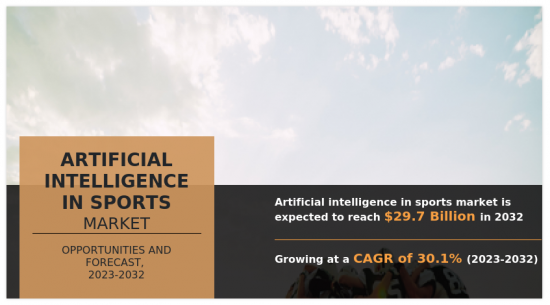
Artificial Intelligence in Sports Market By Component, By Deployment Model, By Technology, By Application, By Game Type : Global Opportunity Analysis and Industry Forecast, 2023-2032
Artificial intelligence (AI) in sports covers post-game analysis, in-game activity, and even the fan experience. AI is further being used to enhance the performance of players. Apps such as HomeCourt, ESPN Player and MaxOne (M1) AI SmartCoach make use of computer vision and machine learning to assess basketball players' skills, giving them a good medium to improve their game. In addition, the recording of these performance metrics of athletes helps players to understand the areas where the player has maximum potential to excel and the areas that still need improvement.
The report covers the study of AI in sports market along with its component, deployment mode, technology, application and sports type. The research involves a study of AI in sports solutions, which includes revenue realized from the sale of commercial licenses as well as revenue realized from the upgrade charges of open-source AI in sports solutions. The applications of the artificial neural network solutions considered in the report are image recognition, fraud detection, and data mining processes.
In addition, there are several advantages to using AI technology, including gains in production and efficiency. AI-powered solutions can continuously monitor systems, endpoints, and networks, enabling swift response and real-time visibility into any security breaches. This further leads to more accurate and effective sports operations. In addition, the increase in demand for behavioral analysis in several industries further contributes to driving growth of the global market. The AI systems are more trained, that further reduced the chances of false positives by improving accuracy of the sports solutions. Such enhanced factors are expected to provide lucrative opportunities for market growth during the forecast period. In addition, the integration of intelligent AI solutions in various applications has the potential to create several benefits for businesses and end users. Moreover, these numerous benefits provide enhanced customer convenience and a better security experience. Consequently, AI in sports technology is gaining significant adoption to increase the use of automation systems among business operators. These factors actively impact the growth of the market in the forecast period. Additionally, the growing trend of digitally enabled solutions is the major factor driving the market growth.
Moreover, the surge in usage of IoT devices in various applications and rising amount of data generated by these internet devices creates lucrative opportunities for the global AI in sports market. Moreover, growing demand for flexible security services across businesses is expected to fuel the growth of the market during the forecast period. Furthermore, the rise in visualization tools for security data is also arising, which further is expected to provide lucrative growth opportunities for the market in the forecast period.
Increase in demand for monitoring and tracking data of players and surge in need for chatbots & virtual assistants to interact with followers act as the key driving forces of the global artificial intelligence in sports market. In addition, the expansion popular for ongoing information investigation decidedly influences the development of the market. However, the absence of prepared and talented experts and high execution and upkeep costs hamper the market development. On the contrary, surge in demand of AI for making future predictions is expected to offer remunerative opportunities for expansion of the market during the forecast period.
The artificial intelligence in sports market is segmented into component, deployment model, technology, application, game type, and region. Depending on the component, the market is bifurcated into software and services. By deployment model, it is categorized on-premises and cloud. On the basis of technology, it is fragmented into machine learning, natural language processing, computer vision, data analytics, and others. By application, it is segregated into game planning, game strategies, performance improvement, injury prevention sports recruitment, and others. As per game type, it is classified into football, cricket, tennis, basketball, baseball, and others. Region wise, it is analyzed across North America, Europe, Asia-Pacific, and LAMEA.
Competitive analysis and profiles of the major players in the artificial intelligence in sports market are Catapult Group International Ltd., Facebook Inc., IBM Corporation, Microsoft Corporation, Salesforce.com Inc., SAP SE, SAS Institute Inc., Sportradar AG, Stats Perform, and Trumedia Networks. These major players have adopted various key development strategies such as business expansion, new product launches, and partnerships, which help to drive the growth of artificial intelligence in sports market globally.
KEY BENEFITS FOR STAKEHOLDERS
- The study provides an in-depth analysis of the AI in sports market forecast along with the current and future trends to explain the imminent investment pockets.
- Information about key drivers, restraints, and opportunities and their impact analysis on AI in sports market trends is provided in the report.
- The Porter's five forces analysis illustrates the potency of the buyers and suppliers operating in the industry.
- The quantitative analysis of the AI in sports market from 2022 to 2032 is provided to determine the market potential.
Additional benefits you will get with this purchase are:
- Quarterly Update and* (only available with a corporate license, on listed price)
- 5 additional Company Profile of client Choice pre- or Post-purchase, as a free update.
- Free Upcoming Version on the Purchase of Five and Enterprise User License.
- 16 analyst hours of support* (post-purchase, if you find additional data requirements upon review of the report, you may receive support amounting to 16 analyst hours to solve questions, and post-sale queries)
- 15% Free Customization* (in case the scope or segment of the report does not match your requirements, 15% is equivalent to 3 working days of free work, applicable once)
- Free data Pack on the Five and Enterprise User License. (Excel version of the report)
- Free Updated report if the report is 6-12 months old or older.
- 24-hour priority response*
- Free Industry updates and white papers.
Possible Customization with this report (with additional cost and timeline, please talk to the sales executive to know more)
- Investment Opportunities
- Market share analysis of players by products/segments
- Regulatory Guidelines
- Additional company profiles with specific to client's interest
- Additional country or region analysis- market size and forecast
- Market share analysis of players at global/region/country level
- SWOT Analysis
Key Market Segments
By Component
- Software
- Service
By Deployment Model
- On-premise
- Cloud
By Technology
- Machine Learning
- Natural Language Processing
- Computer Vision
- Data Analytics
- Others
By Application
- Game Planning
- Game Strategies
- Performance Improvement
- Injury Prevention
- Sports Recruitment
- Others
By Game Type
- Football
- Cricket
- Tennis
- Basketball
- Baseball
- Others
By Region
- North America
- U.S.
- Canada
- Europe
- UK
- Germany
- France
- Italy
- Spain
- Rest of Europe
- Asia-Pacific
- China
- Japan
- India
- Australia
- South Korea
- Rest of Asia-Pacific
- LAMEA
- Latin America
- Middle East
- Africa
Key Market Players:
- Meta Platforms, Inc.
- IBM Corporation
- Microsoft Corporation
- SAP SE
- SAS Institute Inc
- Stats Perform
- Catapult Group International Limited.
- TruMedia Networks
- Salesforce.com Inc.
- Sportradar AG
TABLE OF CONTENTS
CHAPTER 1: INTRODUCTION
- 1.1. Report description
- 1.2. Key market segments
- 1.3. Key benefits to the stakeholders
- 1.4. Research methodology
- 1.4.1. Primary research
- 1.4.2. Secondary research
- 1.4.3. Analyst tools and models
CHAPTER 2: EXECUTIVE SUMMARY
- 2.1. CXO Perspective
CHAPTER 3: MARKET OVERVIEW
- 3.1. Market definition and scope
- 3.2. Key findings
- 3.2.1. Top impacting factors
- 3.2.2. Top investment pockets
- 3.3. Porter's five forces analysis
- 3.3.1. Low bargaining power of suppliers
- 3.3.2. Low threat of new entrants
- 3.3.3. Low threat of substitutes
- 3.3.4. Low intensity of rivalry
- 3.3.5. Low bargaining power of buyers
- 3.4. Market dynamics
- 3.4.1. Drivers
- 3.4.1.1. Increase in demand for monitoring and tracking data of players
- 3.4.1.2. Surge in demand for chatbots and virtual assistants to interact with followers
- 3.4.1.3. Rise in demand for real-time data analytics
- 3.4.2. Restraints
- 3.4.2.1. Lack of trained & skilled professionals
- 3.4.2.2. High implementation and maintenance cost
- 3.4.3. Opportunities
- 3.4.3.1. Upsurge in demand for AI to make future predictions
- 3.4.1. Drivers
CHAPTER 4: ARTIFICIAL INTELLIGENCE IN SPORTS MARKET, BY COMPONENT
- 4.1. Overview
- 4.1.1. Market size and forecast
- 4.2. Software
- 4.2.1. Key market trends, growth factors and opportunities
- 4.2.2. Market size and forecast, by region
- 4.2.3. Market share analysis by country
- 4.3. Service
- 4.3.1. Key market trends, growth factors and opportunities
- 4.3.2. Market size and forecast, by region
- 4.3.3. Market share analysis by country
CHAPTER 5: ARTIFICIAL INTELLIGENCE IN SPORTS MARKET, BY DEPLOYMENT MODEL
- 5.1. Overview
- 5.1.1. Market size and forecast
- 5.2. On-premise
- 5.2.1. Key market trends, growth factors and opportunities
- 5.2.2. Market size and forecast, by region
- 5.2.3. Market share analysis by country
- 5.3. Cloud
- 5.3.1. Key market trends, growth factors and opportunities
- 5.3.2. Market size and forecast, by region
- 5.3.3. Market share analysis by country
CHAPTER 6: ARTIFICIAL INTELLIGENCE IN SPORTS MARKET, BY TECHNOLOGY
- 6.1. Overview
- 6.1.1. Market size and forecast
- 6.2. Machine Learning
- 6.2.1. Key market trends, growth factors and opportunities
- 6.2.2. Market size and forecast, by region
- 6.2.3. Market share analysis by country
- 6.3. Natural Language Processing
- 6.3.1. Key market trends, growth factors and opportunities
- 6.3.2. Market size and forecast, by region
- 6.3.3. Market share analysis by country
- 6.4. Computer Vision
- 6.4.1. Key market trends, growth factors and opportunities
- 6.4.2. Market size and forecast, by region
- 6.4.3. Market share analysis by country
- 6.5. Data Analytics
- 6.5.1. Key market trends, growth factors and opportunities
- 6.5.2. Market size and forecast, by region
- 6.5.3. Market share analysis by country
- 6.6. Others
- 6.6.1. Key market trends, growth factors and opportunities
- 6.6.2. Market size and forecast, by region
- 6.6.3. Market share analysis by country
CHAPTER 7: ARTIFICIAL INTELLIGENCE IN SPORTS MARKET, BY APPLICATION
- 7.1. Overview
- 7.1.1. Market size and forecast
- 7.2. Game Planning
- 7.2.1. Key market trends, growth factors and opportunities
- 7.2.2. Market size and forecast, by region
- 7.2.3. Market share analysis by country
- 7.3. Game Strategies
- 7.3.1. Key market trends, growth factors and opportunities
- 7.3.2. Market size and forecast, by region
- 7.3.3. Market share analysis by country
- 7.4. Performance Improvement
- 7.4.1. Key market trends, growth factors and opportunities
- 7.4.2. Market size and forecast, by region
- 7.4.3. Market share analysis by country
- 7.5. Injury Prevention
- 7.5.1. Key market trends, growth factors and opportunities
- 7.5.2. Market size and forecast, by region
- 7.5.3. Market share analysis by country
- 7.6. Sports Recruitment
- 7.6.1. Key market trends, growth factors and opportunities
- 7.6.2. Market size and forecast, by region
- 7.6.3. Market share analysis by country
- 7.7. Others
- 7.7.1. Key market trends, growth factors and opportunities
- 7.7.2. Market size and forecast, by region
- 7.7.3. Market share analysis by country
CHAPTER 8: ARTIFICIAL INTELLIGENCE IN SPORTS MARKET, BY GAME TYPE
- 8.1. Overview
- 8.1.1. Market size and forecast
- 8.2. Football
- 8.2.1. Key market trends, growth factors and opportunities
- 8.2.2. Market size and forecast, by region
- 8.2.3. Market share analysis by country
- 8.3. Cricket
- 8.3.1. Key market trends, growth factors and opportunities
- 8.3.2. Market size and forecast, by region
- 8.3.3. Market share analysis by country
- 8.4. Tennis
- 8.4.1. Key market trends, growth factors and opportunities
- 8.4.2. Market size and forecast, by region
- 8.4.3. Market share analysis by country
- 8.5. Basketball
- 8.5.1. Key market trends, growth factors and opportunities
- 8.5.2. Market size and forecast, by region
- 8.5.3. Market share analysis by country
- 8.6. Baseball
- 8.6.1. Key market trends, growth factors and opportunities
- 8.6.2. Market size and forecast, by region
- 8.6.3. Market share analysis by country
- 8.7. Others
- 8.7.1. Key market trends, growth factors and opportunities
- 8.7.2. Market size and forecast, by region
- 8.7.3. Market share analysis by country
CHAPTER 9: ARTIFICIAL INTELLIGENCE IN SPORTS MARKET, BY REGION
- 9.1. Overview
- 9.1.1. Market size and forecast By Region
- 9.2. North America
- 9.2.1. Key market trends, growth factors and opportunities
- 9.2.2. Market size and forecast, by Component
- 9.2.3. Market size and forecast, by Deployment Model
- 9.2.4. Market size and forecast, by Technology
- 9.2.5. Market size and forecast, by Application
- 9.2.6. Market size and forecast, by Game Type
- 9.2.7. Market size and forecast, by country
- 9.2.7.1. U.S.
- 9.2.7.1.1. Market size and forecast, by Component
- 9.2.7.1.2. Market size and forecast, by Deployment Model
- 9.2.7.1.3. Market size and forecast, by Technology
- 9.2.7.1.4. Market size and forecast, by Application
- 9.2.7.1.5. Market size and forecast, by Game Type
- 9.2.7.2. Canada
- 9.2.7.2.1. Market size and forecast, by Component
- 9.2.7.2.2. Market size and forecast, by Deployment Model
- 9.2.7.2.3. Market size and forecast, by Technology
- 9.2.7.2.4. Market size and forecast, by Application
- 9.2.7.2.5. Market size and forecast, by Game Type
- 9.3. Europe
- 9.3.1. Key market trends, growth factors and opportunities
- 9.3.2. Market size and forecast, by Component
- 9.3.3. Market size and forecast, by Deployment Model
- 9.3.4. Market size and forecast, by Technology
- 9.3.5. Market size and forecast, by Application
- 9.3.6. Market size and forecast, by Game Type
- 9.3.7. Market size and forecast, by country
- 9.3.7.1. UK
- 9.3.7.1.1. Market size and forecast, by Component
- 9.3.7.1.2. Market size and forecast, by Deployment Model
- 9.3.7.1.3. Market size and forecast, by Technology
- 9.3.7.1.4. Market size and forecast, by Application
- 9.3.7.1.5. Market size and forecast, by Game Type
- 9.3.7.2. Germany
- 9.3.7.2.1. Market size and forecast, by Component
- 9.3.7.2.2. Market size and forecast, by Deployment Model
- 9.3.7.2.3. Market size and forecast, by Technology
- 9.3.7.2.4. Market size and forecast, by Application
- 9.3.7.2.5. Market size and forecast, by Game Type
- 9.3.7.3. France
- 9.3.7.3.1. Market size and forecast, by Component
- 9.3.7.3.2. Market size and forecast, by Deployment Model
- 9.3.7.3.3. Market size and forecast, by Technology
- 9.3.7.3.4. Market size and forecast, by Application
- 9.3.7.3.5. Market size and forecast, by Game Type
- 9.3.7.4. Italy
- 9.3.7.4.1. Market size and forecast, by Component
- 9.3.7.4.2. Market size and forecast, by Deployment Model
- 9.3.7.4.3. Market size and forecast, by Technology
- 9.3.7.4.4. Market size and forecast, by Application
- 9.3.7.4.5. Market size and forecast, by Game Type
- 9.3.7.5. Spain
- 9.3.7.5.1. Market size and forecast, by Component
- 9.3.7.5.2. Market size and forecast, by Deployment Model
- 9.3.7.5.3. Market size and forecast, by Technology
- 9.3.7.5.4. Market size and forecast, by Application
- 9.3.7.5.5. Market size and forecast, by Game Type
- 9.3.7.6. Rest of Europe
- 9.3.7.6.1. Market size and forecast, by Component
- 9.3.7.6.2. Market size and forecast, by Deployment Model
- 9.3.7.6.3. Market size and forecast, by Technology
- 9.3.7.6.4. Market size and forecast, by Application
- 9.3.7.6.5. Market size and forecast, by Game Type
- 9.4. Asia-Pacific
- 9.4.1. Key market trends, growth factors and opportunities
- 9.4.2. Market size and forecast, by Component
- 9.4.3. Market size and forecast, by Deployment Model
- 9.4.4. Market size and forecast, by Technology
- 9.4.5. Market size and forecast, by Application
- 9.4.6. Market size and forecast, by Game Type
- 9.4.7. Market size and forecast, by country
- 9.4.7.1. China
- 9.4.7.1.1. Market size and forecast, by Component
- 9.4.7.1.2. Market size and forecast, by Deployment Model
- 9.4.7.1.3. Market size and forecast, by Technology
- 9.4.7.1.4. Market size and forecast, by Application
- 9.4.7.1.5. Market size and forecast, by Game Type
- 9.4.7.2. Japan
- 9.4.7.2.1. Market size and forecast, by Component
- 9.4.7.2.2. Market size and forecast, by Deployment Model
- 9.4.7.2.3. Market size and forecast, by Technology
- 9.4.7.2.4. Market size and forecast, by Application
- 9.4.7.2.5. Market size and forecast, by Game Type
- 9.4.7.3. India
- 9.4.7.3.1. Market size and forecast, by Component
- 9.4.7.3.2. Market size and forecast, by Deployment Model
- 9.4.7.3.3. Market size and forecast, by Technology
- 9.4.7.3.4. Market size and forecast, by Application
- 9.4.7.3.5. Market size and forecast, by Game Type
- 9.4.7.4. Australia
- 9.4.7.4.1. Market size and forecast, by Component
- 9.4.7.4.2. Market size and forecast, by Deployment Model
- 9.4.7.4.3. Market size and forecast, by Technology
- 9.4.7.4.4. Market size and forecast, by Application
- 9.4.7.4.5. Market size and forecast, by Game Type
- 9.4.7.5. South Korea
- 9.4.7.5.1. Market size and forecast, by Component
- 9.4.7.5.2. Market size and forecast, by Deployment Model
- 9.4.7.5.3. Market size and forecast, by Technology
- 9.4.7.5.4. Market size and forecast, by Application
- 9.4.7.5.5. Market size and forecast, by Game Type
- 9.4.7.6. Rest of Asia-Pacific
- 9.4.7.6.1. Market size and forecast, by Component
- 9.4.7.6.2. Market size and forecast, by Deployment Model
- 9.4.7.6.3. Market size and forecast, by Technology
- 9.4.7.6.4. Market size and forecast, by Application
- 9.4.7.6.5. Market size and forecast, by Game Type
- 9.5. LAMEA
- 9.5.1. Key market trends, growth factors and opportunities
- 9.5.2. Market size and forecast, by Component
- 9.5.3. Market size and forecast, by Deployment Model
- 9.5.4. Market size and forecast, by Technology
- 9.5.5. Market size and forecast, by Application
- 9.5.6. Market size and forecast, by Game Type
- 9.5.7. Market size and forecast, by country
- 9.5.7.1. Latin America
- 9.5.7.1.1. Market size and forecast, by Component
- 9.5.7.1.2. Market size and forecast, by Deployment Model
- 9.5.7.1.3. Market size and forecast, by Technology
- 9.5.7.1.4. Market size and forecast, by Application
- 9.5.7.1.5. Market size and forecast, by Game Type
- 9.5.7.2. Middle East
- 9.5.7.2.1. Market size and forecast, by Component
- 9.5.7.2.2. Market size and forecast, by Deployment Model
- 9.5.7.2.3. Market size and forecast, by Technology
- 9.5.7.2.4. Market size and forecast, by Application
- 9.5.7.2.5. Market size and forecast, by Game Type
- 9.5.7.3. Africa
- 9.5.7.3.1. Market size and forecast, by Component
- 9.5.7.3.2. Market size and forecast, by Deployment Model
- 9.5.7.3.3. Market size and forecast, by Technology
- 9.5.7.3.4. Market size and forecast, by Application
- 9.5.7.3.5. Market size and forecast, by Game Type
CHAPTER 10: COMPETITIVE LANDSCAPE
- 10.1. Introduction
- 10.2. Top winning strategies
- 10.3. Product mapping of top 10 player
- 10.4. Competitive dashboard
- 10.5. Competitive heatmap
- 10.6. Top player positioning, 2022
CHAPTER 11: COMPANY PROFILES
- 11.1. Catapult Group International Limited.
- 11.1.1. Company overview
- 11.1.2. Key executives
- 11.1.3. Company snapshot
- 11.1.4. Operating business segments
- 11.1.5. Product portfolio
- 11.1.6. Business performance
- 11.1.7. Key strategic moves and developments
- 11.2. Meta Platforms, Inc.
- 11.2.1. Company overview
- 11.2.2. Key executives
- 11.2.3. Company snapshot
- 11.2.4. Operating business segments
- 11.2.5. Product portfolio
- 11.2.6. Business performance
- 11.2.7. Key strategic moves and developments
- 11.3. IBM Corporation
- 11.3.1. Company overview
- 11.3.2. Key executives
- 11.3.3. Company snapshot
- 11.3.4. Operating business segments
- 11.3.5. Product portfolio
- 11.3.6. Business performance
- 11.3.7. Key strategic moves and developments
- 11.4. Microsoft Corporation
- 11.4.1. Company overview
- 11.4.2. Key executives
- 11.4.3. Company snapshot
- 11.4.4. Operating business segments
- 11.4.5. Product portfolio
- 11.4.6. Business performance
- 11.4.7. Key strategic moves and developments
- 11.5. Salesforce.com Inc.
- 11.5.1. Company overview
- 11.5.2. Key executives
- 11.5.3. Company snapshot
- 11.5.4. Operating business segments
- 11.5.5. Product portfolio
- 11.5.6. Business performance
- 11.5.7. Key strategic moves and developments
- 11.6. SAP SE
- 11.6.1. Company overview
- 11.6.2. Key executives
- 11.6.3. Company snapshot
- 11.6.4. Operating business segments
- 11.6.5. Product portfolio
- 11.6.6. Business performance
- 11.7. SAS Institute Inc
- 11.7.1. Company overview
- 11.7.2. Key executives
- 11.7.3. Company snapshot
- 11.7.4. Operating business segments
- 11.7.5. Product portfolio
- 11.7.6. Key strategic moves and developments
- 11.8. Sportradar AG
- 11.8.1. Company overview
- 11.8.2. Key executives
- 11.8.3. Company snapshot
- 11.8.4. Operating business segments
- 11.8.5. Product portfolio
- 11.8.6. Business performance
- 11.8.7. Key strategic moves and developments
- 11.9. Stats Perform
- 11.9.1. Company overview
- 11.9.2. Key executives
- 11.9.3. Company snapshot
- 11.9.4. Operating business segments
- 11.9.5. Product portfolio
- 11.9.6. Key strategic moves and developments
- 11.10. TruMedia Networks
- 11.10.1. Company overview
- 11.10.2. Key executives
- 11.10.3. Company snapshot
- 11.10.4. Operating business segments
- 11.10.5. Product portfolio
- 11.10.6. Key strategic moves and developments
LIST OF TABLES
- TABLE 01. GLOBAL ARTIFICIAL INTELLIGENCE IN SPORTS MARKET, BY COMPONENT, 2022-2032 ($MILLION)
- TABLE 02. ARTIFICIAL INTELLIGENCE IN SPORTS MARKET FOR SOFTWARE, BY REGION, 2022-2032 ($MILLION)
- TABLE 03. ARTIFICIAL INTELLIGENCE IN SPORTS MARKET FOR SERVICE, BY REGION, 2022-2032 ($MILLION)
- TABLE 04. GLOBAL ARTIFICIAL INTELLIGENCE IN SPORTS MARKET, BY DEPLOYMENT MODEL, 2022-2032 ($MILLION)
- TABLE 05. ARTIFICIAL INTELLIGENCE IN SPORTS MARKET FOR ON-PREMISE, BY REGION, 2022-2032 ($MILLION)
- TABLE 06. ARTIFICIAL INTELLIGENCE IN SPORTS MARKET FOR CLOUD, BY REGION, 2022-2032 ($MILLION)
- TABLE 07. GLOBAL ARTIFICIAL INTELLIGENCE IN SPORTS MARKET, BY TECHNOLOGY, 2022-2032 ($MILLION)
- TABLE 08. ARTIFICIAL INTELLIGENCE IN SPORTS MARKET FOR MACHINE LEARNING, BY REGION, 2022-2032 ($MILLION)
- TABLE 09. ARTIFICIAL INTELLIGENCE IN SPORTS MARKET FOR NATURAL LANGUAGE PROCESSING, BY REGION, 2022-2032 ($MILLION)
- TABLE 10. ARTIFICIAL INTELLIGENCE IN SPORTS MARKET FOR COMPUTER VISION, BY REGION, 2022-2032 ($MILLION)
- TABLE 11. ARTIFICIAL INTELLIGENCE IN SPORTS MARKET FOR DATA ANALYTICS, BY REGION, 2022-2032 ($MILLION)
- TABLE 12. ARTIFICIAL INTELLIGENCE IN SPORTS MARKET FOR OTHERS, BY REGION, 2022-2032 ($MILLION)
- TABLE 13. GLOBAL ARTIFICIAL INTELLIGENCE IN SPORTS MARKET, BY APPLICATION, 2022-2032 ($MILLION)
- TABLE 14. ARTIFICIAL INTELLIGENCE IN SPORTS MARKET FOR GAME PLANNING, BY REGION, 2022-2032 ($MILLION)
- TABLE 15. ARTIFICIAL INTELLIGENCE IN SPORTS MARKET FOR GAME STRATEGIES, BY REGION, 2022-2032 ($MILLION)
- TABLE 16. ARTIFICIAL INTELLIGENCE IN SPORTS MARKET FOR PERFORMANCE IMPROVEMENT, BY REGION, 2022-2032 ($MILLION)
- TABLE 17. ARTIFICIAL INTELLIGENCE IN SPORTS MARKET FOR INJURY PREVENTION, BY REGION, 2022-2032 ($MILLION)
- TABLE 18. ARTIFICIAL INTELLIGENCE IN SPORTS MARKET FOR SPORTS RECRUITMENT, BY REGION, 2022-2032 ($MILLION)
- TABLE 19. ARTIFICIAL INTELLIGENCE IN SPORTS MARKET FOR OTHERS, BY REGION, 2022-2032 ($MILLION)
- TABLE 20. GLOBAL ARTIFICIAL INTELLIGENCE IN SPORTS MARKET, BY GAME TYPE, 2022-2032 ($MILLION)
- TABLE 21. ARTIFICIAL INTELLIGENCE IN SPORTS MARKET FOR FOOTBALL, BY REGION, 2022-2032 ($MILLION)
- TABLE 22. ARTIFICIAL INTELLIGENCE IN SPORTS MARKET FOR CRICKET, BY REGION, 2022-2032 ($MILLION)
- TABLE 23. ARTIFICIAL INTELLIGENCE IN SPORTS MARKET FOR TENNIS, BY REGION, 2022-2032 ($MILLION)
- TABLE 24. ARTIFICIAL INTELLIGENCE IN SPORTS MARKET FOR BASKETBALL, BY REGION, 2022-2032 ($MILLION)
- TABLE 25. ARTIFICIAL INTELLIGENCE IN SPORTS MARKET FOR BASEBALL, BY REGION, 2022-2032 ($MILLION)
- TABLE 26. ARTIFICIAL INTELLIGENCE IN SPORTS MARKET FOR OTHERS, BY REGION, 2022-2032 ($MILLION)
- TABLE 27. ARTIFICIAL INTELLIGENCE IN SPORTS MARKET, BY REGION, 2022-2032 ($MILLION)
- TABLE 28. NORTH AMERICA ARTIFICIAL INTELLIGENCE IN SPORTS MARKET, BY COMPONENT, 2022-2032 ($MILLION)
- TABLE 29. NORTH AMERICA ARTIFICIAL INTELLIGENCE IN SPORTS MARKET, BY DEPLOYMENT MODEL, 2022-2032 ($MILLION)
- TABLE 30. NORTH AMERICA ARTIFICIAL INTELLIGENCE IN SPORTS MARKET, BY TECHNOLOGY, 2022-2032 ($MILLION)
- TABLE 31. NORTH AMERICA ARTIFICIAL INTELLIGENCE IN SPORTS MARKET, BY APPLICATION, 2022-2032 ($MILLION)
- TABLE 32. NORTH AMERICA ARTIFICIAL INTELLIGENCE IN SPORTS MARKET, BY GAME TYPE, 2022-2032 ($MILLION)
- TABLE 33. NORTH AMERICA ARTIFICIAL INTELLIGENCE IN SPORTS MARKET, BY COUNTRY, 2022-2032 ($MILLION)
- TABLE 34. U.S. ARTIFICIAL INTELLIGENCE IN SPORTS MARKET, BY COMPONENT, 2022-2032 ($MILLION)
- TABLE 35. U.S. ARTIFICIAL INTELLIGENCE IN SPORTS MARKET, BY DEPLOYMENT MODEL, 2022-2032 ($MILLION)
- TABLE 36. U.S. ARTIFICIAL INTELLIGENCE IN SPORTS MARKET, BY TECHNOLOGY, 2022-2032 ($MILLION)
- TABLE 37. U.S. ARTIFICIAL INTELLIGENCE IN SPORTS MARKET, BY APPLICATION, 2022-2032 ($MILLION)
- TABLE 38. U.S. ARTIFICIAL INTELLIGENCE IN SPORTS MARKET, BY GAME TYPE, 2022-2032 ($MILLION)
- TABLE 39. CANADA ARTIFICIAL INTELLIGENCE IN SPORTS MARKET, BY COMPONENT, 2022-2032 ($MILLION)
- TABLE 40. CANADA ARTIFICIAL INTELLIGENCE IN SPORTS MARKET, BY DEPLOYMENT MODEL, 2022-2032 ($MILLION)
- TABLE 41. CANADA ARTIFICIAL INTELLIGENCE IN SPORTS MARKET, BY TECHNOLOGY, 2022-2032 ($MILLION)
- TABLE 42. CANADA ARTIFICIAL INTELLIGENCE IN SPORTS MARKET, BY APPLICATION, 2022-2032 ($MILLION)
- TABLE 43. CANADA ARTIFICIAL INTELLIGENCE IN SPORTS MARKET, BY GAME TYPE, 2022-2032 ($MILLION)
- TABLE 44. EUROPE ARTIFICIAL INTELLIGENCE IN SPORTS MARKET, BY COMPONENT, 2022-2032 ($MILLION)
- TABLE 45. EUROPE ARTIFICIAL INTELLIGENCE IN SPORTS MARKET, BY DEPLOYMENT MODEL, 2022-2032 ($MILLION)
- TABLE 46. EUROPE ARTIFICIAL INTELLIGENCE IN SPORTS MARKET, BY TECHNOLOGY, 2022-2032 ($MILLION)
- TABLE 47. EUROPE ARTIFICIAL INTELLIGENCE IN SPORTS MARKET, BY APPLICATION, 2022-2032 ($MILLION)
- TABLE 48. EUROPE ARTIFICIAL INTELLIGENCE IN SPORTS MARKET, BY GAME TYPE, 2022-2032 ($MILLION)
- TABLE 49. EUROPE ARTIFICIAL INTELLIGENCE IN SPORTS MARKET, BY COUNTRY, 2022-2032 ($MILLION)
- TABLE 50. UK ARTIFICIAL INTELLIGENCE IN SPORTS MARKET, BY COMPONENT, 2022-2032 ($MILLION)
- TABLE 51. UK ARTIFICIAL INTELLIGENCE IN SPORTS MARKET, BY DEPLOYMENT MODEL, 2022-2032 ($MILLION)
- TABLE 52. UK ARTIFICIAL INTELLIGENCE IN SPORTS MARKET, BY TECHNOLOGY, 2022-2032 ($MILLION)
- TABLE 53. UK ARTIFICIAL INTELLIGENCE IN SPORTS MARKET, BY APPLICATION, 2022-2032 ($MILLION)
- TABLE 54. UK ARTIFICIAL INTELLIGENCE IN SPORTS MARKET, BY GAME TYPE, 2022-2032 ($MILLION)
- TABLE 55. GERMANY ARTIFICIAL INTELLIGENCE IN SPORTS MARKET, BY COMPONENT, 2022-2032 ($MILLION)
- TABLE 56. GERMANY ARTIFICIAL INTELLIGENCE IN SPORTS MARKET, BY DEPLOYMENT MODEL, 2022-2032 ($MILLION)
- TABLE 57. GERMANY ARTIFICIAL INTELLIGENCE IN SPORTS MARKET, BY TECHNOLOGY, 2022-2032 ($MILLION)
- TABLE 58. GERMANY ARTIFICIAL INTELLIGENCE IN SPORTS MARKET, BY APPLICATION, 2022-2032 ($MILLION)
- TABLE 59. GERMANY ARTIFICIAL INTELLIGENCE IN SPORTS MARKET, BY GAME TYPE, 2022-2032 ($MILLION)
- TABLE 60. FRANCE ARTIFICIAL INTELLIGENCE IN SPORTS MARKET, BY COMPONENT, 2022-2032 ($MILLION)
- TABLE 61. FRANCE ARTIFICIAL INTELLIGENCE IN SPORTS MARKET, BY DEPLOYMENT MODEL, 2022-2032 ($MILLION)
- TABLE 62. FRANCE ARTIFICIAL INTELLIGENCE IN SPORTS MARKET, BY TECHNOLOGY, 2022-2032 ($MILLION)
- TABLE 63. FRANCE ARTIFICIAL INTELLIGENCE IN SPORTS MARKET, BY APPLICATION, 2022-2032 ($MILLION)
- TABLE 64. FRANCE ARTIFICIAL INTELLIGENCE IN SPORTS MARKET, BY GAME TYPE, 2022-2032 ($MILLION)
- TABLE 65. ITALY ARTIFICIAL INTELLIGENCE IN SPORTS MARKET, BY COMPONENT, 2022-2032 ($MILLION)
- TABLE 66. ITALY ARTIFICIAL INTELLIGENCE IN SPORTS MARKET, BY DEPLOYMENT MODEL, 2022-2032 ($MILLION)
- TABLE 67. ITALY ARTIFICIAL INTELLIGENCE IN SPORTS MARKET, BY TECHNOLOGY, 2022-2032 ($MILLION)
- TABLE 68. ITALY ARTIFICIAL INTELLIGENCE IN SPORTS MARKET, BY APPLICATION, 2022-2032 ($MILLION)
- TABLE 69. ITALY ARTIFICIAL INTELLIGENCE IN SPORTS MARKET, BY GAME TYPE, 2022-2032 ($MILLION)
- TABLE 70. SPAIN ARTIFICIAL INTELLIGENCE IN SPORTS MARKET, BY COMPONENT, 2022-2032 ($MILLION)
- TABLE 71. SPAIN ARTIFICIAL INTELLIGENCE IN SPORTS MARKET, BY DEPLOYMENT MODEL, 2022-2032 ($MILLION)
- TABLE 72. SPAIN ARTIFICIAL INTELLIGENCE IN SPORTS MARKET, BY TECHNOLOGY, 2022-2032 ($MILLION)
- TABLE 73. SPAIN ARTIFICIAL INTELLIGENCE IN SPORTS MARKET, BY APPLICATION, 2022-2032 ($MILLION)
- TABLE 74. SPAIN ARTIFICIAL INTELLIGENCE IN SPORTS MARKET, BY GAME TYPE, 2022-2032 ($MILLION)
- TABLE 75. REST OF EUROPE ARTIFICIAL INTELLIGENCE IN SPORTS MARKET, BY COMPONENT, 2022-2032 ($MILLION)
- TABLE 76. REST OF EUROPE ARTIFICIAL INTELLIGENCE IN SPORTS MARKET, BY DEPLOYMENT MODEL, 2022-2032 ($MILLION)
- TABLE 77. REST OF EUROPE ARTIFICIAL INTELLIGENCE IN SPORTS MARKET, BY TECHNOLOGY, 2022-2032 ($MILLION)
- TABLE 78. REST OF EUROPE ARTIFICIAL INTELLIGENCE IN SPORTS MARKET, BY APPLICATION, 2022-2032 ($MILLION)
- TABLE 79. REST OF EUROPE ARTIFICIAL INTELLIGENCE IN SPORTS MARKET, BY GAME TYPE, 2022-2032 ($MILLION)
- TABLE 80. ASIA-PACIFIC ARTIFICIAL INTELLIGENCE IN SPORTS MARKET, BY COMPONENT, 2022-2032 ($MILLION)
- TABLE 81. ASIA-PACIFIC ARTIFICIAL INTELLIGENCE IN SPORTS MARKET, BY DEPLOYMENT MODEL, 2022-2032 ($MILLION)
- TABLE 82. ASIA-PACIFIC ARTIFICIAL INTELLIGENCE IN SPORTS MARKET, BY TECHNOLOGY, 2022-2032 ($MILLION)
- TABLE 83. ASIA-PACIFIC ARTIFICIAL INTELLIGENCE IN SPORTS MARKET, BY APPLICATION, 2022-2032 ($MILLION)
- TABLE 84. ASIA-PACIFIC ARTIFICIAL INTELLIGENCE IN SPORTS MARKET, BY GAME TYPE, 2022-2032 ($MILLION)
- TABLE 85. ASIA-PACIFIC ARTIFICIAL INTELLIGENCE IN SPORTS MARKET, BY COUNTRY, 2022-2032 ($MILLION)
- TABLE 86. CHINA ARTIFICIAL INTELLIGENCE IN SPORTS MARKET, BY COMPONENT, 2022-2032 ($MILLION)
- TABLE 87. CHINA ARTIFICIAL INTELLIGENCE IN SPORTS MARKET, BY DEPLOYMENT MODEL, 2022-2032 ($MILLION)
- TABLE 88. CHINA ARTIFICIAL INTELLIGENCE IN SPORTS MARKET, BY TECHNOLOGY, 2022-2032 ($MILLION)
- TABLE 89. CHINA ARTIFICIAL INTELLIGENCE IN SPORTS MARKET, BY APPLICATION, 2022-2032 ($MILLION)
- TABLE 90. CHINA ARTIFICIAL INTELLIGENCE IN SPORTS MARKET, BY GAME TYPE, 2022-2032 ($MILLION)
- TABLE 91. JAPAN ARTIFICIAL INTELLIGENCE IN SPORTS MARKET, BY COMPONENT, 2022-2032 ($MILLION)
- TABLE 92. JAPAN ARTIFICIAL INTELLIGENCE IN SPORTS MARKET, BY DEPLOYMENT MODEL, 2022-2032 ($MILLION)
- TABLE 93. JAPAN ARTIFICIAL INTELLIGENCE IN SPORTS MARKET, BY TECHNOLOGY, 2022-2032 ($MILLION)
- TABLE 94. JAPAN ARTIFICIAL INTELLIGENCE IN SPORTS MARKET, BY APPLICATION, 2022-2032 ($MILLION)
- TABLE 95. JAPAN ARTIFICIAL INTELLIGENCE IN SPORTS MARKET, BY GAME TYPE, 2022-2032 ($MILLION)
- TABLE 96. INDIA ARTIFICIAL INTELLIGENCE IN SPORTS MARKET, BY COMPONENT, 2022-2032 ($MILLION)
- TABLE 97. INDIA ARTIFICIAL INTELLIGENCE IN SPORTS MARKET, BY DEPLOYMENT MODEL, 2022-2032 ($MILLION)
- TABLE 98. INDIA ARTIFICIAL INTELLIGENCE IN SPORTS MARKET, BY TECHNOLOGY, 2022-2032 ($MILLION)
- TABLE 99. INDIA ARTIFICIAL INTELLIGENCE IN SPORTS MARKET, BY APPLICATION, 2022-2032 ($MILLION)
- TABLE 100. INDIA ARTIFICIAL INTELLIGENCE IN SPORTS MARKET, BY GAME TYPE, 2022-2032 ($MILLION)
- TABLE 101. AUSTRALIA ARTIFICIAL INTELLIGENCE IN SPORTS MARKET, BY COMPONENT, 2022-2032 ($MILLION)
- TABLE 102. AUSTRALIA ARTIFICIAL INTELLIGENCE IN SPORTS MARKET, BY DEPLOYMENT MODEL, 2022-2032 ($MILLION)
- TABLE 103. AUSTRALIA ARTIFICIAL INTELLIGENCE IN SPORTS MARKET, BY TECHNOLOGY, 2022-2032 ($MILLION)
- TABLE 104. AUSTRALIA ARTIFICIAL INTELLIGENCE IN SPORTS MARKET, BY APPLICATION, 2022-2032 ($MILLION)
- TABLE 105. AUSTRALIA ARTIFICIAL INTELLIGENCE IN SPORTS MARKET, BY GAME TYPE, 2022-2032 ($MILLION)
- TABLE 106. SOUTH KOREA ARTIFICIAL INTELLIGENCE IN SPORTS MARKET, BY COMPONENT, 2022-2032 ($MILLION)
- TABLE 107. SOUTH KOREA ARTIFICIAL INTELLIGENCE IN SPORTS MARKET, BY DEPLOYMENT MODEL, 2022-2032 ($MILLION)
- TABLE 108. SOUTH KOREA ARTIFICIAL INTELLIGENCE IN SPORTS MARKET, BY TECHNOLOGY, 2022-2032 ($MILLION)
- TABLE 109. SOUTH KOREA ARTIFICIAL INTELLIGENCE IN SPORTS MARKET, BY APPLICATION, 2022-2032 ($MILLION)
- TABLE 110. SOUTH KOREA ARTIFICIAL INTELLIGENCE IN SPORTS MARKET, BY GAME TYPE, 2022-2032 ($MILLION)
- TABLE 111. REST OF ASIA-PACIFIC ARTIFICIAL INTELLIGENCE IN SPORTS MARKET, BY COMPONENT, 2022-2032 ($MILLION)
- TABLE 112. REST OF ASIA-PACIFIC ARTIFICIAL INTELLIGENCE IN SPORTS MARKET, BY DEPLOYMENT MODEL, 2022-2032 ($MILLION)
- TABLE 113. REST OF ASIA-PACIFIC ARTIFICIAL INTELLIGENCE IN SPORTS MARKET, BY TECHNOLOGY, 2022-2032 ($MILLION)
- TABLE 114. REST OF ASIA-PACIFIC ARTIFICIAL INTELLIGENCE IN SPORTS MARKET, BY APPLICATION, 2022-2032 ($MILLION)
- TABLE 115. REST OF ASIA-PACIFIC ARTIFICIAL INTELLIGENCE IN SPORTS MARKET, BY GAME TYPE, 2022-2032 ($MILLION)
- TABLE 116. LAMEA ARTIFICIAL INTELLIGENCE IN SPORTS MARKET, BY COMPONENT, 2022-2032 ($MILLION)
- TABLE 117. LAMEA ARTIFICIAL INTELLIGENCE IN SPORTS MARKET, BY DEPLOYMENT MODEL, 2022-2032 ($MILLION)
- TABLE 118. LAMEA ARTIFICIAL INTELLIGENCE IN SPORTS MARKET, BY TECHNOLOGY, 2022-2032 ($MILLION)
- TABLE 119. LAMEA ARTIFICIAL INTELLIGENCE IN SPORTS MARKET, BY APPLICATION, 2022-2032 ($MILLION)
- TABLE 120. LAMEA ARTIFICIAL INTELLIGENCE IN SPORTS MARKET, BY GAME TYPE, 2022-2032 ($MILLION)
- TABLE 121. LAMEA ARTIFICIAL INTELLIGENCE IN SPORTS MARKET, BY COUNTRY, 2022-2032 ($MILLION)
- TABLE 122. LATIN AMERICA ARTIFICIAL INTELLIGENCE IN SPORTS MARKET, BY COMPONENT, 2022-2032 ($MILLION)
- TABLE 123. LATIN AMERICA ARTIFICIAL INTELLIGENCE IN SPORTS MARKET, BY DEPLOYMENT MODEL, 2022-2032 ($MILLION)
- TABLE 124. LATIN AMERICA ARTIFICIAL INTELLIGENCE IN SPORTS MARKET, BY TECHNOLOGY, 2022-2032 ($MILLION)
- TABLE 125. LATIN AMERICA ARTIFICIAL INTELLIGENCE IN SPORTS MARKET, BY APPLICATION, 2022-2032 ($MILLION)
- TABLE 126. LATIN AMERICA ARTIFICIAL INTELLIGENCE IN SPORTS MARKET, BY GAME TYPE, 2022-2032 ($MILLION)
- TABLE 127. MIDDLE EAST ARTIFICIAL INTELLIGENCE IN SPORTS MARKET, BY COMPONENT, 2022-2032 ($MILLION)
- TABLE 128. MIDDLE EAST ARTIFICIAL INTELLIGENCE IN SPORTS MARKET, BY DEPLOYMENT MODEL, 2022-2032 ($MILLION)
- TABLE 129. MIDDLE EAST ARTIFICIAL INTELLIGENCE IN SPORTS MARKET, BY TECHNOLOGY, 2022-2032 ($MILLION)
- TABLE 130. MIDDLE EAST ARTIFICIAL INTELLIGENCE IN SPORTS MARKET, BY APPLICATION, 2022-2032 ($MILLION)
- TABLE 131. MIDDLE EAST ARTIFICIAL INTELLIGENCE IN SPORTS MARKET, BY GAME TYPE, 2022-2032 ($MILLION)
- TABLE 132. AFRICA ARTIFICIAL INTELLIGENCE IN SPORTS MARKET, BY COMPONENT, 2022-2032 ($MILLION)
- TABLE 133. AFRICA ARTIFICIAL INTELLIGENCE IN SPORTS MARKET, BY DEPLOYMENT MODEL, 2022-2032 ($MILLION)
- TABLE 134. AFRICA ARTIFICIAL INTELLIGENCE IN SPORTS MARKET, BY TECHNOLOGY, 2022-2032 ($MILLION)
- TABLE 135. AFRICA ARTIFICIAL INTELLIGENCE IN SPORTS MARKET, BY APPLICATION, 2022-2032 ($MILLION)
- TABLE 136. AFRICA ARTIFICIAL INTELLIGENCE IN SPORTS MARKET, BY GAME TYPE, 2022-2032 ($MILLION)
- TABLE 137. CATAPULT GROUP INTERNATIONAL LIMITED.: KEY EXECUTIVES
- TABLE 138. CATAPULT GROUP INTERNATIONAL LIMITED.: COMPANY SNAPSHOT
- TABLE 139. CATAPULT GROUP INTERNATIONAL LIMITED.: SERVICE SEGMENTS
- TABLE 140. CATAPULT GROUP INTERNATIONAL LIMITED.: PRODUCT PORTFOLIO
- TABLE 141. CATAPULT GROUP INTERNATIONAL LIMITED.: KEY STRATERGIES
- TABLE 142. META PLATFORMS, INC.: KEY EXECUTIVES
- TABLE 143. META PLATFORMS, INC.: COMPANY SNAPSHOT
- TABLE 144. META PLATFORMS, INC.: SERVICE SEGMENTS
- TABLE 145. META PLATFORMS, INC.: PRODUCT PORTFOLIO
- TABLE 146. META PLATFORMS, INC.: KEY STRATERGIES
- TABLE 147. IBM CORPORATION: KEY EXECUTIVES
- TABLE 148. IBM CORPORATION: COMPANY SNAPSHOT
- TABLE 149. IBM CORPORATION: PRODUCT SEGMENTS
- TABLE 150. IBM CORPORATION: PRODUCT PORTFOLIO
- TABLE 151. IBM CORPORATION: KEY STRATERGIES
- TABLE 152. MICROSOFT CORPORATION: KEY EXECUTIVES
- TABLE 153. MICROSOFT CORPORATION: COMPANY SNAPSHOT
- TABLE 154. MICROSOFT CORPORATION: SERVICE SEGMENTS
- TABLE 155. MICROSOFT CORPORATION: PRODUCT PORTFOLIO
- TABLE 156. MICROSOFT CORPORATION: KEY STRATERGIES
- TABLE 157. SALESFORCE.COM INC.: KEY EXECUTIVES
- TABLE 158. SALESFORCE.COM INC.: COMPANY SNAPSHOT
- TABLE 159. SALESFORCE.COM INC.: SERVICE SEGMENTS
- TABLE 160. SALESFORCE.COM INC.: PRODUCT PORTFOLIO
- TABLE 161. SALESFORCE.COM INC.: KEY STRATERGIES
- TABLE 162. SAP SE: KEY EXECUTIVES
- TABLE 163. SAP SE: COMPANY SNAPSHOT
- TABLE 164. SAP SE: PRODUCT SEGMENTS
- TABLE 165. SAP SE: PRODUCT PORTFOLIO
- TABLE 166. SAS INSTITUTE INC: KEY EXECUTIVES
- TABLE 167. SAS INSTITUTE INC: COMPANY SNAPSHOT
- TABLE 168. SAS INSTITUTE INC: SERVICE SEGMENTS
- TABLE 169. SAS INSTITUTE INC: PRODUCT PORTFOLIO
- TABLE 170. SAS INSTITUTE INC: KEY STRATERGIES
- TABLE 171. SPORTRADAR AG: KEY EXECUTIVES
- TABLE 172. SPORTRADAR AG: COMPANY SNAPSHOT
- TABLE 173. SPORTRADAR AG: SERVICE SEGMENTS
- TABLE 174. SPORTRADAR AG: PRODUCT PORTFOLIO
- TABLE 175. SPORTRADAR AG: KEY STRATERGIES
- TABLE 176. STATS PERFORM: KEY EXECUTIVES
- TABLE 177. STATS PERFORM: COMPANY SNAPSHOT
- TABLE 178. STATS PERFORM: PRODUCT SEGMENTS
- TABLE 179. STATS PERFORM: PRODUCT PORTFOLIO
- TABLE 180. STATS PERFORM: KEY STRATERGIES
- TABLE 181. TRUMEDIA NETWORKS: KEY EXECUTIVES
- TABLE 182. TRUMEDIA NETWORKS: COMPANY SNAPSHOT
- TABLE 183. TRUMEDIA NETWORKS: PRODUCT SEGMENTS
- TABLE 184. TRUMEDIA NETWORKS: PRODUCT PORTFOLIO
- TABLE 185. TRUMEDIA NETWORKS: KEY STRATERGIES
LIST OF FIGURES
- FIGURE 01. ARTIFICIAL INTELLIGENCE IN SPORTS MARKET, 2022-2032
- FIGURE 02. SEGMENTATION OF ARTIFICIAL INTELLIGENCE IN SPORTS MARKET,2022-2032
- FIGURE 03. TOP IMPACTING FACTORS IN ARTIFICIAL INTELLIGENCE IN SPORTS MARKET (2022 TO 2032)
- FIGURE 04. TOP INVESTMENT POCKETS IN ARTIFICIAL INTELLIGENCE IN SPORTS MARKET (2023-2032)
- FIGURE 05. LOW BARGAINING POWER OF SUPPLIERS
- FIGURE 06. LOW THREAT OF NEW ENTRANTS
- FIGURE 07. LOW THREAT OF SUBSTITUTES
- FIGURE 08. LOW INTENSITY OF RIVALRY
- FIGURE 09. LOW BARGAINING POWER OF BUYERS
- FIGURE 10. GLOBAL ARTIFICIAL INTELLIGENCE IN SPORTS MARKET:DRIVERS, RESTRAINTS AND OPPORTUNITIES
- FIGURE 11. ARTIFICIAL INTELLIGENCE IN SPORTS MARKET, BY COMPONENT, 2022 AND 2032(%)
- FIGURE 12. COMPARATIVE SHARE ANALYSIS OF ARTIFICIAL INTELLIGENCE IN SPORTS MARKET FOR SOFTWARE, BY COUNTRY 2022 AND 2032(%)
- FIGURE 13. COMPARATIVE SHARE ANALYSIS OF ARTIFICIAL INTELLIGENCE IN SPORTS MARKET FOR SERVICE, BY COUNTRY 2022 AND 2032(%)
- FIGURE 14. ARTIFICIAL INTELLIGENCE IN SPORTS MARKET, BY DEPLOYMENT MODEL, 2022 AND 2032(%)
- FIGURE 15. COMPARATIVE SHARE ANALYSIS OF ARTIFICIAL INTELLIGENCE IN SPORTS MARKET FOR ON-PREMISE, BY COUNTRY 2022 AND 2032(%)
- FIGURE 16. COMPARATIVE SHARE ANALYSIS OF ARTIFICIAL INTELLIGENCE IN SPORTS MARKET FOR CLOUD, BY COUNTRY 2022 AND 2032(%)
- FIGURE 17. ARTIFICIAL INTELLIGENCE IN SPORTS MARKET, BY TECHNOLOGY, 2022 AND 2032(%)
- FIGURE 18. COMPARATIVE SHARE ANALYSIS OF ARTIFICIAL INTELLIGENCE IN SPORTS MARKET FOR MACHINE LEARNING, BY COUNTRY 2022 AND 2032(%)
- FIGURE 19. COMPARATIVE SHARE ANALYSIS OF ARTIFICIAL INTELLIGENCE IN SPORTS MARKET FOR NATURAL LANGUAGE PROCESSING, BY COUNTRY 2022 AND 2032(%)
- FIGURE 20. COMPARATIVE SHARE ANALYSIS OF ARTIFICIAL INTELLIGENCE IN SPORTS MARKET FOR COMPUTER VISION, BY COUNTRY 2022 AND 2032(%)
- FIGURE 21. COMPARATIVE SHARE ANALYSIS OF ARTIFICIAL INTELLIGENCE IN SPORTS MARKET FOR DATA ANALYTICS, BY COUNTRY 2022 AND 2032(%)
- FIGURE 22. COMPARATIVE SHARE ANALYSIS OF ARTIFICIAL INTELLIGENCE IN SPORTS MARKET FOR OTHERS, BY COUNTRY 2022 AND 2032(%)
- FIGURE 23. ARTIFICIAL INTELLIGENCE IN SPORTS MARKET, BY APPLICATION, 2022 AND 2032(%)
- FIGURE 24. COMPARATIVE SHARE ANALYSIS OF ARTIFICIAL INTELLIGENCE IN SPORTS MARKET FOR GAME PLANNING, BY COUNTRY 2022 AND 2032(%)
- FIGURE 25. COMPARATIVE SHARE ANALYSIS OF ARTIFICIAL INTELLIGENCE IN SPORTS MARKET FOR GAME STRATEGIES, BY COUNTRY 2022 AND 2032(%)
- FIGURE 26. COMPARATIVE SHARE ANALYSIS OF ARTIFICIAL INTELLIGENCE IN SPORTS MARKET FOR PERFORMANCE IMPROVEMENT, BY COUNTRY 2022 AND 2032(%)
- FIGURE 27. COMPARATIVE SHARE ANALYSIS OF ARTIFICIAL INTELLIGENCE IN SPORTS MARKET FOR INJURY PREVENTION, BY COUNTRY 2022 AND 2032(%)
- FIGURE 28. COMPARATIVE SHARE ANALYSIS OF ARTIFICIAL INTELLIGENCE IN SPORTS MARKET FOR SPORTS RECRUITMENT, BY COUNTRY 2022 AND 2032(%)
- FIGURE 29. COMPARATIVE SHARE ANALYSIS OF ARTIFICIAL INTELLIGENCE IN SPORTS MARKET FOR OTHERS, BY COUNTRY 2022 AND 2032(%)
- FIGURE 30. ARTIFICIAL INTELLIGENCE IN SPORTS MARKET, BY GAME TYPE, 2022 AND 2032(%)
- FIGURE 31. COMPARATIVE SHARE ANALYSIS OF ARTIFICIAL INTELLIGENCE IN SPORTS MARKET FOR FOOTBALL, BY COUNTRY 2022 AND 2032(%)
- FIGURE 32. COMPARATIVE SHARE ANALYSIS OF ARTIFICIAL INTELLIGENCE IN SPORTS MARKET FOR CRICKET, BY COUNTRY 2022 AND 2032(%)
- FIGURE 33. COMPARATIVE SHARE ANALYSIS OF ARTIFICIAL INTELLIGENCE IN SPORTS MARKET FOR TENNIS, BY COUNTRY 2022 AND 2032(%)
- FIGURE 34. COMPARATIVE SHARE ANALYSIS OF ARTIFICIAL INTELLIGENCE IN SPORTS MARKET FOR BASKETBALL, BY COUNTRY 2022 AND 2032(%)
- FIGURE 35. COMPARATIVE SHARE ANALYSIS OF ARTIFICIAL INTELLIGENCE IN SPORTS MARKET FOR BASEBALL, BY COUNTRY 2022 AND 2032(%)
- FIGURE 36. COMPARATIVE SHARE ANALYSIS OF ARTIFICIAL INTELLIGENCE IN SPORTS MARKET FOR OTHERS, BY COUNTRY 2022 AND 2032(%)
- FIGURE 37. ARTIFICIAL INTELLIGENCE IN SPORTS MARKET BY REGION, 2022 AND 2032(%)
- FIGURE 38. U.S. ARTIFICIAL INTELLIGENCE IN SPORTS MARKET, 2022-2032 ($MILLION)
- FIGURE 39. CANADA ARTIFICIAL INTELLIGENCE IN SPORTS MARKET, 2022-2032 ($MILLION)
- FIGURE 40. UK ARTIFICIAL INTELLIGENCE IN SPORTS MARKET, 2022-2032 ($MILLION)
- FIGURE 41. GERMANY ARTIFICIAL INTELLIGENCE IN SPORTS MARKET, 2022-2032 ($MILLION)
- FIGURE 42. FRANCE ARTIFICIAL INTELLIGENCE IN SPORTS MARKET, 2022-2032 ($MILLION)
- FIGURE 43. ITALY ARTIFICIAL INTELLIGENCE IN SPORTS MARKET, 2022-2032 ($MILLION)
- FIGURE 44. SPAIN ARTIFICIAL INTELLIGENCE IN SPORTS MARKET, 2022-2032 ($MILLION)
- FIGURE 45. REST OF EUROPE ARTIFICIAL INTELLIGENCE IN SPORTS MARKET, 2022-2032 ($MILLION)
- FIGURE 46. CHINA ARTIFICIAL INTELLIGENCE IN SPORTS MARKET, 2022-2032 ($MILLION)
- FIGURE 47. JAPAN ARTIFICIAL INTELLIGENCE IN SPORTS MARKET, 2022-2032 ($MILLION)
- FIGURE 48. INDIA ARTIFICIAL INTELLIGENCE IN SPORTS MARKET, 2022-2032 ($MILLION)
- FIGURE 49. AUSTRALIA ARTIFICIAL INTELLIGENCE IN SPORTS MARKET, 2022-2032 ($MILLION)
- FIGURE 50. SOUTH KOREA ARTIFICIAL INTELLIGENCE IN SPORTS MARKET, 2022-2032 ($MILLION)
- FIGURE 51. REST OF ASIA-PACIFIC ARTIFICIAL INTELLIGENCE IN SPORTS MARKET, 2022-2032 ($MILLION)
- FIGURE 52. LATIN AMERICA ARTIFICIAL INTELLIGENCE IN SPORTS MARKET, 2022-2032 ($MILLION)
- FIGURE 53. MIDDLE EAST ARTIFICIAL INTELLIGENCE IN SPORTS MARKET, 2022-2032 ($MILLION)
- FIGURE 54. AFRICA ARTIFICIAL INTELLIGENCE IN SPORTS MARKET, 2022-2032 ($MILLION)
- FIGURE 55. TOP WINNING STRATEGIES, BY YEAR (2020-2023)
- FIGURE 56. TOP WINNING STRATEGIES, BY DEVELOPMENT (2020-2023)
- FIGURE 57. TOP WINNING STRATEGIES, BY COMPANY (2020-2023)
- FIGURE 58. PRODUCT MAPPING OF TOP 10 PLAYERS
- FIGURE 59. COMPETITIVE DASHBOARD
- FIGURE 60. COMPETITIVE HEATMAP: ARTIFICIAL INTELLIGENCE IN SPORTS MARKET
- FIGURE 61. TOP PLAYER POSITIONING, 2022
- FIGURE 62. META PLATFORMS, INC.: NET REVENUE, 2020-2022 ($MILLION)
- FIGURE 63. META PLATFORMS, INC.: RESEARCH & DEVELOPMENT EXPENDITURE, 2020-2022 ($MILLION)
- FIGURE 64. META PLATFORMS, INC.: REVENUE SHARE BY REGION, 2022 (%)
- FIGURE 65. META PLATFORMS, INC.: REVENUE SHARE BY SEGMENT, 2022 (%)
- FIGURE 66. IBM CORPORATION: NET REVENUE, 2020-2022 ($MILLION)
- FIGURE 67. IBM CORPORATION: RESEARCH & DEVELOPMENT EXPENDITURE, 2020-2022 ($MILLION)
- FIGURE 68. IBM CORPORATION: REVENUE SHARE BY SEGMENT, 2022 (%)
- FIGURE 69. IBM CORPORATION: REVENUE SHARE BY REGION, 2022 (%)
- FIGURE 70. MICROSOFT CORPORATION: NET REVENUE, 2021-2023 ($MILLION)
- FIGURE 71. MICROSOFT CORPORATION: RESEARCH & DEVELOPMENT EXPENDITURE, 2021-2023 ($MILLION)
- FIGURE 72. MICROSOFT CORPORATION: REVENUE SHARE BY SEGMENT, 2023 (%)
- FIGURE 73. MICROSOFT CORPORATION: REVENUE SHARE BY REGION, 2023 (%)
- FIGURE 74. SALESFORCE.COM INC.: NET REVENUE, 2021-2023 ($MILLION)
- FIGURE 75. SALESFORCE.COM INC.: RESEARCH & DEVELOPMENT EXPENDITURE, 2021-2023 ($MILLION)
- FIGURE 76. SALESFORCE.COM INC.: REVENUE SHARE BY SEGMENT, 2023 (%)
- FIGURE 77. SALESFORCE.COM INC.: REVENUE SHARE BY REGION, 2023 (%)
- FIGURE 78. SAP SE: NET REVENUE, 2020-2022 ($MILLION)
- FIGURE 79. SAP SE: RESEARCH & DEVELOPMENT EXPENDITURE, 2020-2022 ($MILLION)
- FIGURE 80. SAP SE: REVENUE SHARE BY SEGMENT, 2022 (%)
- FIGURE 81. SAP SE: REVENUE SHARE BY REGION, 2022 (%)
- FIGURE 82. SPORTRADAR AG: NET REVENUE, 2020-2022 ($MILLION)
- FIGURE 83. SPORTRADAR AG: REVENUE SHARE BY SEGMENT, 2022 (%)
- FIGURE 84. SPORTRADAR AG: REVENUE SHARE BY REGION, 2022 (%)

