
PUBLISHER: Allied Market Research | PRODUCT CODE: 1446949

PUBLISHER: Allied Market Research | PRODUCT CODE: 1446949
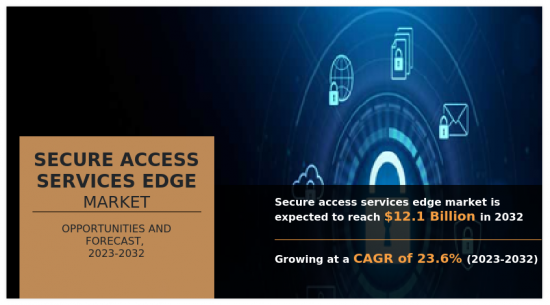
Secure Access Services Edge Market By Offering, By Organization SIze, By Application : Global Opportunity Analysis and Industry Forecast, 2023-2032
Secure access service edge (SASE) is a framework for network architecture that brings cloud-native security technologies-SWG, CASB, ZTNA, and FWaaS in particular-together with wide area network (WAN) capabilities to securely connect users, systems, and endpoints to applications and services anywhere. In addition, numerous benefits, such as efficient decision-making, realistic expectations, escalation, and focus on risk, associated with secure access services edge solutions are the lucrative factors that boost the market growth.
Growing emphasis on remote work environments across regions is one of the major driving factors for the secure access services edge market. With a significant piece of the worldwide labor force working in modern office conditions, associations are confronted with elevated online protection gambles. The presence of distant workers who get close enough to corporate organizations and delicate data from various areas and gadgets prompts weaknesses that pernicious people exploit. Thus, there is a growing demand for real-time identification, monitoring, and response capabilities provided by secure access services edge solutions. These solutions enable organizations to safeguard remote access points, detect and mitigate risks aimed at remote workers, and ensure secure connectivity, making them essential in the current landscape of remote work.
Furthermore, the market is profoundly influenced by considerable expenses related to secure access services edge solutions and services. Primarily, these expenses serve as a deterrent for smaller and medium-sized organizations (SMEs) with constrained budgets. SMEs perceive secure access services edge solutions as a financial burden, leading to insufficient investment in cybersecurity measures and rendering them vulnerable to cyber threats. In addition, even larger organizations exhibit hesitation in allocating substantial resources to secure access services edge solutions, particularly when faced with competing budgetary demands.
The notable factors positively affecting the secure access services edge market include an increase in the integration of regulatory and data protection laws and a rise in demand for security services. However, the lack of awareness about security services among enterprises and high cost of implementation hinder market growth. However, surge in adoption of cloud-based solutions offer lucrative market opportunities for market players.
The security access services edge market is segmented on the basis of offering, organization size, application, and region. By component, the market is segmented into network as a service and security as a service. On the basis of organization size, the market is segmented into large enterprises and SMEs. On the basis of application, the market is segmented into government, BFSI, retail and e-commerce, IT and ITeS, and others. Region-wise, it is analyzed across North America, Europe, Asia-Pacific, Latin America and MEA.
This report further frameworks the latest things and key areas of the venture. Moreover, it incorporates Porter's five powers examination to grasp the competitive situation of the business and the role of every stakeholder. The report includes the methodologies embraced by key market players to keep up with their traction in the market. Furthermore, it highlights the competitive landscape of key market players to increase their market share and sustain intense competition in the industry. The key players operating in the market include McAfee, Netskope, Palo, Alto Networks, Cato Networks, VMware, Check Point Software Technologies, Fortinet, Cisco Systems, Inc., Zscaler and Versa Networks.
KEY BENEFITS FOR STAKEHOLDERS
- The study provides an in-depth analysis of the security access services edge market forecast along with the current and future trends to explain the imminent investment pockets.
- Information about key drivers, restraints, and opportunities and their impact analysis on security access services edge market trends is provided in the report.
- The Porter's five forces analysis illustrates the potency of the buyers and suppliers operating in the industry.
- The quantitative analysis of the security access services edge market from 2022 to 2032 is provided to determine the market potential.
Additional benefits you will get with this purchase are:
- Quarterly Update and* (only available with a corporate license, on listed price)
- 5 additional Company Profile of client Choice pre- or Post-purchase, as a free update.
- Free Upcoming Version on the Purchase of Five and Enterprise User License.
- 16 analyst hours of support* (post-purchase, if you find additional data requirements upon review of the report, you may receive support amounting to 16 analyst hours to solve questions, and post-sale queries)
- 15% Free Customization* (in case the scope or segment of the report does not match your requirements, 15% is equivalent to 3 working days of free work, applicable once)
- Free data Pack on the Five and Enterprise User License. (Excel version of the report)
- Free Updated report if the report is 6-12 months old or older.
- 24-hour priority response*
- Free Industry updates and white papers.
Possible Customization with this report (with additional cost and timeline, please talk to the sales executive to know more)
- Investment Opportunities
- Market share analysis of players by products/segments
- Regulatory Guidelines
- Additional company profiles with specific to client's interest
- Additional country or region analysis- market size and forecast
- Market share analysis of players at global/region/country level
- SWOT Analysis
Key Market Segments
By Offering
- Security as a Service
- Network as a Service
By Organization SIze
- Large Enterprises
- SMEs
By Application
- Government
- BFSI
- Retail and eCommerce
- IT and ITeS
- Others
By Region
- North America
- U.S.
- Canada
- Europe
- UK
- Germany
- France
- Italy
- Spain
- Rest of Europe
- Asia-Pacific
- China
- Japan
- India
- Australia
- South Korea
- Rest of Asia-Pacific
- Latin America
- Argentina
- Brazil
- Colombia
- Rest of Latin America
- Middle East and Africa
- Saudi Arabia
- South Africa
- UAE
- Rest of Middle East And Africa
Key Market Players:
- McAfee
- Netskope, Inc.
- Palo Alto Network
- Cato Networks
- VMware
- Check Point Software Tech. Ltd.
- Fortinet
- Cisco Systems Inc.
- Zscaler, Inc.
- Versa Networks, Inc.
TABLE OF CONTENTS
CHAPTER 1: INTRODUCTION
- 1.1. Report description
- 1.2. Key market segments
- 1.3. Key benefits to the stakeholders
- 1.4. Research methodology
- 1.4.1. Primary research
- 1.4.2. Secondary research
- 1.4.3. Analyst tools and models
CHAPTER 2: EXECUTIVE SUMMARY
- 2.1. CXO Perspective
CHAPTER 3: MARKET OVERVIEW
- 3.1. Market definition and scope
- 3.2. Key findings
- 3.2.1. Top impacting factors
- 3.2.2. Top investment pockets
- 3.3. Porter's five forces analysis
- 3.4. Market dynamics
- 3.4.1. Drivers
- 3.4.2. Restraints
- 3.4.3. Opportunities
CHAPTER 4: SECURE ACCESS SERVICES EDGE MARKET, BY OFFERING
- 4.1. Overview
- 4.1.1. Market size and forecast
- 4.2. Network as a Service
- 4.2.1. Key market trends, growth factors and opportunities
- 4.2.2. Market size and forecast, by region
- 4.2.3. Market share analysis by country
- 4.3. Security as a Service
- 4.3.1. Key market trends, growth factors and opportunities
- 4.3.2. Market size and forecast, by region
- 4.3.3. Market share analysis by country
CHAPTER 5: SECURE ACCESS SERVICES EDGE MARKET, BY ORGANIZATION SIZE
- 5.1. Overview
- 5.1.1. Market size and forecast
- 5.2. Large Enterprises
- 5.2.1. Key market trends, growth factors and opportunities
- 5.2.2. Market size and forecast, by region
- 5.2.3. Market share analysis by country
- 5.3. SMEs
- 5.3.1. Key market trends, growth factors and opportunities
- 5.3.2. Market size and forecast, by region
- 5.3.3. Market share analysis by country
CHAPTER 6: SECURE ACCESS SERVICES EDGE MARKET, BY APPLICATION
- 6.1. Overview
- 6.1.1. Market size and forecast
- 6.2. Government
- 6.2.1. Key market trends, growth factors and opportunities
- 6.2.2. Market size and forecast, by region
- 6.2.3. Market share analysis by country
- 6.3. BFSI
- 6.3.1. Key market trends, growth factors and opportunities
- 6.3.2. Market size and forecast, by region
- 6.3.3. Market share analysis by country
- 6.4. Retail and eCommerce
- 6.4.1. Key market trends, growth factors and opportunities
- 6.4.2. Market size and forecast, by region
- 6.4.3. Market share analysis by country
- 6.5. IT and ITeS
- 6.5.1. Key market trends, growth factors and opportunities
- 6.5.2. Market size and forecast, by region
- 6.5.3. Market share analysis by country
- 6.6. Others
- 6.6.1. Key market trends, growth factors and opportunities
- 6.6.2. Market size and forecast, by region
- 6.6.3. Market share analysis by country
CHAPTER 7: SECURE ACCESS SERVICES EDGE MARKET, BY REGION
- 7.1. Overview
- 7.1.1. Market size and forecast By Region
- 7.2. North America
- 7.2.1. Key market trends, growth factors and opportunities
- 7.2.2. Market size and forecast, by Offering
- 7.2.3. Market size and forecast, by Organization SIze
- 7.2.4. Market size and forecast, by Application
- 7.2.5. Market size and forecast, by country
- 7.2.5.1. U.S.
- 7.2.5.1.1. Market size and forecast, by Offering
- 7.2.5.1.2. Market size and forecast, by Organization SIze
- 7.2.5.1.3. Market size and forecast, by Application
- 7.2.5.2. Canada
- 7.2.5.2.1. Market size and forecast, by Offering
- 7.2.5.2.2. Market size and forecast, by Organization SIze
- 7.2.5.2.3. Market size and forecast, by Application
- 7.3. Europe
- 7.3.1. Key market trends, growth factors and opportunities
- 7.3.2. Market size and forecast, by Offering
- 7.3.3. Market size and forecast, by Organization SIze
- 7.3.4. Market size and forecast, by Application
- 7.3.5. Market size and forecast, by country
- 7.3.5.1. UK
- 7.3.5.1.1. Market size and forecast, by Offering
- 7.3.5.1.2. Market size and forecast, by Organization SIze
- 7.3.5.1.3. Market size and forecast, by Application
- 7.3.5.2. Germany
- 7.3.5.2.1. Market size and forecast, by Offering
- 7.3.5.2.2. Market size and forecast, by Organization SIze
- 7.3.5.2.3. Market size and forecast, by Application
- 7.3.5.3. France
- 7.3.5.3.1. Market size and forecast, by Offering
- 7.3.5.3.2. Market size and forecast, by Organization SIze
- 7.3.5.3.3. Market size and forecast, by Application
- 7.3.5.4. Italy
- 7.3.5.4.1. Market size and forecast, by Offering
- 7.3.5.4.2. Market size and forecast, by Organization SIze
- 7.3.5.4.3. Market size and forecast, by Application
- 7.3.5.5. Spain
- 7.3.5.5.1. Market size and forecast, by Offering
- 7.3.5.5.2. Market size and forecast, by Organization SIze
- 7.3.5.5.3. Market size and forecast, by Application
- 7.3.5.6. Rest of Europe
- 7.3.5.6.1. Market size and forecast, by Offering
- 7.3.5.6.2. Market size and forecast, by Organization SIze
- 7.3.5.6.3. Market size and forecast, by Application
- 7.4. Asia-Pacific
- 7.4.1. Key market trends, growth factors and opportunities
- 7.4.2. Market size and forecast, by Offering
- 7.4.3. Market size and forecast, by Organization SIze
- 7.4.4. Market size and forecast, by Application
- 7.4.5. Market size and forecast, by country
- 7.4.5.1. China
- 7.4.5.1.1. Market size and forecast, by Offering
- 7.4.5.1.2. Market size and forecast, by Organization SIze
- 7.4.5.1.3. Market size and forecast, by Application
- 7.4.5.2. Japan
- 7.4.5.2.1. Market size and forecast, by Offering
- 7.4.5.2.2. Market size and forecast, by Organization SIze
- 7.4.5.2.3. Market size and forecast, by Application
- 7.4.5.3. India
- 7.4.5.3.1. Market size and forecast, by Offering
- 7.4.5.3.2. Market size and forecast, by Organization SIze
- 7.4.5.3.3. Market size and forecast, by Application
- 7.4.5.4. Australia
- 7.4.5.4.1. Market size and forecast, by Offering
- 7.4.5.4.2. Market size and forecast, by Organization SIze
- 7.4.5.4.3. Market size and forecast, by Application
- 7.4.5.5. South Korea
- 7.4.5.5.1. Market size and forecast, by Offering
- 7.4.5.5.2. Market size and forecast, by Organization SIze
- 7.4.5.5.3. Market size and forecast, by Application
- 7.4.5.6. Rest of Asia-Pacific
- 7.4.5.6.1. Market size and forecast, by Offering
- 7.4.5.6.2. Market size and forecast, by Organization SIze
- 7.4.5.6.3. Market size and forecast, by Application
- 7.5. Latin America
- 7.5.1. Key market trends, growth factors and opportunities
- 7.5.2. Market size and forecast, by Offering
- 7.5.3. Market size and forecast, by Organization SIze
- 7.5.4. Market size and forecast, by Application
- 7.5.5. Market size and forecast, by country
- 7.5.5.1. Argentina
- 7.5.5.1.1. Market size and forecast, by Offering
- 7.5.5.1.2. Market size and forecast, by Organization SIze
- 7.5.5.1.3. Market size and forecast, by Application
- 7.5.5.2. Brazil
- 7.5.5.2.1. Market size and forecast, by Offering
- 7.5.5.2.2. Market size and forecast, by Organization SIze
- 7.5.5.2.3. Market size and forecast, by Application
- 7.5.5.3. Colombia
- 7.5.5.3.1. Market size and forecast, by Offering
- 7.5.5.3.2. Market size and forecast, by Organization SIze
- 7.5.5.3.3. Market size and forecast, by Application
- 7.5.5.4. Rest of Latin America
- 7.5.5.4.1. Market size and forecast, by Offering
- 7.5.5.4.2. Market size and forecast, by Organization SIze
- 7.5.5.4.3. Market size and forecast, by Application
- 7.6. Middle East and Africa
- 7.6.1. Key market trends, growth factors and opportunities
- 7.6.2. Market size and forecast, by Offering
- 7.6.3. Market size and forecast, by Organization SIze
- 7.6.4. Market size and forecast, by Application
- 7.6.5. Market size and forecast, by country
- 7.6.5.1. Saudi Arabia
- 7.6.5.1.1. Market size and forecast, by Offering
- 7.6.5.1.2. Market size and forecast, by Organization SIze
- 7.6.5.1.3. Market size and forecast, by Application
- 7.6.5.2. South Africa
- 7.6.5.2.1. Market size and forecast, by Offering
- 7.6.5.2.2. Market size and forecast, by Organization SIze
- 7.6.5.2.3. Market size and forecast, by Application
- 7.6.5.3. UAE
- 7.6.5.3.1. Market size and forecast, by Offering
- 7.6.5.3.2. Market size and forecast, by Organization SIze
- 7.6.5.3.3. Market size and forecast, by Application
- 7.6.5.4. Rest of Middle East And Africa
- 7.6.5.4.1. Market size and forecast, by Offering
- 7.6.5.4.2. Market size and forecast, by Organization SIze
- 7.6.5.4.3. Market size and forecast, by Application
CHAPTER 8: COMPETITIVE LANDSCAPE
- 8.1. Introduction
- 8.2. Top winning strategies
- 8.3. Product mapping of top 10 player
- 8.4. Competitive dashboard
- 8.5. Competitive heatmap
- 8.6. Top player positioning, 2022
CHAPTER 9: COMPANY PROFILES
- 9.1. McAfee
- 9.1.1. Company overview
- 9.1.2. Key executives
- 9.1.3. Company snapshot
- 9.1.4. Operating business segments
- 9.1.5. Product portfolio
- 9.1.6. Business performance
- 9.1.7. Key strategic moves and developments
- 9.2. Netskope, Inc.
- 9.2.1. Company overview
- 9.2.2. Key executives
- 9.2.3. Company snapshot
- 9.2.4. Operating business segments
- 9.2.5. Product portfolio
- 9.2.6. Business performance
- 9.2.7. Key strategic moves and developments
- 9.3. Palo Alto Network
- 9.3.1. Company overview
- 9.3.2. Key executives
- 9.3.3. Company snapshot
- 9.3.4. Operating business segments
- 9.3.5. Product portfolio
- 9.3.6. Business performance
- 9.3.7. Key strategic moves and developments
- 9.4. Cato Networks
- 9.4.1. Company overview
- 9.4.2. Key executives
- 9.4.3. Company snapshot
- 9.4.4. Operating business segments
- 9.4.5. Product portfolio
- 9.4.6. Business performance
- 9.4.7. Key strategic moves and developments
- 9.5. VMware
- 9.5.1. Company overview
- 9.5.2. Key executives
- 9.5.3. Company snapshot
- 9.5.4. Operating business segments
- 9.5.5. Product portfolio
- 9.5.6. Business performance
- 9.5.7. Key strategic moves and developments
- 9.6. Check Point Software Tech. Ltd.
- 9.6.1. Company overview
- 9.6.2. Key executives
- 9.6.3. Company snapshot
- 9.6.4. Operating business segments
- 9.6.5. Product portfolio
- 9.6.6. Business performance
- 9.6.7. Key strategic moves and developments
- 9.7. Fortinet
- 9.7.1. Company overview
- 9.7.2. Key executives
- 9.7.3. Company snapshot
- 9.7.4. Operating business segments
- 9.7.5. Product portfolio
- 9.7.6. Business performance
- 9.7.7. Key strategic moves and developments
- 9.8. Cisco Systems Inc.
- 9.8.1. Company overview
- 9.8.2. Key executives
- 9.8.3. Company snapshot
- 9.8.4. Operating business segments
- 9.8.5. Product portfolio
- 9.8.6. Business performance
- 9.8.7. Key strategic moves and developments
- 9.9. Zscaler, Inc.
- 9.9.1. Company overview
- 9.9.2. Key executives
- 9.9.3. Company snapshot
- 9.9.4. Operating business segments
- 9.9.5. Product portfolio
- 9.9.6. Business performance
- 9.9.7. Key strategic moves and developments
- 9.10. Versa Networks, Inc.
- 9.10.1. Company overview
- 9.10.2. Key executives
- 9.10.3. Company snapshot
- 9.10.4. Operating business segments
- 9.10.5. Product portfolio
- 9.10.6. Business performance
- 9.10.7. Key strategic moves and developments
LIST OF TABLES
- TABLE 01. GLOBAL SECURE ACCESS SERVICES EDGE MARKET, BY OFFERING, 2022-2032 ($MILLION)
- TABLE 02. SECURE ACCESS SERVICES EDGE MARKET FOR NETWORK AS A SERVICE, BY REGION, 2022-2032 ($MILLION)
- TABLE 03. SECURE ACCESS SERVICES EDGE MARKET FOR SECURITY AS A SERVICE, BY REGION, 2022-2032 ($MILLION)
- TABLE 04. GLOBAL SECURE ACCESS SERVICES EDGE MARKET, BY ORGANIZATION SIZE, 2022-2032 ($MILLION)
- TABLE 05. SECURE ACCESS SERVICES EDGE MARKET FOR LARGE ENTERPRISES, BY REGION, 2022-2032 ($MILLION)
- TABLE 06. SECURE ACCESS SERVICES EDGE MARKET FOR SMES, BY REGION, 2022-2032 ($MILLION)
- TABLE 07. GLOBAL SECURE ACCESS SERVICES EDGE MARKET, BY APPLICATION, 2022-2032 ($MILLION)
- TABLE 08. SECURE ACCESS SERVICES EDGE MARKET FOR GOVERNMENT, BY REGION, 2022-2032 ($MILLION)
- TABLE 09. SECURE ACCESS SERVICES EDGE MARKET FOR BFSI, BY REGION, 2022-2032 ($MILLION)
- TABLE 10. SECURE ACCESS SERVICES EDGE MARKET FOR RETAIL AND ECOMMERCE, BY REGION, 2022-2032 ($MILLION)
- TABLE 11. SECURE ACCESS SERVICES EDGE MARKET FOR IT AND ITES, BY REGION, 2022-2032 ($MILLION)
- TABLE 12. SECURE ACCESS SERVICES EDGE MARKET FOR OTHERS, BY REGION, 2022-2032 ($MILLION)
- TABLE 13. SECURE ACCESS SERVICES EDGE MARKET, BY REGION, 2022-2032 ($MILLION)
- TABLE 14. NORTH AMERICA SECURE ACCESS SERVICES EDGE MARKET, BY OFFERING, 2022-2032 ($MILLION)
- TABLE 15. NORTH AMERICA SECURE ACCESS SERVICES EDGE MARKET, BY ORGANIZATION SIZE, 2022-2032 ($MILLION)
- TABLE 16. NORTH AMERICA SECURE ACCESS SERVICES EDGE MARKET, BY APPLICATION, 2022-2032 ($MILLION)
- TABLE 17. NORTH AMERICA SECURE ACCESS SERVICES EDGE MARKET, BY COUNTRY, 2022-2032 ($MILLION)
- TABLE 18. U.S. SECURE ACCESS SERVICES EDGE MARKET, BY OFFERING, 2022-2032 ($MILLION)
- TABLE 19. U.S. SECURE ACCESS SERVICES EDGE MARKET, BY ORGANIZATION SIZE, 2022-2032 ($MILLION)
- TABLE 20. U.S. SECURE ACCESS SERVICES EDGE MARKET, BY APPLICATION, 2022-2032 ($MILLION)
- TABLE 21. CANADA SECURE ACCESS SERVICES EDGE MARKET, BY OFFERING, 2022-2032 ($MILLION)
- TABLE 22. CANADA SECURE ACCESS SERVICES EDGE MARKET, BY ORGANIZATION SIZE, 2022-2032 ($MILLION)
- TABLE 23. CANADA SECURE ACCESS SERVICES EDGE MARKET, BY APPLICATION, 2022-2032 ($MILLION)
- TABLE 24. EUROPE SECURE ACCESS SERVICES EDGE MARKET, BY OFFERING, 2022-2032 ($MILLION)
- TABLE 25. EUROPE SECURE ACCESS SERVICES EDGE MARKET, BY ORGANIZATION SIZE, 2022-2032 ($MILLION)
- TABLE 26. EUROPE SECURE ACCESS SERVICES EDGE MARKET, BY APPLICATION, 2022-2032 ($MILLION)
- TABLE 27. EUROPE SECURE ACCESS SERVICES EDGE MARKET, BY COUNTRY, 2022-2032 ($MILLION)
- TABLE 28. UK SECURE ACCESS SERVICES EDGE MARKET, BY OFFERING, 2022-2032 ($MILLION)
- TABLE 29. UK SECURE ACCESS SERVICES EDGE MARKET, BY ORGANIZATION SIZE, 2022-2032 ($MILLION)
- TABLE 30. UK SECURE ACCESS SERVICES EDGE MARKET, BY APPLICATION, 2022-2032 ($MILLION)
- TABLE 31. GERMANY SECURE ACCESS SERVICES EDGE MARKET, BY OFFERING, 2022-2032 ($MILLION)
- TABLE 32. GERMANY SECURE ACCESS SERVICES EDGE MARKET, BY ORGANIZATION SIZE, 2022-2032 ($MILLION)
- TABLE 33. GERMANY SECURE ACCESS SERVICES EDGE MARKET, BY APPLICATION, 2022-2032 ($MILLION)
- TABLE 34. FRANCE SECURE ACCESS SERVICES EDGE MARKET, BY OFFERING, 2022-2032 ($MILLION)
- TABLE 35. FRANCE SECURE ACCESS SERVICES EDGE MARKET, BY ORGANIZATION SIZE, 2022-2032 ($MILLION)
- TABLE 36. FRANCE SECURE ACCESS SERVICES EDGE MARKET, BY APPLICATION, 2022-2032 ($MILLION)
- TABLE 37. ITALY SECURE ACCESS SERVICES EDGE MARKET, BY OFFERING, 2022-2032 ($MILLION)
- TABLE 38. ITALY SECURE ACCESS SERVICES EDGE MARKET, BY ORGANIZATION SIZE, 2022-2032 ($MILLION)
- TABLE 39. ITALY SECURE ACCESS SERVICES EDGE MARKET, BY APPLICATION, 2022-2032 ($MILLION)
- TABLE 40. SPAIN SECURE ACCESS SERVICES EDGE MARKET, BY OFFERING, 2022-2032 ($MILLION)
- TABLE 41. SPAIN SECURE ACCESS SERVICES EDGE MARKET, BY ORGANIZATION SIZE, 2022-2032 ($MILLION)
- TABLE 42. SPAIN SECURE ACCESS SERVICES EDGE MARKET, BY APPLICATION, 2022-2032 ($MILLION)
- TABLE 43. REST OF EUROPE SECURE ACCESS SERVICES EDGE MARKET, BY OFFERING, 2022-2032 ($MILLION)
- TABLE 44. REST OF EUROPE SECURE ACCESS SERVICES EDGE MARKET, BY ORGANIZATION SIZE, 2022-2032 ($MILLION)
- TABLE 45. REST OF EUROPE SECURE ACCESS SERVICES EDGE MARKET, BY APPLICATION, 2022-2032 ($MILLION)
- TABLE 46. ASIA-PACIFIC SECURE ACCESS SERVICES EDGE MARKET, BY OFFERING, 2022-2032 ($MILLION)
- TABLE 47. ASIA-PACIFIC SECURE ACCESS SERVICES EDGE MARKET, BY ORGANIZATION SIZE, 2022-2032 ($MILLION)
- TABLE 48. ASIA-PACIFIC SECURE ACCESS SERVICES EDGE MARKET, BY APPLICATION, 2022-2032 ($MILLION)
- TABLE 49. ASIA-PACIFIC SECURE ACCESS SERVICES EDGE MARKET, BY COUNTRY, 2022-2032 ($MILLION)
- TABLE 50. CHINA SECURE ACCESS SERVICES EDGE MARKET, BY OFFERING, 2022-2032 ($MILLION)
- TABLE 51. CHINA SECURE ACCESS SERVICES EDGE MARKET, BY ORGANIZATION SIZE, 2022-2032 ($MILLION)
- TABLE 52. CHINA SECURE ACCESS SERVICES EDGE MARKET, BY APPLICATION, 2022-2032 ($MILLION)
- TABLE 53. JAPAN SECURE ACCESS SERVICES EDGE MARKET, BY OFFERING, 2022-2032 ($MILLION)
- TABLE 54. JAPAN SECURE ACCESS SERVICES EDGE MARKET, BY ORGANIZATION SIZE, 2022-2032 ($MILLION)
- TABLE 55. JAPAN SECURE ACCESS SERVICES EDGE MARKET, BY APPLICATION, 2022-2032 ($MILLION)
- TABLE 56. INDIA SECURE ACCESS SERVICES EDGE MARKET, BY OFFERING, 2022-2032 ($MILLION)
- TABLE 57. INDIA SECURE ACCESS SERVICES EDGE MARKET, BY ORGANIZATION SIZE, 2022-2032 ($MILLION)
- TABLE 58. INDIA SECURE ACCESS SERVICES EDGE MARKET, BY APPLICATION, 2022-2032 ($MILLION)
- TABLE 59. AUSTRALIA SECURE ACCESS SERVICES EDGE MARKET, BY OFFERING, 2022-2032 ($MILLION)
- TABLE 60. AUSTRALIA SECURE ACCESS SERVICES EDGE MARKET, BY ORGANIZATION SIZE, 2022-2032 ($MILLION)
- TABLE 61. AUSTRALIA SECURE ACCESS SERVICES EDGE MARKET, BY APPLICATION, 2022-2032 ($MILLION)
- TABLE 62. SOUTH KOREA SECURE ACCESS SERVICES EDGE MARKET, BY OFFERING, 2022-2032 ($MILLION)
- TABLE 63. SOUTH KOREA SECURE ACCESS SERVICES EDGE MARKET, BY ORGANIZATION SIZE, 2022-2032 ($MILLION)
- TABLE 64. SOUTH KOREA SECURE ACCESS SERVICES EDGE MARKET, BY APPLICATION, 2022-2032 ($MILLION)
- TABLE 65. REST OF ASIA-PACIFIC SECURE ACCESS SERVICES EDGE MARKET, BY OFFERING, 2022-2032 ($MILLION)
- TABLE 66. REST OF ASIA-PACIFIC SECURE ACCESS SERVICES EDGE MARKET, BY ORGANIZATION SIZE, 2022-2032 ($MILLION)
- TABLE 67. REST OF ASIA-PACIFIC SECURE ACCESS SERVICES EDGE MARKET, BY APPLICATION, 2022-2032 ($MILLION)
- TABLE 68. LATIN AMERICA SECURE ACCESS SERVICES EDGE MARKET, BY OFFERING, 2022-2032 ($MILLION)
- TABLE 69. LATIN AMERICA SECURE ACCESS SERVICES EDGE MARKET, BY ORGANIZATION SIZE, 2022-2032 ($MILLION)
- TABLE 70. LATIN AMERICA SECURE ACCESS SERVICES EDGE MARKET, BY APPLICATION, 2022-2032 ($MILLION)
- TABLE 71. LATIN AMERICA SECURE ACCESS SERVICES EDGE MARKET, BY COUNTRY, 2022-2032 ($MILLION)
- TABLE 72. ARGENTINA SECURE ACCESS SERVICES EDGE MARKET, BY OFFERING, 2022-2032 ($MILLION)
- TABLE 73. ARGENTINA SECURE ACCESS SERVICES EDGE MARKET, BY ORGANIZATION SIZE, 2022-2032 ($MILLION)
- TABLE 74. ARGENTINA SECURE ACCESS SERVICES EDGE MARKET, BY APPLICATION, 2022-2032 ($MILLION)
- TABLE 75. BRAZIL SECURE ACCESS SERVICES EDGE MARKET, BY OFFERING, 2022-2032 ($MILLION)
- TABLE 76. BRAZIL SECURE ACCESS SERVICES EDGE MARKET, BY ORGANIZATION SIZE, 2022-2032 ($MILLION)
- TABLE 77. BRAZIL SECURE ACCESS SERVICES EDGE MARKET, BY APPLICATION, 2022-2032 ($MILLION)
- TABLE 78. COLOMBIA SECURE ACCESS SERVICES EDGE MARKET, BY OFFERING, 2022-2032 ($MILLION)
- TABLE 79. COLOMBIA SECURE ACCESS SERVICES EDGE MARKET, BY ORGANIZATION SIZE, 2022-2032 ($MILLION)
- TABLE 80. COLOMBIA SECURE ACCESS SERVICES EDGE MARKET, BY APPLICATION, 2022-2032 ($MILLION)
- TABLE 81. REST OF LATIN AMERICA SECURE ACCESS SERVICES EDGE MARKET, BY OFFERING, 2022-2032 ($MILLION)
- TABLE 82. REST OF LATIN AMERICA SECURE ACCESS SERVICES EDGE MARKET, BY ORGANIZATION SIZE, 2022-2032 ($MILLION)
- TABLE 83. REST OF LATIN AMERICA SECURE ACCESS SERVICES EDGE MARKET, BY APPLICATION, 2022-2032 ($MILLION)
- TABLE 84. MIDDLE EAST AND AFRICA SECURE ACCESS SERVICES EDGE MARKET, BY OFFERING, 2022-2032 ($MILLION)
- TABLE 85. MIDDLE EAST AND AFRICA SECURE ACCESS SERVICES EDGE MARKET, BY ORGANIZATION SIZE, 2022-2032 ($MILLION)
- TABLE 86. MIDDLE EAST AND AFRICA SECURE ACCESS SERVICES EDGE MARKET, BY APPLICATION, 2022-2032 ($MILLION)
- TABLE 87. MIDDLE EAST AND AFRICA SECURE ACCESS SERVICES EDGE MARKET, BY COUNTRY, 2022-2032 ($MILLION)
- TABLE 88. SAUDI ARABIA SECURE ACCESS SERVICES EDGE MARKET, BY OFFERING, 2022-2032 ($MILLION)
- TABLE 89. SAUDI ARABIA SECURE ACCESS SERVICES EDGE MARKET, BY ORGANIZATION SIZE, 2022-2032 ($MILLION)
- TABLE 90. SAUDI ARABIA SECURE ACCESS SERVICES EDGE MARKET, BY APPLICATION, 2022-2032 ($MILLION)
- TABLE 91. SOUTH AFRICA SECURE ACCESS SERVICES EDGE MARKET, BY OFFERING, 2022-2032 ($MILLION)
- TABLE 92. SOUTH AFRICA SECURE ACCESS SERVICES EDGE MARKET, BY ORGANIZATION SIZE, 2022-2032 ($MILLION)
- TABLE 93. SOUTH AFRICA SECURE ACCESS SERVICES EDGE MARKET, BY APPLICATION, 2022-2032 ($MILLION)
- TABLE 94. UAE SECURE ACCESS SERVICES EDGE MARKET, BY OFFERING, 2022-2032 ($MILLION)
- TABLE 95. UAE SECURE ACCESS SERVICES EDGE MARKET, BY ORGANIZATION SIZE, 2022-2032 ($MILLION)
- TABLE 96. UAE SECURE ACCESS SERVICES EDGE MARKET, BY APPLICATION, 2022-2032 ($MILLION)
- TABLE 97. REST OF MIDDLE EAST AND AFRICA SECURE ACCESS SERVICES EDGE MARKET, BY OFFERING, 2022-2032 ($MILLION)
- TABLE 98. REST OF MIDDLE EAST AND AFRICA SECURE ACCESS SERVICES EDGE MARKET, BY ORGANIZATION SIZE, 2022-2032 ($MILLION)
- TABLE 99. REST OF MIDDLE EAST AND AFRICA SECURE ACCESS SERVICES EDGE MARKET, BY APPLICATION, 2022-2032 ($MILLION)
- TABLE 100. MCAFEE: KEY EXECUTIVES
- TABLE 101. MCAFEE: COMPANY SNAPSHOT
- TABLE 102. MCAFEE: PRODUCT SEGMENTS
- TABLE 103. MCAFEE: SERVICE SEGMENTS
- TABLE 104. MCAFEE: PRODUCT PORTFOLIO
- TABLE 105. MCAFEE: KEY STRATERGIES
- TABLE 106. NETSKOPE, INC.: KEY EXECUTIVES
- TABLE 107. NETSKOPE, INC.: COMPANY SNAPSHOT
- TABLE 108. NETSKOPE, INC.: PRODUCT SEGMENTS
- TABLE 109. NETSKOPE, INC.: SERVICE SEGMENTS
- TABLE 110. NETSKOPE, INC.: PRODUCT PORTFOLIO
- TABLE 111. NETSKOPE, INC.: KEY STRATERGIES
- TABLE 112. PALO ALTO NETWORK: KEY EXECUTIVES
- TABLE 113. PALO ALTO NETWORK: COMPANY SNAPSHOT
- TABLE 114. PALO ALTO NETWORK: PRODUCT SEGMENTS
- TABLE 115. PALO ALTO NETWORK: SERVICE SEGMENTS
- TABLE 116. PALO ALTO NETWORK: PRODUCT PORTFOLIO
- TABLE 117. PALO ALTO NETWORK: KEY STRATERGIES
- TABLE 118. CATO NETWORKS: KEY EXECUTIVES
- TABLE 119. CATO NETWORKS: COMPANY SNAPSHOT
- TABLE 120. CATO NETWORKS: PRODUCT SEGMENTS
- TABLE 121. CATO NETWORKS: SERVICE SEGMENTS
- TABLE 122. CATO NETWORKS: PRODUCT PORTFOLIO
- TABLE 123. CATO NETWORKS: KEY STRATERGIES
- TABLE 124. VMWARE: KEY EXECUTIVES
- TABLE 125. VMWARE: COMPANY SNAPSHOT
- TABLE 126. VMWARE: PRODUCT SEGMENTS
- TABLE 127. VMWARE: SERVICE SEGMENTS
- TABLE 128. VMWARE: PRODUCT PORTFOLIO
- TABLE 129. VMWARE: KEY STRATERGIES
- TABLE 130. CHECK POINT SOFTWARE TECH. LTD.: KEY EXECUTIVES
- TABLE 131. CHECK POINT SOFTWARE TECH. LTD.: COMPANY SNAPSHOT
- TABLE 132. CHECK POINT SOFTWARE TECH. LTD.: PRODUCT SEGMENTS
- TABLE 133. CHECK POINT SOFTWARE TECH. LTD.: SERVICE SEGMENTS
- TABLE 134. CHECK POINT SOFTWARE TECH. LTD.: PRODUCT PORTFOLIO
- TABLE 135. CHECK POINT SOFTWARE TECH. LTD.: KEY STRATERGIES
- TABLE 136. FORTINET: KEY EXECUTIVES
- TABLE 137. FORTINET: COMPANY SNAPSHOT
- TABLE 138. FORTINET: PRODUCT SEGMENTS
- TABLE 139. FORTINET: SERVICE SEGMENTS
- TABLE 140. FORTINET: PRODUCT PORTFOLIO
- TABLE 141. FORTINET: KEY STRATERGIES
- TABLE 142. CISCO SYSTEMS INC.: KEY EXECUTIVES
- TABLE 143. CISCO SYSTEMS INC.: COMPANY SNAPSHOT
- TABLE 144. CISCO SYSTEMS INC.: PRODUCT SEGMENTS
- TABLE 145. CISCO SYSTEMS INC.: SERVICE SEGMENTS
- TABLE 146. CISCO SYSTEMS INC.: PRODUCT PORTFOLIO
- TABLE 147. CISCO SYSTEMS INC.: KEY STRATERGIES
- TABLE 148. ZSCALER, INC.: KEY EXECUTIVES
- TABLE 149. ZSCALER, INC.: COMPANY SNAPSHOT
- TABLE 150. ZSCALER, INC.: PRODUCT SEGMENTS
- TABLE 151. ZSCALER, INC.: SERVICE SEGMENTS
- TABLE 152. ZSCALER, INC.: PRODUCT PORTFOLIO
- TABLE 153. ZSCALER, INC.: KEY STRATERGIES
- TABLE 154. VERSA NETWORKS, INC.: KEY EXECUTIVES
- TABLE 155. VERSA NETWORKS, INC.: COMPANY SNAPSHOT
- TABLE 156. VERSA NETWORKS, INC.: PRODUCT SEGMENTS
- TABLE 157. VERSA NETWORKS, INC.: SERVICE SEGMENTS
- TABLE 158. VERSA NETWORKS, INC.: PRODUCT PORTFOLIO
- TABLE 159. VERSA NETWORKS, INC.: KEY STRATERGIES
LIST OF FIGURES
- FIGURE 01. SECURE ACCESS SERVICES EDGE MARKET, 2022-2032
- FIGURE 02. SEGMENTATION OF SECURE ACCESS SERVICES EDGE MARKET,2022-2032
- FIGURE 03. TOP IMPACTING FACTORS IN SECURE ACCESS SERVICES EDGE MARKET
- FIGURE 04. TOP INVESTMENT POCKETS IN SECURE ACCESS SERVICES EDGE MARKET (2023-2032)
- FIGURE 05. BARGAINING POWER OF SUPPLIERS
- FIGURE 06. BARGAINING POWER OF BUYERS
- FIGURE 07. THREAT OF SUBSTITUTION
- FIGURE 08. THREAT OF SUBSTITUTION
- FIGURE 09. COMPETITIVE RIVALRY
- FIGURE 10. GLOBAL SECURE ACCESS SERVICES EDGE MARKET:DRIVERS, RESTRAINTS AND OPPORTUNITIES
- FIGURE 11. SECURE ACCESS SERVICES EDGE MARKET, BY OFFERING, 2022 AND 2032(%)
- FIGURE 12. COMPARATIVE SHARE ANALYSIS OF SECURE ACCESS SERVICES EDGE MARKET FOR NETWORK AS A SERVICE, BY COUNTRY 2022 AND 2032(%)
- FIGURE 13. COMPARATIVE SHARE ANALYSIS OF SECURE ACCESS SERVICES EDGE MARKET FOR SECURITY AS A SERVICE, BY COUNTRY 2022 AND 2032(%)
- FIGURE 14. SECURE ACCESS SERVICES EDGE MARKET, BY ORGANIZATION SIZE, 2022 AND 2032(%)
- FIGURE 15. COMPARATIVE SHARE ANALYSIS OF SECURE ACCESS SERVICES EDGE MARKET FOR LARGE ENTERPRISES, BY COUNTRY 2022 AND 2032(%)
- FIGURE 16. COMPARATIVE SHARE ANALYSIS OF SECURE ACCESS SERVICES EDGE MARKET FOR SMES, BY COUNTRY 2022 AND 2032(%)
- FIGURE 17. SECURE ACCESS SERVICES EDGE MARKET, BY APPLICATION, 2022 AND 2032(%)
- FIGURE 18. COMPARATIVE SHARE ANALYSIS OF SECURE ACCESS SERVICES EDGE MARKET FOR GOVERNMENT, BY COUNTRY 2022 AND 2032(%)
- FIGURE 19. COMPARATIVE SHARE ANALYSIS OF SECURE ACCESS SERVICES EDGE MARKET FOR BFSI, BY COUNTRY 2022 AND 2032(%)
- FIGURE 20. COMPARATIVE SHARE ANALYSIS OF SECURE ACCESS SERVICES EDGE MARKET FOR RETAIL AND ECOMMERCE, BY COUNTRY 2022 AND 2032(%)
- FIGURE 21. COMPARATIVE SHARE ANALYSIS OF SECURE ACCESS SERVICES EDGE MARKET FOR IT AND ITES, BY COUNTRY 2022 AND 2032(%)
- FIGURE 22. COMPARATIVE SHARE ANALYSIS OF SECURE ACCESS SERVICES EDGE MARKET FOR OTHERS, BY COUNTRY 2022 AND 2032(%)
- FIGURE 23. SECURE ACCESS SERVICES EDGE MARKET BY REGION, 2022 AND 2032(%)
- FIGURE 24. U.S. SECURE ACCESS SERVICES EDGE MARKET, 2022-2032 ($MILLION)
- FIGURE 25. CANADA SECURE ACCESS SERVICES EDGE MARKET, 2022-2032 ($MILLION)
- FIGURE 26. UK SECURE ACCESS SERVICES EDGE MARKET, 2022-2032 ($MILLION)
- FIGURE 27. GERMANY SECURE ACCESS SERVICES EDGE MARKET, 2022-2032 ($MILLION)
- FIGURE 28. FRANCE SECURE ACCESS SERVICES EDGE MARKET, 2022-2032 ($MILLION)
- FIGURE 29. ITALY SECURE ACCESS SERVICES EDGE MARKET, 2022-2032 ($MILLION)
- FIGURE 30. SPAIN SECURE ACCESS SERVICES EDGE MARKET, 2022-2032 ($MILLION)
- FIGURE 31. REST OF EUROPE SECURE ACCESS SERVICES EDGE MARKET, 2022-2032 ($MILLION)
- FIGURE 32. CHINA SECURE ACCESS SERVICES EDGE MARKET, 2022-2032 ($MILLION)
- FIGURE 33. JAPAN SECURE ACCESS SERVICES EDGE MARKET, 2022-2032 ($MILLION)
- FIGURE 34. INDIA SECURE ACCESS SERVICES EDGE MARKET, 2022-2032 ($MILLION)
- FIGURE 35. AUSTRALIA SECURE ACCESS SERVICES EDGE MARKET, 2022-2032 ($MILLION)
- FIGURE 36. SOUTH KOREA SECURE ACCESS SERVICES EDGE MARKET, 2022-2032 ($MILLION)
- FIGURE 37. REST OF ASIA-PACIFIC SECURE ACCESS SERVICES EDGE MARKET, 2022-2032 ($MILLION)
- FIGURE 38. ARGENTINA SECURE ACCESS SERVICES EDGE MARKET, 2022-2032 ($MILLION)
- FIGURE 39. BRAZIL SECURE ACCESS SERVICES EDGE MARKET, 2022-2032 ($MILLION)
- FIGURE 40. COLOMBIA SECURE ACCESS SERVICES EDGE MARKET, 2022-2032 ($MILLION)
- FIGURE 41. REST OF LATIN AMERICA SECURE ACCESS SERVICES EDGE MARKET, 2022-2032 ($MILLION)
- FIGURE 42. SAUDI ARABIA SECURE ACCESS SERVICES EDGE MARKET, 2022-2032 ($MILLION)
- FIGURE 43. SOUTH AFRICA SECURE ACCESS SERVICES EDGE MARKET, 2022-2032 ($MILLION)
- FIGURE 44. UAE SECURE ACCESS SERVICES EDGE MARKET, 2022-2032 ($MILLION)
- FIGURE 45. REST OF MIDDLE EAST AND AFRICA SECURE ACCESS SERVICES EDGE MARKET, 2022-2032 ($MILLION)
- FIGURE 46. TOP WINNING STRATEGIES, BY YEAR
- FIGURE 47. TOP WINNING STRATEGIES, BY DEVELOPMENT
- FIGURE 48. TOP WINNING STRATEGIES, BY COMPANY
- FIGURE 49. PRODUCT MAPPING OF TOP 10 PLAYERS
- FIGURE 50. COMPETITIVE DASHBOARD
- FIGURE 51. COMPETITIVE HEATMAP: SECURE ACCESS SERVICES EDGE MARKET
- FIGURE 52. TOP PLAYER POSITIONING, 2022

