
PUBLISHER: Allied Market Research | PRODUCT CODE: 1447173

PUBLISHER: Allied Market Research | PRODUCT CODE: 1447173
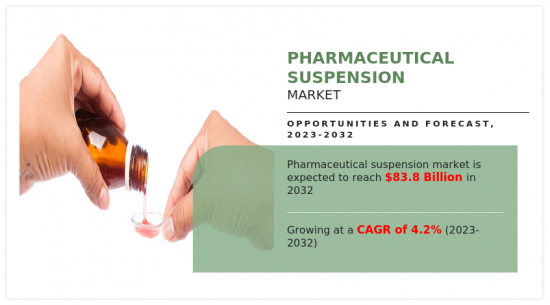
Pharmaceutical Suspension Market By Type, By Indication, By End User, By Distribution Channel: Global Opportunity Analysis and Industry Forecast, 2023-2032
The The pharmaceutical suspension market was valued at $55.5 billion in 2022, and is estimated to reach $83.8 billion by 2032, growing at a CAGR of 4.2% from 2023 to 2032.
Pharmaceutical suspensions are liquid formulations comprising finely dispersed solid particles in a liquid medium, often for oral or parenteral administration. These suspensions provide a versatile drug delivery system allowing for enhanced stability and bioavailability of poorly soluble drugs. The solid particles, typically insoluble drugs, are uniformly dispersed in the liquid phase, preventing settling. Pharmaceutical suspensions offer advantages such as ease of administration, improved patient compliance, and flexibility in dosage adjustments. They play a crucial role in delivering drugs with variable solubility profiles, ensuring therapeutic efficacy. The formulation's adaptability makes it a preferred choice for diverse medical conditions, contributing to its widespread use in the pharmaceutical industry.
The pharmaceutical suspensions market is witnessing significant growth, attributed to rise in prevalence of chronic conditions such as infectious diseases, cancer, and neurological disorders. According to the American Cancer Society, in 2023, the U.S. alone accounted for 1,958,310 new cancer cases. Similarly, according to the National Institutes of Health, more than 40% of people globally suffer from gastrointestinal complications. This surge in disease incidence emphasizes the critical need for effective drug delivery systems. Pharmaceutical suspensions play a pivotal role in the market, offering a versatile platform for administering medications.
As these chronic conditions become more pervasive, the pharmaceutical suspensions market is poised for expansion, driven by the imperative to address the complex treatment requirements associated with such health challenges. However, limited drug compatibility hinders the market growth as not all medications are effectively delivered through suspensions due to stability and solubility issues. In addition, manufacturing complexities such as requiring specialized equipment and processes, increase production costs and restrict the number of manufacturers, limiting market accessibility and affordability.
The pharmaceutical suspension market is segmented into type, indication, end user, distribution channel, and region. On the basis of type, the market is segmented into oral, parenteral, and others. On the basis of indication, it is segmented into infectious diseases, cancer, gastrointestinal, neurological, and others. On the basis of end user, the market is segmented into hospitals and clinics, home care settings, and others. On the basis of distribution channel, the market is segmented into hospital pharmacies, drug store and retail pharmacies, and online providers. Region-wise, the market is analyzed across North America, Europe, Asia-Pacific, and LAMEA.
The major players that operate in the pharmaceutical suspension market include Pfizer Inc., Merck & Co., Inc., AstraZeneca plc, Eli Lilly and Company, Bayer AG, Sanofi, Lupin, Glenmark Pharmaceuticals Limited, Novartis AG, and Teva Pharmaceutical Industries Limited. The key players have adopted key strategies such as product approval and collaboration to expand their product portfolio.
Key Benefits For Stakeholders
- This report provides a quantitative analysis of the market segments, current trends, estimations, and dynamics of the pharmaceutical suspension market analysis from 2022 to 2032 to identify the prevailing pharmaceutical suspension market opportunities.
- The market research is offered along with information related to key drivers, restraints, and opportunities.
- Porter's five forces analysis highlights the potency of buyers and suppliers to enable stakeholders make profit-oriented business decisions and strengthen their supplier-buyer network.
- In-depth analysis of the pharmaceutical suspension market segmentation assists to determine the prevailing market opportunities.
- Major countries in each region are mapped according to their revenue contribution to the global market.
- Market player positioning facilitates benchmarking and provides a clear understanding of the present position of the market players.
- The report includes the analysis of the regional as well as global pharmaceutical suspension market trends, key players, market segments, application areas, and market growth strategies.
Additional benefits you will get with this purchase are:
- Quarterly Update and* (only available with a corporate license, on listed price)
- 5 additional Company Profile of client Choice pre- or Post-purchase, as a free update.
- Free Upcoming Version on the Purchase of Five and Enterprise User License.
- 16 analyst hours of support* (post-purchase, if you find additional data requirements upon review of the report, you may receive support amounting to 16 analyst hours to solve questions, and post-sale queries)
- 15% Free Customization* (in case the scope or segment of the report does not match your requirements, 15% is equivalent to 3 working days of free work, applicable once)
- Free data Pack on the Five and Enterprise User License. (Excel version of the report)
- Free Updated report if the report is 6-12 months old or older.
- 24-hour priority response*
- Free Industry updates and white papers.
Possible Customization with this report (with additional cost and timeline, please talk to the sales executive to know more)
- Technology Trend Analysis
- Patient/epidemiology data at country, region, global level
- Regulatory Guidelines
- Additional company profiles with specific to client's interest
- Expanded list for Company Profiles
- Historic market data
- SWOT Analysis
Key Market Segments
By Type
- Oral
- Parenteral
- Others
By Indication
- Infectious Diseases
- Cancer
- Gastrointestinal
- Neurological
- Others
By End User
- Hospitals and Clinics
- Home Care Settings
- Others
By Distribution Channel
- Hospital Pharmacies
- Drug Store and Retail Pharmacies
- Online Providers
By Region
- North America
- U.S.
- Canada
- Mexico
- Europe
- Germany
- France
- UK
- Italy
- Spain
- Rest of Europe
- Asia-Pacific
- Japan
- China
- India
- Australia
- South Korea
- Rest of Asia-Pacific
- LAMEA
- Brazil
- Saudi Arabia
- South Africa
- Rest of LAMEA
Key Market Players:
- Pfizer Inc.
- AstraZeneca plc
- Eli Lilly and Company.
- Sanofi
- Lupin
- Novartis AG
- Teva Pharmaceutical Industries Limited
- Merck & Co., Inc.
- Bayer AG
- Glenmark Pharmaceuticals Limited
TABLE OF CONTENTS
CHAPTER 1: INTRODUCTION
- 1.1. Report description
- 1.2. Key market segments
- 1.3. Key benefits to the stakeholders
- 1.4. Research methodology
- 1.4.1. Primary research
- 1.4.2. Secondary research
- 1.4.3. Analyst tools and models
CHAPTER 2: EXECUTIVE SUMMARY
- 2.1. CXO Perspective
CHAPTER 3: MARKET OVERVIEW
- 3.1. Market definition and scope
- 3.2. Key findings
- 3.2.1. Top impacting factors
- 3.2.2. Top investment pockets
- 3.3. Porter's five forces analysis
- 3.3.1. High bargaining power of suppliers
- 3.3.2. Moderate threat of new entrants
- 3.3.3. High threat of substitutes
- 3.3.4. Moderate intensity of rivalry
- 3.3.5. Moderate bargaining power of buyers
- 3.4. Market dynamics
- 3.4.1. Drivers
- 3.4.1.1. Increased Drug Development Activities
- 3.4.1.2. Patient Compliance offered by pharmaceutical suspensions
- 3.4.1.3. Availability of generic pharmaceutical suspensions
- 3.4.2. Restraints
- 3.4.2.1. Limited drug compatibility
- 3.4.3. Opportunities
- 3.4.3.1. Growing initiatives for market expansion
- 3.4.1. Drivers
CHAPTER 4: PHARMACEUTICAL SUSPENSION MARKET, BY TYPE
- 4.1. Overview
- 4.1.1. Market size and forecast
- 4.2. Oral
- 4.2.1. Key market trends, growth factors and opportunities
- 4.2.2. Market size and forecast, by region
- 4.2.3. Market share analysis by country
- 4.3. Parenteral
- 4.3.1. Key market trends, growth factors and opportunities
- 4.3.2. Market size and forecast, by region
- 4.3.3. Market share analysis by country
- 4.4. Others
- 4.4.1. Key market trends, growth factors and opportunities
- 4.4.2. Market size and forecast, by region
- 4.4.3. Market share analysis by country
CHAPTER 5: PHARMACEUTICAL SUSPENSION MARKET, BY INDICATION
- 5.1. Overview
- 5.1.1. Market size and forecast
- 5.2. Infectious Diseases
- 5.2.1. Key market trends, growth factors and opportunities
- 5.2.2. Market size and forecast, by region
- 5.2.3. Market share analysis by country
- 5.3. Cancer
- 5.3.1. Key market trends, growth factors and opportunities
- 5.3.2. Market size and forecast, by region
- 5.3.3. Market share analysis by country
- 5.4. Gastrointestinal
- 5.4.1. Key market trends, growth factors and opportunities
- 5.4.2. Market size and forecast, by region
- 5.4.3. Market share analysis by country
- 5.5. Neurological
- 5.5.1. Key market trends, growth factors and opportunities
- 5.5.2. Market size and forecast, by region
- 5.5.3. Market share analysis by country
- 5.6. Others
- 5.6.1. Key market trends, growth factors and opportunities
- 5.6.2. Market size and forecast, by region
- 5.6.3. Market share analysis by country
CHAPTER 6: PHARMACEUTICAL SUSPENSION MARKET, BY END USER
- 6.1. Overview
- 6.1.1. Market size and forecast
- 6.2. Hospitals and Clinics
- 6.2.1. Key market trends, growth factors and opportunities
- 6.2.2. Market size and forecast, by region
- 6.2.3. Market share analysis by country
- 6.3. Home Care Settings
- 6.3.1. Key market trends, growth factors and opportunities
- 6.3.2. Market size and forecast, by region
- 6.3.3. Market share analysis by country
- 6.4. Others
- 6.4.1. Key market trends, growth factors and opportunities
- 6.4.2. Market size and forecast, by region
- 6.4.3. Market share analysis by country
CHAPTER 7: PHARMACEUTICAL SUSPENSION MARKET, BY DISTRIBUTION CHANNEL
- 7.1. Overview
- 7.1.1. Market size and forecast
- 7.2. Hospital Pharmacies
- 7.2.1. Key market trends, growth factors and opportunities
- 7.2.2. Market size and forecast, by region
- 7.2.3. Market share analysis by country
- 7.3. Drug Store and Retail Pharmacies
- 7.3.1. Key market trends, growth factors and opportunities
- 7.3.2. Market size and forecast, by region
- 7.3.3. Market share analysis by country
- 7.4. Online Providers
- 7.4.1. Key market trends, growth factors and opportunities
- 7.4.2. Market size and forecast, by region
- 7.4.3. Market share analysis by country
CHAPTER 8: PHARMACEUTICAL SUSPENSION MARKET, BY REGION
- 8.1. Overview
- 8.1.1. Market size and forecast By Region
- 8.2. North America
- 8.2.1. Key market trends, growth factors and opportunities
- 8.2.2. Market size and forecast, by Type
- 8.2.3. Market size and forecast, by Indication
- 8.2.4. Market size and forecast, by End User
- 8.2.5. Market size and forecast, by Distribution Channel
- 8.2.6. Market size and forecast, by country
- 8.2.6.1. U.S.
- 8.2.6.1.1. Market size and forecast, by Type
- 8.2.6.1.2. Market size and forecast, by Indication
- 8.2.6.1.3. Market size and forecast, by End User
- 8.2.6.1.4. Market size and forecast, by Distribution Channel
- 8.2.6.2. Canada
- 8.2.6.2.1. Market size and forecast, by Type
- 8.2.6.2.2. Market size and forecast, by Indication
- 8.2.6.2.3. Market size and forecast, by End User
- 8.2.6.2.4. Market size and forecast, by Distribution Channel
- 8.2.6.3. Mexico
- 8.2.6.3.1. Market size and forecast, by Type
- 8.2.6.3.2. Market size and forecast, by Indication
- 8.2.6.3.3. Market size and forecast, by End User
- 8.2.6.3.4. Market size and forecast, by Distribution Channel
- 8.3. Europe
- 8.3.1. Key market trends, growth factors and opportunities
- 8.3.2. Market size and forecast, by Type
- 8.3.3. Market size and forecast, by Indication
- 8.3.4. Market size and forecast, by End User
- 8.3.5. Market size and forecast, by Distribution Channel
- 8.3.6. Market size and forecast, by country
- 8.3.6.1. Germany
- 8.3.6.1.1. Market size and forecast, by Type
- 8.3.6.1.2. Market size and forecast, by Indication
- 8.3.6.1.3. Market size and forecast, by End User
- 8.3.6.1.4. Market size and forecast, by Distribution Channel
- 8.3.6.2. France
- 8.3.6.2.1. Market size and forecast, by Type
- 8.3.6.2.2. Market size and forecast, by Indication
- 8.3.6.2.3. Market size and forecast, by End User
- 8.3.6.2.4. Market size and forecast, by Distribution Channel
- 8.3.6.3. UK
- 8.3.6.3.1. Market size and forecast, by Type
- 8.3.6.3.2. Market size and forecast, by Indication
- 8.3.6.3.3. Market size and forecast, by End User
- 8.3.6.3.4. Market size and forecast, by Distribution Channel
- 8.3.6.4. Italy
- 8.3.6.4.1. Market size and forecast, by Type
- 8.3.6.4.2. Market size and forecast, by Indication
- 8.3.6.4.3. Market size and forecast, by End User
- 8.3.6.4.4. Market size and forecast, by Distribution Channel
- 8.3.6.5. Spain
- 8.3.6.5.1. Market size and forecast, by Type
- 8.3.6.5.2. Market size and forecast, by Indication
- 8.3.6.5.3. Market size and forecast, by End User
- 8.3.6.5.4. Market size and forecast, by Distribution Channel
- 8.3.6.6. Rest of Europe
- 8.3.6.6.1. Market size and forecast, by Type
- 8.3.6.6.2. Market size and forecast, by Indication
- 8.3.6.6.3. Market size and forecast, by End User
- 8.3.6.6.4. Market size and forecast, by Distribution Channel
- 8.4. Asia-Pacific
- 8.4.1. Key market trends, growth factors and opportunities
- 8.4.2. Market size and forecast, by Type
- 8.4.3. Market size and forecast, by Indication
- 8.4.4. Market size and forecast, by End User
- 8.4.5. Market size and forecast, by Distribution Channel
- 8.4.6. Market size and forecast, by country
- 8.4.6.1. Japan
- 8.4.6.1.1. Market size and forecast, by Type
- 8.4.6.1.2. Market size and forecast, by Indication
- 8.4.6.1.3. Market size and forecast, by End User
- 8.4.6.1.4. Market size and forecast, by Distribution Channel
- 8.4.6.2. China
- 8.4.6.2.1. Market size and forecast, by Type
- 8.4.6.2.2. Market size and forecast, by Indication
- 8.4.6.2.3. Market size and forecast, by End User
- 8.4.6.2.4. Market size and forecast, by Distribution Channel
- 8.4.6.3. India
- 8.4.6.3.1. Market size and forecast, by Type
- 8.4.6.3.2. Market size and forecast, by Indication
- 8.4.6.3.3. Market size and forecast, by End User
- 8.4.6.3.4. Market size and forecast, by Distribution Channel
- 8.4.6.4. Australia
- 8.4.6.4.1. Market size and forecast, by Type
- 8.4.6.4.2. Market size and forecast, by Indication
- 8.4.6.4.3. Market size and forecast, by End User
- 8.4.6.4.4. Market size and forecast, by Distribution Channel
- 8.4.6.5. South Korea
- 8.4.6.5.1. Market size and forecast, by Type
- 8.4.6.5.2. Market size and forecast, by Indication
- 8.4.6.5.3. Market size and forecast, by End User
- 8.4.6.5.4. Market size and forecast, by Distribution Channel
- 8.4.6.6. Rest of Asia-Pacific
- 8.4.6.6.1. Market size and forecast, by Type
- 8.4.6.6.2. Market size and forecast, by Indication
- 8.4.6.6.3. Market size and forecast, by End User
- 8.4.6.6.4. Market size and forecast, by Distribution Channel
- 8.5. LAMEA
- 8.5.1. Key market trends, growth factors and opportunities
- 8.5.2. Market size and forecast, by Type
- 8.5.3. Market size and forecast, by Indication
- 8.5.4. Market size and forecast, by End User
- 8.5.5. Market size and forecast, by Distribution Channel
- 8.5.6. Market size and forecast, by country
- 8.5.6.1. Brazil
- 8.5.6.1.1. Market size and forecast, by Type
- 8.5.6.1.2. Market size and forecast, by Indication
- 8.5.6.1.3. Market size and forecast, by End User
- 8.5.6.1.4. Market size and forecast, by Distribution Channel
- 8.5.6.2. Saudi Arabia
- 8.5.6.2.1. Market size and forecast, by Type
- 8.5.6.2.2. Market size and forecast, by Indication
- 8.5.6.2.3. Market size and forecast, by End User
- 8.5.6.2.4. Market size and forecast, by Distribution Channel
- 8.5.6.3. South Africa
- 8.5.6.3.1. Market size and forecast, by Type
- 8.5.6.3.2. Market size and forecast, by Indication
- 8.5.6.3.3. Market size and forecast, by End User
- 8.5.6.3.4. Market size and forecast, by Distribution Channel
- 8.5.6.4. Rest of LAMEA
- 8.5.6.4.1. Market size and forecast, by Type
- 8.5.6.4.2. Market size and forecast, by Indication
- 8.5.6.4.3. Market size and forecast, by End User
- 8.5.6.4.4. Market size and forecast, by Distribution Channel
CHAPTER 9: COMPETITIVE LANDSCAPE
- 9.1. Introduction
- 9.2. Top winning strategies
- 9.3. Product mapping of top 10 player
- 9.4. Competitive dashboard
- 9.5. Competitive heatmap
- 9.6. Top player positioning, 2022
CHAPTER 10: COMPANY PROFILES
- 10.1. Pfizer Inc.
- 10.1.1. Company overview
- 10.1.2. Key executives
- 10.1.3. Company snapshot
- 10.1.4. Operating business segments
- 10.1.5. Product portfolio
- 10.1.6. Business performance
- 10.2. Merck & Co., Inc.
- 10.2.1. Company overview
- 10.2.2. Key executives
- 10.2.3. Company snapshot
- 10.2.4. Operating business segments
- 10.2.5. Product portfolio
- 10.2.6. Business performance
- 10.2.7. Key strategic moves and developments
- 10.3. AstraZeneca plc
- 10.3.1. Company overview
- 10.3.2. Key executives
- 10.3.3. Company snapshot
- 10.3.4. Operating business segments
- 10.3.5. Product portfolio
- 10.3.6. Business performance
- 10.4. Eli Lilly and Company.
- 10.4.1. Company overview
- 10.4.2. Key executives
- 10.4.3. Company snapshot
- 10.4.4. Operating business segments
- 10.4.5. Product portfolio
- 10.4.6. Business performance
- 10.5. Bayer AG
- 10.5.1. Company overview
- 10.5.2. Key executives
- 10.5.3. Company snapshot
- 10.5.4. Operating business segments
- 10.5.5. Product portfolio
- 10.5.6. Business performance
- 10.6. Sanofi
- 10.6.1. Company overview
- 10.6.2. Key executives
- 10.6.3. Company snapshot
- 10.6.4. Operating business segments
- 10.6.5. Product portfolio
- 10.6.6. Business performance
- 10.7. Lupin
- 10.7.1. Company overview
- 10.7.2. Key executives
- 10.7.3. Company snapshot
- 10.7.4. Operating business segments
- 10.7.5. Product portfolio
- 10.7.6. Business performance
- 10.7.7. Key strategic moves and developments
- 10.8. Glenmark Pharmaceuticals Limited
- 10.8.1. Company overview
- 10.8.2. Key executives
- 10.8.3. Company snapshot
- 10.8.4. Operating business segments
- 10.8.5. Product portfolio
- 10.8.6. Business performance
- 10.8.7. Key strategic moves and developments
- 10.9. Novartis AG
- 10.9.1. Company overview
- 10.9.2. Key executives
- 10.9.3. Company snapshot
- 10.9.4. Operating business segments
- 10.9.5. Product portfolio
- 10.9.6. Business performance
- 10.10. Teva Pharmaceutical Industries Limited
- 10.10.1. Company overview
- 10.10.2. Key executives
- 10.10.3. Company snapshot
- 10.10.4. Operating business segments
- 10.10.5. Product portfolio
- 10.10.6. Business performance
- 10.10.7. Key strategic moves and developments
LIST OF TABLES
- TABLE 01. GLOBAL PHARMACEUTICAL SUSPENSION MARKET, BY TYPE, 2022-2032 ($MILLION)
- TABLE 02. PHARMACEUTICAL SUSPENSION MARKET FOR ORAL, BY REGION, 2022-2032 ($MILLION)
- TABLE 03. PHARMACEUTICAL SUSPENSION MARKET FOR PARENTERAL, BY REGION, 2022-2032 ($MILLION)
- TABLE 04. PHARMACEUTICAL SUSPENSION MARKET FOR OTHERS, BY REGION, 2022-2032 ($MILLION)
- TABLE 05. GLOBAL PHARMACEUTICAL SUSPENSION MARKET, BY INDICATION, 2022-2032 ($MILLION)
- TABLE 06. PHARMACEUTICAL SUSPENSION MARKET FOR INFECTIOUS DISEASES, BY REGION, 2022-2032 ($MILLION)
- TABLE 07. PHARMACEUTICAL SUSPENSION MARKET FOR CANCER, BY REGION, 2022-2032 ($MILLION)
- TABLE 08. PHARMACEUTICAL SUSPENSION MARKET FOR GASTROINTESTINAL, BY REGION, 2022-2032 ($MILLION)
- TABLE 09. PHARMACEUTICAL SUSPENSION MARKET FOR NEUROLOGICAL, BY REGION, 2022-2032 ($MILLION)
- TABLE 10. PHARMACEUTICAL SUSPENSION MARKET FOR OTHERS, BY REGION, 2022-2032 ($MILLION)
- TABLE 11. GLOBAL PHARMACEUTICAL SUSPENSION MARKET, BY END USER, 2022-2032 ($MILLION)
- TABLE 12. PHARMACEUTICAL SUSPENSION MARKET FOR HOSPITALS AND CLINICS, BY REGION, 2022-2032 ($MILLION)
- TABLE 13. PHARMACEUTICAL SUSPENSION MARKET FOR HOME CARE SETTINGS, BY REGION, 2022-2032 ($MILLION)
- TABLE 14. PHARMACEUTICAL SUSPENSION MARKET FOR OTHERS, BY REGION, 2022-2032 ($MILLION)
- TABLE 15. GLOBAL PHARMACEUTICAL SUSPENSION MARKET, BY DISTRIBUTION CHANNEL, 2022-2032 ($MILLION)
- TABLE 16. PHARMACEUTICAL SUSPENSION MARKET FOR HOSPITAL PHARMACIES, BY REGION, 2022-2032 ($MILLION)
- TABLE 17. PHARMACEUTICAL SUSPENSION MARKET FOR DRUG STORE AND RETAIL PHARMACIES, BY REGION, 2022-2032 ($MILLION)
- TABLE 18. PHARMACEUTICAL SUSPENSION MARKET FOR ONLINE PROVIDERS, BY REGION, 2022-2032 ($MILLION)
- TABLE 19. PHARMACEUTICAL SUSPENSION MARKET, BY REGION, 2022-2032 ($MILLION)
- TABLE 20. NORTH AMERICA PHARMACEUTICAL SUSPENSION MARKET, BY TYPE, 2022-2032 ($MILLION)
- TABLE 21. NORTH AMERICA PHARMACEUTICAL SUSPENSION MARKET, BY INDICATION, 2022-2032 ($MILLION)
- TABLE 22. NORTH AMERICA PHARMACEUTICAL SUSPENSION MARKET, BY END USER, 2022-2032 ($MILLION)
- TABLE 23. NORTH AMERICA PHARMACEUTICAL SUSPENSION MARKET, BY DISTRIBUTION CHANNEL, 2022-2032 ($MILLION)
- TABLE 24. NORTH AMERICA PHARMACEUTICAL SUSPENSION MARKET, BY COUNTRY, 2022-2032 ($MILLION)
- TABLE 25. U.S. PHARMACEUTICAL SUSPENSION MARKET, BY TYPE, 2022-2032 ($MILLION)
- TABLE 26. U.S. PHARMACEUTICAL SUSPENSION MARKET, BY INDICATION, 2022-2032 ($MILLION)
- TABLE 27. U.S. PHARMACEUTICAL SUSPENSION MARKET, BY END USER, 2022-2032 ($MILLION)
- TABLE 28. U.S. PHARMACEUTICAL SUSPENSION MARKET, BY DISTRIBUTION CHANNEL, 2022-2032 ($MILLION)
- TABLE 29. CANADA PHARMACEUTICAL SUSPENSION MARKET, BY TYPE, 2022-2032 ($MILLION)
- TABLE 30. CANADA PHARMACEUTICAL SUSPENSION MARKET, BY INDICATION, 2022-2032 ($MILLION)
- TABLE 31. CANADA PHARMACEUTICAL SUSPENSION MARKET, BY END USER, 2022-2032 ($MILLION)
- TABLE 32. CANADA PHARMACEUTICAL SUSPENSION MARKET, BY DISTRIBUTION CHANNEL, 2022-2032 ($MILLION)
- TABLE 33. MEXICO PHARMACEUTICAL SUSPENSION MARKET, BY TYPE, 2022-2032 ($MILLION)
- TABLE 34. MEXICO PHARMACEUTICAL SUSPENSION MARKET, BY INDICATION, 2022-2032 ($MILLION)
- TABLE 35. MEXICO PHARMACEUTICAL SUSPENSION MARKET, BY END USER, 2022-2032 ($MILLION)
- TABLE 36. MEXICO PHARMACEUTICAL SUSPENSION MARKET, BY DISTRIBUTION CHANNEL, 2022-2032 ($MILLION)
- TABLE 37. EUROPE PHARMACEUTICAL SUSPENSION MARKET, BY TYPE, 2022-2032 ($MILLION)
- TABLE 38. EUROPE PHARMACEUTICAL SUSPENSION MARKET, BY INDICATION, 2022-2032 ($MILLION)
- TABLE 39. EUROPE PHARMACEUTICAL SUSPENSION MARKET, BY END USER, 2022-2032 ($MILLION)
- TABLE 40. EUROPE PHARMACEUTICAL SUSPENSION MARKET, BY DISTRIBUTION CHANNEL, 2022-2032 ($MILLION)
- TABLE 41. EUROPE PHARMACEUTICAL SUSPENSION MARKET, BY COUNTRY, 2022-2032 ($MILLION)
- TABLE 42. GERMANY PHARMACEUTICAL SUSPENSION MARKET, BY TYPE, 2022-2032 ($MILLION)
- TABLE 43. GERMANY PHARMACEUTICAL SUSPENSION MARKET, BY INDICATION, 2022-2032 ($MILLION)
- TABLE 44. GERMANY PHARMACEUTICAL SUSPENSION MARKET, BY END USER, 2022-2032 ($MILLION)
- TABLE 45. GERMANY PHARMACEUTICAL SUSPENSION MARKET, BY DISTRIBUTION CHANNEL, 2022-2032 ($MILLION)
- TABLE 46. FRANCE PHARMACEUTICAL SUSPENSION MARKET, BY TYPE, 2022-2032 ($MILLION)
- TABLE 47. FRANCE PHARMACEUTICAL SUSPENSION MARKET, BY INDICATION, 2022-2032 ($MILLION)
- TABLE 48. FRANCE PHARMACEUTICAL SUSPENSION MARKET, BY END USER, 2022-2032 ($MILLION)
- TABLE 49. FRANCE PHARMACEUTICAL SUSPENSION MARKET, BY DISTRIBUTION CHANNEL, 2022-2032 ($MILLION)
- TABLE 50. UK PHARMACEUTICAL SUSPENSION MARKET, BY TYPE, 2022-2032 ($MILLION)
- TABLE 51. UK PHARMACEUTICAL SUSPENSION MARKET, BY INDICATION, 2022-2032 ($MILLION)
- TABLE 52. UK PHARMACEUTICAL SUSPENSION MARKET, BY END USER, 2022-2032 ($MILLION)
- TABLE 53. UK PHARMACEUTICAL SUSPENSION MARKET, BY DISTRIBUTION CHANNEL, 2022-2032 ($MILLION)
- TABLE 54. ITALY PHARMACEUTICAL SUSPENSION MARKET, BY TYPE, 2022-2032 ($MILLION)
- TABLE 55. ITALY PHARMACEUTICAL SUSPENSION MARKET, BY INDICATION, 2022-2032 ($MILLION)
- TABLE 56. ITALY PHARMACEUTICAL SUSPENSION MARKET, BY END USER, 2022-2032 ($MILLION)
- TABLE 57. ITALY PHARMACEUTICAL SUSPENSION MARKET, BY DISTRIBUTION CHANNEL, 2022-2032 ($MILLION)
- TABLE 58. SPAIN PHARMACEUTICAL SUSPENSION MARKET, BY TYPE, 2022-2032 ($MILLION)
- TABLE 59. SPAIN PHARMACEUTICAL SUSPENSION MARKET, BY INDICATION, 2022-2032 ($MILLION)
- TABLE 60. SPAIN PHARMACEUTICAL SUSPENSION MARKET, BY END USER, 2022-2032 ($MILLION)
- TABLE 61. SPAIN PHARMACEUTICAL SUSPENSION MARKET, BY DISTRIBUTION CHANNEL, 2022-2032 ($MILLION)
- TABLE 62. REST OF EUROPE PHARMACEUTICAL SUSPENSION MARKET, BY TYPE, 2022-2032 ($MILLION)
- TABLE 63. REST OF EUROPE PHARMACEUTICAL SUSPENSION MARKET, BY INDICATION, 2022-2032 ($MILLION)
- TABLE 64. REST OF EUROPE PHARMACEUTICAL SUSPENSION MARKET, BY END USER, 2022-2032 ($MILLION)
- TABLE 65. REST OF EUROPE PHARMACEUTICAL SUSPENSION MARKET, BY DISTRIBUTION CHANNEL, 2022-2032 ($MILLION)
- TABLE 66. ASIA-PACIFIC PHARMACEUTICAL SUSPENSION MARKET, BY TYPE, 2022-2032 ($MILLION)
- TABLE 67. ASIA-PACIFIC PHARMACEUTICAL SUSPENSION MARKET, BY INDICATION, 2022-2032 ($MILLION)
- TABLE 68. ASIA-PACIFIC PHARMACEUTICAL SUSPENSION MARKET, BY END USER, 2022-2032 ($MILLION)
- TABLE 69. ASIA-PACIFIC PHARMACEUTICAL SUSPENSION MARKET, BY DISTRIBUTION CHANNEL, 2022-2032 ($MILLION)
- TABLE 70. ASIA-PACIFIC PHARMACEUTICAL SUSPENSION MARKET, BY COUNTRY, 2022-2032 ($MILLION)
- TABLE 71. JAPAN PHARMACEUTICAL SUSPENSION MARKET, BY TYPE, 2022-2032 ($MILLION)
- TABLE 72. JAPAN PHARMACEUTICAL SUSPENSION MARKET, BY INDICATION, 2022-2032 ($MILLION)
- TABLE 73. JAPAN PHARMACEUTICAL SUSPENSION MARKET, BY END USER, 2022-2032 ($MILLION)
- TABLE 74. JAPAN PHARMACEUTICAL SUSPENSION MARKET, BY DISTRIBUTION CHANNEL, 2022-2032 ($MILLION)
- TABLE 75. CHINA PHARMACEUTICAL SUSPENSION MARKET, BY TYPE, 2022-2032 ($MILLION)
- TABLE 76. CHINA PHARMACEUTICAL SUSPENSION MARKET, BY INDICATION, 2022-2032 ($MILLION)
- TABLE 77. CHINA PHARMACEUTICAL SUSPENSION MARKET, BY END USER, 2022-2032 ($MILLION)
- TABLE 78. CHINA PHARMACEUTICAL SUSPENSION MARKET, BY DISTRIBUTION CHANNEL, 2022-2032 ($MILLION)
- TABLE 79. INDIA PHARMACEUTICAL SUSPENSION MARKET, BY TYPE, 2022-2032 ($MILLION)
- TABLE 80. INDIA PHARMACEUTICAL SUSPENSION MARKET, BY INDICATION, 2022-2032 ($MILLION)
- TABLE 81. INDIA PHARMACEUTICAL SUSPENSION MARKET, BY END USER, 2022-2032 ($MILLION)
- TABLE 82. INDIA PHARMACEUTICAL SUSPENSION MARKET, BY DISTRIBUTION CHANNEL, 2022-2032 ($MILLION)
- TABLE 83. AUSTRALIA PHARMACEUTICAL SUSPENSION MARKET, BY TYPE, 2022-2032 ($MILLION)
- TABLE 84. AUSTRALIA PHARMACEUTICAL SUSPENSION MARKET, BY INDICATION, 2022-2032 ($MILLION)
- TABLE 85. AUSTRALIA PHARMACEUTICAL SUSPENSION MARKET, BY END USER, 2022-2032 ($MILLION)
- TABLE 86. AUSTRALIA PHARMACEUTICAL SUSPENSION MARKET, BY DISTRIBUTION CHANNEL, 2022-2032 ($MILLION)
- TABLE 87. SOUTH KOREA PHARMACEUTICAL SUSPENSION MARKET, BY TYPE, 2022-2032 ($MILLION)
- TABLE 88. SOUTH KOREA PHARMACEUTICAL SUSPENSION MARKET, BY INDICATION, 2022-2032 ($MILLION)
- TABLE 89. SOUTH KOREA PHARMACEUTICAL SUSPENSION MARKET, BY END USER, 2022-2032 ($MILLION)
- TABLE 90. SOUTH KOREA PHARMACEUTICAL SUSPENSION MARKET, BY DISTRIBUTION CHANNEL, 2022-2032 ($MILLION)
- TABLE 91. REST OF ASIA-PACIFIC PHARMACEUTICAL SUSPENSION MARKET, BY TYPE, 2022-2032 ($MILLION)
- TABLE 92. REST OF ASIA-PACIFIC PHARMACEUTICAL SUSPENSION MARKET, BY INDICATION, 2022-2032 ($MILLION)
- TABLE 93. REST OF ASIA-PACIFIC PHARMACEUTICAL SUSPENSION MARKET, BY END USER, 2022-2032 ($MILLION)
- TABLE 94. REST OF ASIA-PACIFIC PHARMACEUTICAL SUSPENSION MARKET, BY DISTRIBUTION CHANNEL, 2022-2032 ($MILLION)
- TABLE 95. LAMEA PHARMACEUTICAL SUSPENSION MARKET, BY TYPE, 2022-2032 ($MILLION)
- TABLE 96. LAMEA PHARMACEUTICAL SUSPENSION MARKET, BY INDICATION, 2022-2032 ($MILLION)
- TABLE 97. LAMEA PHARMACEUTICAL SUSPENSION MARKET, BY END USER, 2022-2032 ($MILLION)
- TABLE 98. LAMEA PHARMACEUTICAL SUSPENSION MARKET, BY DISTRIBUTION CHANNEL, 2022-2032 ($MILLION)
- TABLE 99. LAMEA PHARMACEUTICAL SUSPENSION MARKET, BY COUNTRY, 2022-2032 ($MILLION)
- TABLE 100. BRAZIL PHARMACEUTICAL SUSPENSION MARKET, BY TYPE, 2022-2032 ($MILLION)
- TABLE 101. BRAZIL PHARMACEUTICAL SUSPENSION MARKET, BY INDICATION, 2022-2032 ($MILLION)
- TABLE 102. BRAZIL PHARMACEUTICAL SUSPENSION MARKET, BY END USER, 2022-2032 ($MILLION)
- TABLE 103. BRAZIL PHARMACEUTICAL SUSPENSION MARKET, BY DISTRIBUTION CHANNEL, 2022-2032 ($MILLION)
- TABLE 104. SAUDI ARABIA PHARMACEUTICAL SUSPENSION MARKET, BY TYPE, 2022-2032 ($MILLION)
- TABLE 105. SAUDI ARABIA PHARMACEUTICAL SUSPENSION MARKET, BY INDICATION, 2022-2032 ($MILLION)
- TABLE 106. SAUDI ARABIA PHARMACEUTICAL SUSPENSION MARKET, BY END USER, 2022-2032 ($MILLION)
- TABLE 107. SAUDI ARABIA PHARMACEUTICAL SUSPENSION MARKET, BY DISTRIBUTION CHANNEL, 2022-2032 ($MILLION)
- TABLE 108. SOUTH AFRICA PHARMACEUTICAL SUSPENSION MARKET, BY TYPE, 2022-2032 ($MILLION)
- TABLE 109. SOUTH AFRICA PHARMACEUTICAL SUSPENSION MARKET, BY INDICATION, 2022-2032 ($MILLION)
- TABLE 110. SOUTH AFRICA PHARMACEUTICAL SUSPENSION MARKET, BY END USER, 2022-2032 ($MILLION)
- TABLE 111. SOUTH AFRICA PHARMACEUTICAL SUSPENSION MARKET, BY DISTRIBUTION CHANNEL, 2022-2032 ($MILLION)
- TABLE 112. REST OF LAMEA PHARMACEUTICAL SUSPENSION MARKET, BY TYPE, 2022-2032 ($MILLION)
- TABLE 113. REST OF LAMEA PHARMACEUTICAL SUSPENSION MARKET, BY INDICATION, 2022-2032 ($MILLION)
- TABLE 114. REST OF LAMEA PHARMACEUTICAL SUSPENSION MARKET, BY END USER, 2022-2032 ($MILLION)
- TABLE 115. REST OF LAMEA PHARMACEUTICAL SUSPENSION MARKET, BY DISTRIBUTION CHANNEL, 2022-2032 ($MILLION)
- TABLE 116. PFIZER INC.: KEY EXECUTIVES
- TABLE 117. PFIZER INC.: COMPANY SNAPSHOT
- TABLE 118. PFIZER INC.: PRODUCT SEGMENTS
- TABLE 119. PFIZER INC.: PRODUCT PORTFOLIO
- TABLE 120. MERCK & CO., INC.: KEY EXECUTIVES
- TABLE 121. MERCK & CO., INC.: COMPANY SNAPSHOT
- TABLE 122. MERCK & CO., INC.: PRODUCT SEGMENTS
- TABLE 123. MERCK & CO., INC.: PRODUCT PORTFOLIO
- TABLE 124. MERCK & CO., INC.: KEY STRATERGIES
- TABLE 125. ASTRAZENECA PLC: KEY EXECUTIVES
- TABLE 126. ASTRAZENECA PLC: COMPANY SNAPSHOT
- TABLE 127. ASTRAZENECA PLC: PRODUCT SEGMENTS
- TABLE 128. ASTRAZENECA PLC: PRODUCT PORTFOLIO
- TABLE 129. ELI LILLY AND COMPANY.: KEY EXECUTIVES
- TABLE 130. ELI LILLY AND COMPANY.: COMPANY SNAPSHOT
- TABLE 131. ELI LILLY AND COMPANY.: PRODUCT SEGMENTS
- TABLE 132. ELI LILLY AND COMPANY.: PRODUCT PORTFOLIO
- TABLE 133. BAYER AG: KEY EXECUTIVES
- TABLE 134. BAYER AG: COMPANY SNAPSHOT
- TABLE 135. BAYER AG: PRODUCT SEGMENTS
- TABLE 136. BAYER AG: PRODUCT PORTFOLIO
- TABLE 137. SANOFI: KEY EXECUTIVES
- TABLE 138. SANOFI: COMPANY SNAPSHOT
- TABLE 139. SANOFI: PRODUCT SEGMENTS
- TABLE 140. SANOFI: PRODUCT PORTFOLIO
- TABLE 141. LUPIN: KEY EXECUTIVES
- TABLE 142. LUPIN: COMPANY SNAPSHOT
- TABLE 143. LUPIN: PRODUCT SEGMENTS
- TABLE 144. LUPIN: PRODUCT PORTFOLIO
- TABLE 145. LUPIN: KEY STRATERGIES
- TABLE 146. GLENMARK PHARMACEUTICALS LIMITED: KEY EXECUTIVES
- TABLE 147. GLENMARK PHARMACEUTICALS LIMITED: COMPANY SNAPSHOT
- TABLE 148. GLENMARK PHARMACEUTICALS LIMITED: PRODUCT SEGMENTS
- TABLE 149. GLENMARK PHARMACEUTICALS LIMITED: PRODUCT PORTFOLIO
- TABLE 150. GLENMARK PHARMACEUTICALS LIMITED: KEY STRATERGIES
- TABLE 151. NOVARTIS AG: KEY EXECUTIVES
- TABLE 152. NOVARTIS AG: COMPANY SNAPSHOT
- TABLE 153. NOVARTIS AG: PRODUCT SEGMENTS
- TABLE 154. NOVARTIS AG: PRODUCT PORTFOLIO
- TABLE 155. TEVA PHARMACEUTICAL INDUSTRIES LIMITED: KEY EXECUTIVES
- TABLE 156. TEVA PHARMACEUTICAL INDUSTRIES LIMITED: COMPANY SNAPSHOT
- TABLE 157. TEVA PHARMACEUTICAL INDUSTRIES LIMITED: PRODUCT SEGMENTS
- TABLE 158. TEVA PHARMACEUTICAL INDUSTRIES LIMITED: PRODUCT PORTFOLIO
- TABLE 159. TEVA PHARMACEUTICAL INDUSTRIES LIMITED: KEY STRATERGIES
LIST OF FIGURES
- FIGURE 01. PHARMACEUTICAL SUSPENSION MARKET, 2022-2032
- FIGURE 02. SEGMENTATION OF PHARMACEUTICAL SUSPENSION MARKET,2022-2032
- FIGURE 03. TOP IMPACTING FACTORS IN PHARMACEUTICAL SUSPENSION MARKET (2022 TO 2032)
- FIGURE 04. TOP INVESTMENT POCKETS IN PHARMACEUTICAL SUSPENSION MARKET (2023-2032)
- FIGURE 05. HIGH BARGAINING POWER OF SUPPLIERS
- FIGURE 06. MODERATE THREAT OF NEW ENTRANTS
- FIGURE 07. HIGH THREAT OF SUBSTITUTES
- FIGURE 08. MODERATE INTENSITY OF RIVALRY
- FIGURE 09. MODERATE BARGAINING POWER OF BUYERS
- FIGURE 10. GLOBAL PHARMACEUTICAL SUSPENSION MARKET:DRIVERS, RESTRAINTS AND OPPORTUNITIES
- FIGURE 11. PHARMACEUTICAL SUSPENSION MARKET, BY TYPE, 2022 AND 2032(%)
- FIGURE 12. COMPARATIVE SHARE ANALYSIS OF PHARMACEUTICAL SUSPENSION MARKET FOR ORAL, BY COUNTRY 2022 AND 2032(%)
- FIGURE 13. COMPARATIVE SHARE ANALYSIS OF PHARMACEUTICAL SUSPENSION MARKET FOR PARENTERAL, BY COUNTRY 2022 AND 2032(%)
- FIGURE 14. COMPARATIVE SHARE ANALYSIS OF PHARMACEUTICAL SUSPENSION MARKET FOR OTHERS, BY COUNTRY 2022 AND 2032(%)
- FIGURE 15. PHARMACEUTICAL SUSPENSION MARKET, BY INDICATION, 2022 AND 2032(%)
- FIGURE 16. COMPARATIVE SHARE ANALYSIS OF PHARMACEUTICAL SUSPENSION MARKET FOR INFECTIOUS DISEASES, BY COUNTRY 2022 AND 2032(%)
- FIGURE 17. COMPARATIVE SHARE ANALYSIS OF PHARMACEUTICAL SUSPENSION MARKET FOR CANCER, BY COUNTRY 2022 AND 2032(%)
- FIGURE 18. COMPARATIVE SHARE ANALYSIS OF PHARMACEUTICAL SUSPENSION MARKET FOR GASTROINTESTINAL, BY COUNTRY 2022 AND 2032(%)
- FIGURE 19. COMPARATIVE SHARE ANALYSIS OF PHARMACEUTICAL SUSPENSION MARKET FOR NEUROLOGICAL, BY COUNTRY 2022 AND 2032(%)
- FIGURE 20. COMPARATIVE SHARE ANALYSIS OF PHARMACEUTICAL SUSPENSION MARKET FOR OTHERS, BY COUNTRY 2022 AND 2032(%)
- FIGURE 21. PHARMACEUTICAL SUSPENSION MARKET, BY END USER, 2022 AND 2032(%)
- FIGURE 22. COMPARATIVE SHARE ANALYSIS OF PHARMACEUTICAL SUSPENSION MARKET FOR HOSPITALS AND CLINICS, BY COUNTRY 2022 AND 2032(%)
- FIGURE 23. COMPARATIVE SHARE ANALYSIS OF PHARMACEUTICAL SUSPENSION MARKET FOR HOME CARE SETTINGS, BY COUNTRY 2022 AND 2032(%)
- FIGURE 24. COMPARATIVE SHARE ANALYSIS OF PHARMACEUTICAL SUSPENSION MARKET FOR OTHERS, BY COUNTRY 2022 AND 2032(%)
- FIGURE 25. PHARMACEUTICAL SUSPENSION MARKET, BY DISTRIBUTION CHANNEL, 2022 AND 2032(%)
- FIGURE 26. COMPARATIVE SHARE ANALYSIS OF PHARMACEUTICAL SUSPENSION MARKET FOR HOSPITAL PHARMACIES, BY COUNTRY 2022 AND 2032(%)
- FIGURE 27. COMPARATIVE SHARE ANALYSIS OF PHARMACEUTICAL SUSPENSION MARKET FOR DRUG STORE AND RETAIL PHARMACIES, BY COUNTRY 2022 AND 2032(%)
- FIGURE 28. COMPARATIVE SHARE ANALYSIS OF PHARMACEUTICAL SUSPENSION MARKET FOR ONLINE PROVIDERS, BY COUNTRY 2022 AND 2032(%)
- FIGURE 29. PHARMACEUTICAL SUSPENSION MARKET BY REGION, 2022 AND 2032(%)
- FIGURE 30. U.S. PHARMACEUTICAL SUSPENSION MARKET, 2022-2032 ($MILLION)
- FIGURE 31. CANADA PHARMACEUTICAL SUSPENSION MARKET, 2022-2032 ($MILLION)
- FIGURE 32. MEXICO PHARMACEUTICAL SUSPENSION MARKET, 2022-2032 ($MILLION)
- FIGURE 33. GERMANY PHARMACEUTICAL SUSPENSION MARKET, 2022-2032 ($MILLION)
- FIGURE 34. FRANCE PHARMACEUTICAL SUSPENSION MARKET, 2022-2032 ($MILLION)
- FIGURE 35. UK PHARMACEUTICAL SUSPENSION MARKET, 2022-2032 ($MILLION)
- FIGURE 36. ITALY PHARMACEUTICAL SUSPENSION MARKET, 2022-2032 ($MILLION)
- FIGURE 37. SPAIN PHARMACEUTICAL SUSPENSION MARKET, 2022-2032 ($MILLION)
- FIGURE 38. REST OF EUROPE PHARMACEUTICAL SUSPENSION MARKET, 2022-2032 ($MILLION)
- FIGURE 39. JAPAN PHARMACEUTICAL SUSPENSION MARKET, 2022-2032 ($MILLION)
- FIGURE 40. CHINA PHARMACEUTICAL SUSPENSION MARKET, 2022-2032 ($MILLION)
- FIGURE 41. INDIA PHARMACEUTICAL SUSPENSION MARKET, 2022-2032 ($MILLION)
- FIGURE 42. AUSTRALIA PHARMACEUTICAL SUSPENSION MARKET, 2022-2032 ($MILLION)
- FIGURE 43. SOUTH KOREA PHARMACEUTICAL SUSPENSION MARKET, 2022-2032 ($MILLION)
- FIGURE 44. REST OF ASIA-PACIFIC PHARMACEUTICAL SUSPENSION MARKET, 2022-2032 ($MILLION)
- FIGURE 45. BRAZIL PHARMACEUTICAL SUSPENSION MARKET, 2022-2032 ($MILLION)
- FIGURE 46. SAUDI ARABIA PHARMACEUTICAL SUSPENSION MARKET, 2022-2032 ($MILLION)
- FIGURE 47. SOUTH AFRICA PHARMACEUTICAL SUSPENSION MARKET, 2022-2032 ($MILLION)
- FIGURE 48. REST OF LAMEA PHARMACEUTICAL SUSPENSION MARKET, 2022-2032 ($MILLION)
- FIGURE 49. TOP WINNING STRATEGIES, BY YEAR (2020-2023)
- FIGURE 50. TOP WINNING STRATEGIES, BY DEVELOPMENT (2020-2023)
- FIGURE 51. TOP WINNING STRATEGIES, BY COMPANY (2020-2023)
- FIGURE 52. PRODUCT MAPPING OF TOP 10 PLAYERS
- FIGURE 53. COMPETITIVE DASHBOARD
- FIGURE 54. COMPETITIVE HEATMAP: PHARMACEUTICAL SUSPENSION MARKET
- FIGURE 55. TOP PLAYER POSITIONING, 2022
- FIGURE 56. PFIZER INC.: NET REVENUE, 2020-2022 ($MILLION)
- FIGURE 57. PFIZER INC.: REVENUE SHARE BY SEGMENT, 2022 (%)
- FIGURE 58. PFIZER INC.: REVENUE SHARE BY REGION, 2022 (%)
- FIGURE 59. MERCK & CO., INC.: NET REVENUE, 2020-2022 ($MILLION)
- FIGURE 60. MERCK & CO., INC.: REVENUE SHARE BY SEGMENT, 2022 (%)
- FIGURE 61. MERCK & CO., INC.: REVENUE SHARE BY REGION, 2022 (%)
- FIGURE 62. ASTRAZENECA PLC: NET SALES, 2020-2022 ($MILLION)
- FIGURE 63. ASTRAZENECA PLC: REVENUE SHARE BY REGION, 2022 (%)
- FIGURE 64. ELI LILLY AND COMPANY: NET REVENUE, 2020-2022 ($MILLION)
- FIGURE 65. ELI LILLY AND COMPANY: REVENUE SHARE BY REGION, 2022 (%)
- FIGURE 66. BAYER AG: NET SALES, 2020-2022 ($MILLION)
- FIGURE 67. BAYER AG: REVENUE SHARE BY SEGMENT, 2022 (%)
- FIGURE 68. BAYER AG: REVENUE SHARE BY REGION, 2022 (%)
- FIGURE 69. SANOFI: NET REVENUE, 2020-2022 ($MILLION)
- FIGURE 70. SANOFI: REVENUE SHARE BY SEGMENT, 2022 (%)
- FIGURE 71. SANOFI: REVENUE SHARE BY REGION, 2022 (%)
- FIGURE 72. LUPIN: NET SALES, 2020-2022 ($MILLION)
- FIGURE 73. LUPIN: REVENUE SHARE BY REGION, 2022 (%)
- FIGURE 74. GLENMARK PHARMACEUTICALS LIMITED: NET REVENUE, 2019-2021 ($MILLION)
- FIGURE 75. GLENMARK PHARMACEUTICALS LIMITED: REVENUE SHARE BY REGION, 2021 (%)
- FIGURE 76. NOVARTIS AG: NET SALES, 2020-2022 ($MILLION)
- FIGURE 77. NOVARTIS AG: REVENUE SHARE BY SEGMENT, 2022 (%)
- FIGURE 78. NOVARTIS AG: REVENUE SHARE BY REGION, 2022 (%)
- FIGURE 79. TEVA PHARMACEUTICAL INDUSTRIES LIMITED: NET REVENUE, 2020-2022 ($MILLION)
- FIGURE 80. TEVA PHARMACEUTICAL INDUSTRIES LIMITED: REVENUE SHARE BY SEGMENT, 2022 (%)

