
PUBLISHER: Allied Market Research | PRODUCT CODE: 1447188

PUBLISHER: Allied Market Research | PRODUCT CODE: 1447188
Beverage Dispenser Market By Type (Cold beverage dispenser, Hot beverage dispenser), By Material (Plastic, Stainless Steel, Others), By End Use (Commercial, Residential): Global Opportunity Analysis and Industry Forecast, 2023-2032
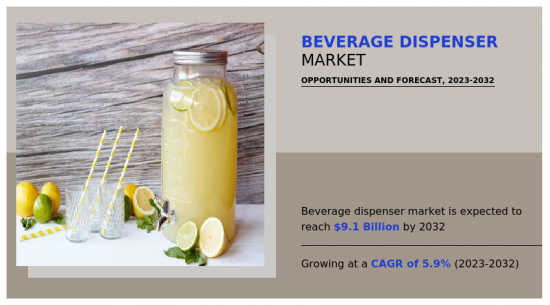
The global beverage dispenser market was valued at $5,212.8 million in 2022 and is projected to reach $9,097.7 million by 2032, registering a CAGR of 5.9% from 2023 to 2032.
A beverage dispenser is a handy and adaptable gadget that is used to effectively dispense a variety of liquids, from hot to cold and refreshing. These dispensers, which are commonly used in commercial settings such as restaurants, cafes, and event sites, expedite the serving process by guaranteeing consistent portion control and lowering the possibility of spills. Some models are equipped with easily controllable functions, such as temperature and portion size adjustments, to accommodate varying beverage preferences. They are frequently located in self-service areas and improve the customer experience by offering quick and easy access to a selection of beverages. Modern designs are crucial in high-traffic hospitality spaces since they frequently place a premium on ease of cleaning and maintenance.
The beverage dispenser market is analyzed on the basis of type, material, and end use and region. On the basis of type, the market is bifurcated into cold beverage dispenser and hot beverage dispenser. On the basis of material, the beverage dispenser market is divided into plastic, stainless steel, and others. On the basis of end use, the market is bifurcated into commercial and residential. On the basis of region, it is studied across North America, Europe, Asia-Pacific Middle East and Africa, and Latin America.
The market for beverage dispensers has expanded significantly in recent years due to change in customer tastes, technology improvements, and a rise in desire for convenience when consuming beverages. Beverage dispensers are made to hold and serve a variety of liquids, such as water, alcoholic beverages, and juices as well as soft drinks. These dispensers are extensively utilized in homes and businesses, including hotels, pubs, and restaurants.
The growth in trend of self-service choices in the food & beverage industry is one of the major factors that drives the growth of the beverage dispenser market. Self-service beverage dispensers improve the whole eating experience by giving customers the freedom to select and pour the beverages they want. In fast-food establishments, where customers prioritize fast and convenient service, this trend is especially noticeable.
Beverage dispensers with modern features have gained popularity in the market, along with self-service options. Touch screens, smartphone connectivity, and automated dispensing systems are a few of the features that make smart dispensers more popular. Operators can now track and manage inventory more effectively due to these advances, which also enhance customer experience.
The increased consciousness of environmental sustainability also has an impact on the beverage dispenser market. Manufacturers have focused on creating eco-friendly and energy-efficient dispensers to meet the growth in demand from consumers for sustainable products. Energy-saving technologies and the use of materials with less of an impact on the environment are examples of this.
In addition, the COVID-19 pandemic has significantly changed the dynamics of the business. Touchless and contactless dispensing systems have become more popular because of the increased focus on safety and hygiene. In response to this change in consumer preferences, manufacturers have improved sanitation by including antibacterial characteristics and providing hands-free dispensers.
On the basis of region, emerging economies are where the beverage dispenser market has expanded at a rapid pace due to the rise in disposable incomes and change in lifestyles that have fueled consumer desire for convenient products. Nonetheless, well-established markets in North America and Europe continue to play a significant role in the overall revenue of the market, due in part to innovation and the replacement of outdated dispensing methods.
The key players operating in the beverage dispenser market have adopted partnership, acquisition, investment, and business expansion as their key strategies to expand their market share, increase profitability, and remain competitive in the market. The major players operating in the Beverage dispenser market are Cornelius, Inc., Manitowoc Beverage Systems, Inc., Lancer Corporation, Follett Corporation, BUNN-O-Matic Corporation, Grindmaster-Cecilware Corporation, IMI Cornelius, Inc., Multiplex Beverage, Elmeco, Zojirushi Corporation, Hoshizaki Electric Co., Ltd., and Hamilton Beach Brands, Inc.
Key Benefits For Stakeholders
- This report provides a quantitative analysis of the market segments, current trends, estimations, and dynamics of the beverage dispenser market analysis from 2022 to 2032 to identify the prevailing beverage dispenser market opportunities.
- The market research is offered along with information related to key drivers, restraints, and opportunities.
- Porter's five forces analysis highlights the potency of buyers and suppliers to enable stakeholders make profit-oriented business decisions and strengthen their supplier-buyer network.
- In-depth analysis of the beverage dispenser market segmentation assists to determine the prevailing market opportunities.
- Major countries in each region are mapped according to their revenue contribution to the global market.
- Market player positioning facilitates benchmarking and provides a clear understanding of the present position of the market players.
- The report includes the analysis of the regional as well as global beverage dispenser market trends, key players, market segments, application areas, and market growth strategies.
Additional benefits you will get with this purchase are:
- Quarterly Update and* (only available with a corporate license, on listed price)
- 5 additional Company Profile of client Choice pre- or Post-purchase, as a free update.
- Free Upcoming Version on the Purchase of Five and Enterprise User License.
- 16 analyst hours of support* (post-purchase, if you find additional data requirements upon review of the report, you may receive support amounting to 16 analyst hours to solve questions, and post-sale queries)
- 15% Free Customization* (in case the scope or segment of the report does not match your requirements, 15% is equivalent to 3 working days of free work, applicable once)
- Free data Pack on the Five and Enterprise User License. (Excel version of the report)
- Free Updated report if the report is 6-12 months old or older.
- 24-hour priority response*
- Free Industry updates and white papers.
Possible Customization with this report (with additional cost and timeline, please talk to the sales executive to know more)
- Additional company profiles with specific to client's interest
- Additional country or region analysis- market size and forecast
- Historic market data
Key Market Segments
By Material
- Plastic
- Stainless Steel
- Others
By Type
- Hot beverage dispenser
- Cold beverage dispenser
By End Use
- Commercial
- Residential
By Region
- North America
- U.S.
- Canada
- Mexico
- Europe
- France
- Italy
- Germany
- UK
- Spain
- Rest of Europe
- Asia-Pacific
- China
- India
- Japan
- Australia
- South Korea
- Rest of Asia-Pacific
- LAMEA
- Brazil
- South Africa
- United Arab Emirates
- Saudi Arabia
- Rest of LAMEA
Key Market Players:
- Berg Liquor Controls
- Bunn-O-Matic Corporation
- Cal-Mil
- Cambro Manufacturing Company, Inc.
- Cornelius, Inc.
- Crathco - Grindmaster
- Elkay Manufacturing Company
- follett corporation
- Gold Medal Products Co.
- Grindmaster-Cecilware
TABLE OF CONTENTS
CHAPTER 1: INTRODUCTION
- 1.1. Report description
- 1.2. Key market segments
- 1.3. Key benefits to the stakeholders
- 1.4. Research methodology
- 1.4.1. Primary research
- 1.4.2. Secondary research
- 1.4.3. Analyst tools and models
CHAPTER 2: EXECUTIVE SUMMARY
- 2.1. CXO Perspective
CHAPTER 3: MARKET OVERVIEW
- 3.1. Market definition and scope
- 3.2. Key findings
- 3.2.1. Top impacting factors
- 3.2.2. Top investment pockets
- 3.3. Porter's five forces analysis
- 3.4. Market dynamics
- 3.4.1. Drivers
- 3.4.2. Restraints
- 3.4.3. Opportunities
CHAPTER 4: BEVERAGE DISPENSER MARKET, BY TYPE
- 4.1. Overview
- 4.1.1. Market size and forecast
- 4.2. Cold beverage dispenser
- 4.2.1. Key market trends, growth factors and opportunities
- 4.2.2. Market size and forecast, by region
- 4.2.3. Market share analysis by country
- 4.3. Hot beverage dispenser
- 4.3.1. Key market trends, growth factors and opportunities
- 4.3.2. Market size and forecast, by region
- 4.3.3. Market share analysis by country
CHAPTER 5: BEVERAGE DISPENSER MARKET, BY MATERIAL
- 5.1. Overview
- 5.1.1. Market size and forecast
- 5.2. Plastic
- 5.2.1. Key market trends, growth factors and opportunities
- 5.2.2. Market size and forecast, by region
- 5.2.3. Market share analysis by country
- 5.3. Stainless Steel
- 5.3.1. Key market trends, growth factors and opportunities
- 5.3.2. Market size and forecast, by region
- 5.3.3. Market share analysis by country
- 5.4. Others
- 5.4.1. Key market trends, growth factors and opportunities
- 5.4.2. Market size and forecast, by region
- 5.4.3. Market share analysis by country
CHAPTER 6: BEVERAGE DISPENSER MARKET, BY END USE
- 6.1. Overview
- 6.1.1. Market size and forecast
- 6.2. Commercial
- 6.2.1. Key market trends, growth factors and opportunities
- 6.2.2. Market size and forecast, by region
- 6.2.3. Market share analysis by country
- 6.3. Residential
- 6.3.1. Key market trends, growth factors and opportunities
- 6.3.2. Market size and forecast, by region
- 6.3.3. Market share analysis by country
CHAPTER 7: BEVERAGE DISPENSER MARKET, BY REGION
- 7.1. Overview
- 7.1.1. Market size and forecast By Region
- 7.2. North America
- 7.2.1. Key market trends, growth factors and opportunities
- 7.2.2. Market size and forecast, by Type
- 7.2.3. Market size and forecast, by Material
- 7.2.4. Market size and forecast, by End Use
- 7.2.5. Market size and forecast, by country
- 7.2.5.1. U.S.
- 7.2.5.1.1. Market size and forecast, by Type
- 7.2.5.1.2. Market size and forecast, by Material
- 7.2.5.1.3. Market size and forecast, by End Use
- 7.2.5.2. Canada
- 7.2.5.2.1. Market size and forecast, by Type
- 7.2.5.2.2. Market size and forecast, by Material
- 7.2.5.2.3. Market size and forecast, by End Use
- 7.2.5.3. Mexico
- 7.2.5.3.1. Market size and forecast, by Type
- 7.2.5.3.2. Market size and forecast, by Material
- 7.2.5.3.3. Market size and forecast, by End Use
- 7.3. Europe
- 7.3.1. Key market trends, growth factors and opportunities
- 7.3.2. Market size and forecast, by Type
- 7.3.3. Market size and forecast, by Material
- 7.3.4. Market size and forecast, by End Use
- 7.3.5. Market size and forecast, by country
- 7.3.5.1. France
- 7.3.5.1.1. Market size and forecast, by Type
- 7.3.5.1.2. Market size and forecast, by Material
- 7.3.5.1.3. Market size and forecast, by End Use
- 7.3.5.2. Italy
- 7.3.5.2.1. Market size and forecast, by Type
- 7.3.5.2.2. Market size and forecast, by Material
- 7.3.5.2.3. Market size and forecast, by End Use
- 7.3.5.3. Germany
- 7.3.5.3.1. Market size and forecast, by Type
- 7.3.5.3.2. Market size and forecast, by Material
- 7.3.5.3.3. Market size and forecast, by End Use
- 7.3.5.4. UK
- 7.3.5.4.1. Market size and forecast, by Type
- 7.3.5.4.2. Market size and forecast, by Material
- 7.3.5.4.3. Market size and forecast, by End Use
- 7.3.5.5. Spain
- 7.3.5.5.1. Market size and forecast, by Type
- 7.3.5.5.2. Market size and forecast, by Material
- 7.3.5.5.3. Market size and forecast, by End Use
- 7.3.5.6. Rest of Europe
- 7.3.5.6.1. Market size and forecast, by Type
- 7.3.5.6.2. Market size and forecast, by Material
- 7.3.5.6.3. Market size and forecast, by End Use
- 7.4. Asia-Pacific
- 7.4.1. Key market trends, growth factors and opportunities
- 7.4.2. Market size and forecast, by Type
- 7.4.3. Market size and forecast, by Material
- 7.4.4. Market size and forecast, by End Use
- 7.4.5. Market size and forecast, by country
- 7.4.5.1. China
- 7.4.5.1.1. Market size and forecast, by Type
- 7.4.5.1.2. Market size and forecast, by Material
- 7.4.5.1.3. Market size and forecast, by End Use
- 7.4.5.2. India
- 7.4.5.2.1. Market size and forecast, by Type
- 7.4.5.2.2. Market size and forecast, by Material
- 7.4.5.2.3. Market size and forecast, by End Use
- 7.4.5.3. Japan
- 7.4.5.3.1. Market size and forecast, by Type
- 7.4.5.3.2. Market size and forecast, by Material
- 7.4.5.3.3. Market size and forecast, by End Use
- 7.4.5.4. Australia
- 7.4.5.4.1. Market size and forecast, by Type
- 7.4.5.4.2. Market size and forecast, by Material
- 7.4.5.4.3. Market size and forecast, by End Use
- 7.4.5.5. South Korea
- 7.4.5.5.1. Market size and forecast, by Type
- 7.4.5.5.2. Market size and forecast, by Material
- 7.4.5.5.3. Market size and forecast, by End Use
- 7.4.5.6. Rest of Asia-Pacific
- 7.4.5.6.1. Market size and forecast, by Type
- 7.4.5.6.2. Market size and forecast, by Material
- 7.4.5.6.3. Market size and forecast, by End Use
- 7.5. LAMEA
- 7.5.1. Key market trends, growth factors and opportunities
- 7.5.2. Market size and forecast, by Type
- 7.5.3. Market size and forecast, by Material
- 7.5.4. Market size and forecast, by End Use
- 7.5.5. Market size and forecast, by country
- 7.5.5.1. Brazil
- 7.5.5.1.1. Market size and forecast, by Type
- 7.5.5.1.2. Market size and forecast, by Material
- 7.5.5.1.3. Market size and forecast, by End Use
- 7.5.5.2. South Africa
- 7.5.5.2.1. Market size and forecast, by Type
- 7.5.5.2.2. Market size and forecast, by Material
- 7.5.5.2.3. Market size and forecast, by End Use
- 7.5.5.3. United Arab Emirates
- 7.5.5.3.1. Market size and forecast, by Type
- 7.5.5.3.2. Market size and forecast, by Material
- 7.5.5.3.3. Market size and forecast, by End Use
- 7.5.5.4. Saudi Arabia
- 7.5.5.4.1. Market size and forecast, by Type
- 7.5.5.4.2. Market size and forecast, by Material
- 7.5.5.4.3. Market size and forecast, by End Use
- 7.5.5.5. Rest of LAMEA
- 7.5.5.5.1. Market size and forecast, by Type
- 7.5.5.5.2. Market size and forecast, by Material
- 7.5.5.5.3. Market size and forecast, by End Use
CHAPTER 8: COMPETITIVE LANDSCAPE
- 8.1. Introduction
- 8.2. Top winning strategies
- 8.3. Product mapping of top 10 player
- 8.4. Competitive dashboard
- 8.5. Competitive heatmap
- 8.6. Top player positioning, 2022
CHAPTER 9: COMPANY PROFILES
- 9.1. Berg Liquor Controls
- 9.1.1. Company overview
- 9.1.2. Key executives
- 9.1.3. Company snapshot
- 9.1.4. Operating business segments
- 9.1.5. Product portfolio
- 9.1.6. Business performance
- 9.1.7. Key strategic moves and developments
- 9.2. Bunn-O-Matic Corporation
- 9.2.1. Company overview
- 9.2.2. Key executives
- 9.2.3. Company snapshot
- 9.2.4. Operating business segments
- 9.2.5. Product portfolio
- 9.2.6. Business performance
- 9.2.7. Key strategic moves and developments
- 9.3. Cal-Mil
- 9.3.1. Company overview
- 9.3.2. Key executives
- 9.3.3. Company snapshot
- 9.3.4. Operating business segments
- 9.3.5. Product portfolio
- 9.3.6. Business performance
- 9.3.7. Key strategic moves and developments
- 9.4. Cambro Manufacturing Company, Inc.
- 9.4.1. Company overview
- 9.4.2. Key executives
- 9.4.3. Company snapshot
- 9.4.4. Operating business segments
- 9.4.5. Product portfolio
- 9.4.6. Business performance
- 9.4.7. Key strategic moves and developments
- 9.5. Cornelius, Inc.
- 9.5.1. Company overview
- 9.5.2. Key executives
- 9.5.3. Company snapshot
- 9.5.4. Operating business segments
- 9.5.5. Product portfolio
- 9.5.6. Business performance
- 9.5.7. Key strategic moves and developments
- 9.6. Crathco - Grindmaster
- 9.6.1. Company overview
- 9.6.2. Key executives
- 9.6.3. Company snapshot
- 9.6.4. Operating business segments
- 9.6.5. Product portfolio
- 9.6.6. Business performance
- 9.6.7. Key strategic moves and developments
- 9.7. Elkay Manufacturing Company
- 9.7.1. Company overview
- 9.7.2. Key executives
- 9.7.3. Company snapshot
- 9.7.4. Operating business segments
- 9.7.5. Product portfolio
- 9.7.6. Business performance
- 9.7.7. Key strategic moves and developments
- 9.8. follett corporation
- 9.8.1. Company overview
- 9.8.2. Key executives
- 9.8.3. Company snapshot
- 9.8.4. Operating business segments
- 9.8.5. Product portfolio
- 9.8.6. Business performance
- 9.8.7. Key strategic moves and developments
- 9.9. Gold Medal Products Co.
- 9.9.1. Company overview
- 9.9.2. Key executives
- 9.9.3. Company snapshot
- 9.9.4. Operating business segments
- 9.9.5. Product portfolio
- 9.9.6. Business performance
- 9.9.7. Key strategic moves and developments
- 9.10. Grindmaster-Cecilware
- 9.10.1. Company overview
- 9.10.2. Key executives
- 9.10.3. Company snapshot
- 9.10.4. Operating business segments
- 9.10.5. Product portfolio
- 9.10.6. Business performance
- 9.10.7. Key strategic moves and developments
LIST OF TABLES
- TABLE 01. GLOBAL BEVERAGE DISPENSER MARKET, BY TYPE, 2022-2032 ($MILLION)
- TABLE 02. BEVERAGE DISPENSER MARKET FOR COLD BEVERAGE DISPENSER, BY REGION, 2022-2032 ($MILLION)
- TABLE 03. BEVERAGE DISPENSER MARKET FOR HOT BEVERAGE DISPENSER, BY REGION, 2022-2032 ($MILLION)
- TABLE 04. GLOBAL BEVERAGE DISPENSER MARKET, BY MATERIAL, 2022-2032 ($MILLION)
- TABLE 05. BEVERAGE DISPENSER MARKET FOR PLASTIC, BY REGION, 2022-2032 ($MILLION)
- TABLE 06. BEVERAGE DISPENSER MARKET FOR STAINLESS STEEL, BY REGION, 2022-2032 ($MILLION)
- TABLE 07. BEVERAGE DISPENSER MARKET FOR OTHERS, BY REGION, 2022-2032 ($MILLION)
- TABLE 08. GLOBAL BEVERAGE DISPENSER MARKET, BY END USE, 2022-2032 ($MILLION)
- TABLE 09. BEVERAGE DISPENSER MARKET FOR COMMERCIAL, BY REGION, 2022-2032 ($MILLION)
- TABLE 10. BEVERAGE DISPENSER MARKET FOR RESIDENTIAL, BY REGION, 2022-2032 ($MILLION)
- TABLE 11. BEVERAGE DISPENSER MARKET, BY REGION, 2022-2032 ($MILLION)
- TABLE 12. NORTH AMERICA BEVERAGE DISPENSER MARKET, BY TYPE, 2022-2032 ($MILLION)
- TABLE 13. NORTH AMERICA BEVERAGE DISPENSER MARKET, BY MATERIAL, 2022-2032 ($MILLION)
- TABLE 14. NORTH AMERICA BEVERAGE DISPENSER MARKET, BY END USE, 2022-2032 ($MILLION)
- TABLE 15. NORTH AMERICA BEVERAGE DISPENSER MARKET, BY COUNTRY, 2022-2032 ($MILLION)
- TABLE 16. U.S. BEVERAGE DISPENSER MARKET, BY TYPE, 2022-2032 ($MILLION)
- TABLE 17. U.S. BEVERAGE DISPENSER MARKET, BY MATERIAL, 2022-2032 ($MILLION)
- TABLE 18. U.S. BEVERAGE DISPENSER MARKET, BY END USE, 2022-2032 ($MILLION)
- TABLE 19. CANADA BEVERAGE DISPENSER MARKET, BY TYPE, 2022-2032 ($MILLION)
- TABLE 20. CANADA BEVERAGE DISPENSER MARKET, BY MATERIAL, 2022-2032 ($MILLION)
- TABLE 21. CANADA BEVERAGE DISPENSER MARKET, BY END USE, 2022-2032 ($MILLION)
- TABLE 22. MEXICO BEVERAGE DISPENSER MARKET, BY TYPE, 2022-2032 ($MILLION)
- TABLE 23. MEXICO BEVERAGE DISPENSER MARKET, BY MATERIAL, 2022-2032 ($MILLION)
- TABLE 24. MEXICO BEVERAGE DISPENSER MARKET, BY END USE, 2022-2032 ($MILLION)
- TABLE 25. EUROPE BEVERAGE DISPENSER MARKET, BY TYPE, 2022-2032 ($MILLION)
- TABLE 26. EUROPE BEVERAGE DISPENSER MARKET, BY MATERIAL, 2022-2032 ($MILLION)
- TABLE 27. EUROPE BEVERAGE DISPENSER MARKET, BY END USE, 2022-2032 ($MILLION)
- TABLE 28. EUROPE BEVERAGE DISPENSER MARKET, BY COUNTRY, 2022-2032 ($MILLION)
- TABLE 29. FRANCE BEVERAGE DISPENSER MARKET, BY TYPE, 2022-2032 ($MILLION)
- TABLE 30. FRANCE BEVERAGE DISPENSER MARKET, BY MATERIAL, 2022-2032 ($MILLION)
- TABLE 31. FRANCE BEVERAGE DISPENSER MARKET, BY END USE, 2022-2032 ($MILLION)
- TABLE 32. ITALY BEVERAGE DISPENSER MARKET, BY TYPE, 2022-2032 ($MILLION)
- TABLE 33. ITALY BEVERAGE DISPENSER MARKET, BY MATERIAL, 2022-2032 ($MILLION)
- TABLE 34. ITALY BEVERAGE DISPENSER MARKET, BY END USE, 2022-2032 ($MILLION)
- TABLE 35. GERMANY BEVERAGE DISPENSER MARKET, BY TYPE, 2022-2032 ($MILLION)
- TABLE 36. GERMANY BEVERAGE DISPENSER MARKET, BY MATERIAL, 2022-2032 ($MILLION)
- TABLE 37. GERMANY BEVERAGE DISPENSER MARKET, BY END USE, 2022-2032 ($MILLION)
- TABLE 38. UK BEVERAGE DISPENSER MARKET, BY TYPE, 2022-2032 ($MILLION)
- TABLE 39. UK BEVERAGE DISPENSER MARKET, BY MATERIAL, 2022-2032 ($MILLION)
- TABLE 40. UK BEVERAGE DISPENSER MARKET, BY END USE, 2022-2032 ($MILLION)
- TABLE 41. SPAIN BEVERAGE DISPENSER MARKET, BY TYPE, 2022-2032 ($MILLION)
- TABLE 42. SPAIN BEVERAGE DISPENSER MARKET, BY MATERIAL, 2022-2032 ($MILLION)
- TABLE 43. SPAIN BEVERAGE DISPENSER MARKET, BY END USE, 2022-2032 ($MILLION)
- TABLE 44. REST OF EUROPE BEVERAGE DISPENSER MARKET, BY TYPE, 2022-2032 ($MILLION)
- TABLE 45. REST OF EUROPE BEVERAGE DISPENSER MARKET, BY MATERIAL, 2022-2032 ($MILLION)
- TABLE 46. REST OF EUROPE BEVERAGE DISPENSER MARKET, BY END USE, 2022-2032 ($MILLION)
- TABLE 47. ASIA-PACIFIC BEVERAGE DISPENSER MARKET, BY TYPE, 2022-2032 ($MILLION)
- TABLE 48. ASIA-PACIFIC BEVERAGE DISPENSER MARKET, BY MATERIAL, 2022-2032 ($MILLION)
- TABLE 49. ASIA-PACIFIC BEVERAGE DISPENSER MARKET, BY END USE, 2022-2032 ($MILLION)
- TABLE 50. ASIA-PACIFIC BEVERAGE DISPENSER MARKET, BY COUNTRY, 2022-2032 ($MILLION)
- TABLE 51. CHINA BEVERAGE DISPENSER MARKET, BY TYPE, 2022-2032 ($MILLION)
- TABLE 52. CHINA BEVERAGE DISPENSER MARKET, BY MATERIAL, 2022-2032 ($MILLION)
- TABLE 53. CHINA BEVERAGE DISPENSER MARKET, BY END USE, 2022-2032 ($MILLION)
- TABLE 54. INDIA BEVERAGE DISPENSER MARKET, BY TYPE, 2022-2032 ($MILLION)
- TABLE 55. INDIA BEVERAGE DISPENSER MARKET, BY MATERIAL, 2022-2032 ($MILLION)
- TABLE 56. INDIA BEVERAGE DISPENSER MARKET, BY END USE, 2022-2032 ($MILLION)
- TABLE 57. JAPAN BEVERAGE DISPENSER MARKET, BY TYPE, 2022-2032 ($MILLION)
- TABLE 58. JAPAN BEVERAGE DISPENSER MARKET, BY MATERIAL, 2022-2032 ($MILLION)
- TABLE 59. JAPAN BEVERAGE DISPENSER MARKET, BY END USE, 2022-2032 ($MILLION)
- TABLE 60. AUSTRALIA BEVERAGE DISPENSER MARKET, BY TYPE, 2022-2032 ($MILLION)
- TABLE 61. AUSTRALIA BEVERAGE DISPENSER MARKET, BY MATERIAL, 2022-2032 ($MILLION)
- TABLE 62. AUSTRALIA BEVERAGE DISPENSER MARKET, BY END USE, 2022-2032 ($MILLION)
- TABLE 63. SOUTH KOREA BEVERAGE DISPENSER MARKET, BY TYPE, 2022-2032 ($MILLION)
- TABLE 64. SOUTH KOREA BEVERAGE DISPENSER MARKET, BY MATERIAL, 2022-2032 ($MILLION)
- TABLE 65. SOUTH KOREA BEVERAGE DISPENSER MARKET, BY END USE, 2022-2032 ($MILLION)
- TABLE 66. REST OF ASIA-PACIFIC BEVERAGE DISPENSER MARKET, BY TYPE, 2022-2032 ($MILLION)
- TABLE 67. REST OF ASIA-PACIFIC BEVERAGE DISPENSER MARKET, BY MATERIAL, 2022-2032 ($MILLION)
- TABLE 68. REST OF ASIA-PACIFIC BEVERAGE DISPENSER MARKET, BY END USE, 2022-2032 ($MILLION)
- TABLE 69. LAMEA BEVERAGE DISPENSER MARKET, BY TYPE, 2022-2032 ($MILLION)
- TABLE 70. LAMEA BEVERAGE DISPENSER MARKET, BY MATERIAL, 2022-2032 ($MILLION)
- TABLE 71. LAMEA BEVERAGE DISPENSER MARKET, BY END USE, 2022-2032 ($MILLION)
- TABLE 72. LAMEA BEVERAGE DISPENSER MARKET, BY COUNTRY, 2022-2032 ($MILLION)
- TABLE 73. BRAZIL BEVERAGE DISPENSER MARKET, BY TYPE, 2022-2032 ($MILLION)
- TABLE 74. BRAZIL BEVERAGE DISPENSER MARKET, BY MATERIAL, 2022-2032 ($MILLION)
- TABLE 75. BRAZIL BEVERAGE DISPENSER MARKET, BY END USE, 2022-2032 ($MILLION)
- TABLE 76. SOUTH AFRICA BEVERAGE DISPENSER MARKET, BY TYPE, 2022-2032 ($MILLION)
- TABLE 77. SOUTH AFRICA BEVERAGE DISPENSER MARKET, BY MATERIAL, 2022-2032 ($MILLION)
- TABLE 78. SOUTH AFRICA BEVERAGE DISPENSER MARKET, BY END USE, 2022-2032 ($MILLION)
- TABLE 79. UNITED ARAB EMIRATES BEVERAGE DISPENSER MARKET, BY TYPE, 2022-2032 ($MILLION)
- TABLE 80. UNITED ARAB EMIRATES BEVERAGE DISPENSER MARKET, BY MATERIAL, 2022-2032 ($MILLION)
- TABLE 81. UNITED ARAB EMIRATES BEVERAGE DISPENSER MARKET, BY END USE, 2022-2032 ($MILLION)
- TABLE 82. SAUDI ARABIA BEVERAGE DISPENSER MARKET, BY TYPE, 2022-2032 ($MILLION)
- TABLE 83. SAUDI ARABIA BEVERAGE DISPENSER MARKET, BY MATERIAL, 2022-2032 ($MILLION)
- TABLE 84. SAUDI ARABIA BEVERAGE DISPENSER MARKET, BY END USE, 2022-2032 ($MILLION)
- TABLE 85. REST OF LAMEA BEVERAGE DISPENSER MARKET, BY TYPE, 2022-2032 ($MILLION)
- TABLE 86. REST OF LAMEA BEVERAGE DISPENSER MARKET, BY MATERIAL, 2022-2032 ($MILLION)
- TABLE 87. REST OF LAMEA BEVERAGE DISPENSER MARKET, BY END USE, 2022-2032 ($MILLION)
- TABLE 88. BERG LIQUOR CONTROLS: KEY EXECUTIVES
- TABLE 89. BERG LIQUOR CONTROLS: COMPANY SNAPSHOT
- TABLE 90. BERG LIQUOR CONTROLS: PRODUCT SEGMENTS
- TABLE 91. BERG LIQUOR CONTROLS: SERVICE SEGMENTS
- TABLE 92. BERG LIQUOR CONTROLS: PRODUCT PORTFOLIO
- TABLE 93. BERG LIQUOR CONTROLS: KEY STRATERGIES
- TABLE 94. BUNN-O-MATIC CORPORATION: KEY EXECUTIVES
- TABLE 95. BUNN-O-MATIC CORPORATION: COMPANY SNAPSHOT
- TABLE 96. BUNN-O-MATIC CORPORATION: PRODUCT SEGMENTS
- TABLE 97. BUNN-O-MATIC CORPORATION: SERVICE SEGMENTS
- TABLE 98. BUNN-O-MATIC CORPORATION: PRODUCT PORTFOLIO
- TABLE 99. BUNN-O-MATIC CORPORATION: KEY STRATERGIES
- TABLE 100. CAL-MIL: KEY EXECUTIVES
- TABLE 101. CAL-MIL: COMPANY SNAPSHOT
- TABLE 102. CAL-MIL: PRODUCT SEGMENTS
- TABLE 103. CAL-MIL: SERVICE SEGMENTS
- TABLE 104. CAL-MIL: PRODUCT PORTFOLIO
- TABLE 105. CAL-MIL: KEY STRATERGIES
- TABLE 106. CAMBRO MANUFACTURING COMPANY, INC.: KEY EXECUTIVES
- TABLE 107. CAMBRO MANUFACTURING COMPANY, INC.: COMPANY SNAPSHOT
- TABLE 108. CAMBRO MANUFACTURING COMPANY, INC.: PRODUCT SEGMENTS
- TABLE 109. CAMBRO MANUFACTURING COMPANY, INC.: SERVICE SEGMENTS
- TABLE 110. CAMBRO MANUFACTURING COMPANY, INC.: PRODUCT PORTFOLIO
- TABLE 111. CAMBRO MANUFACTURING COMPANY, INC.: KEY STRATERGIES
- TABLE 112. CORNELIUS, INC.: KEY EXECUTIVES
- TABLE 113. CORNELIUS, INC.: COMPANY SNAPSHOT
- TABLE 114. CORNELIUS, INC.: PRODUCT SEGMENTS
- TABLE 115. CORNELIUS, INC.: SERVICE SEGMENTS
- TABLE 116. CORNELIUS, INC.: PRODUCT PORTFOLIO
- TABLE 117. CORNELIUS, INC.: KEY STRATERGIES
- TABLE 118. CRATHCO - GRINDMASTER: KEY EXECUTIVES
- TABLE 119. CRATHCO - GRINDMASTER: COMPANY SNAPSHOT
- TABLE 120. CRATHCO - GRINDMASTER: PRODUCT SEGMENTS
- TABLE 121. CRATHCO - GRINDMASTER: SERVICE SEGMENTS
- TABLE 122. CRATHCO - GRINDMASTER: PRODUCT PORTFOLIO
- TABLE 123. CRATHCO - GRINDMASTER: KEY STRATERGIES
- TABLE 124. ELKAY MANUFACTURING COMPANY: KEY EXECUTIVES
- TABLE 125. ELKAY MANUFACTURING COMPANY: COMPANY SNAPSHOT
- TABLE 126. ELKAY MANUFACTURING COMPANY: PRODUCT SEGMENTS
- TABLE 127. ELKAY MANUFACTURING COMPANY: SERVICE SEGMENTS
- TABLE 128. ELKAY MANUFACTURING COMPANY: PRODUCT PORTFOLIO
- TABLE 129. ELKAY MANUFACTURING COMPANY: KEY STRATERGIES
- TABLE 130. FOLLETT CORPORATION: KEY EXECUTIVES
- TABLE 131. FOLLETT CORPORATION: COMPANY SNAPSHOT
- TABLE 132. FOLLETT CORPORATION: PRODUCT SEGMENTS
- TABLE 133. FOLLETT CORPORATION: SERVICE SEGMENTS
- TABLE 134. FOLLETT CORPORATION: PRODUCT PORTFOLIO
- TABLE 135. FOLLETT CORPORATION: KEY STRATERGIES
- TABLE 136. GOLD MEDAL PRODUCTS CO.: KEY EXECUTIVES
- TABLE 137. GOLD MEDAL PRODUCTS CO.: COMPANY SNAPSHOT
- TABLE 138. GOLD MEDAL PRODUCTS CO.: PRODUCT SEGMENTS
- TABLE 139. GOLD MEDAL PRODUCTS CO.: SERVICE SEGMENTS
- TABLE 140. GOLD MEDAL PRODUCTS CO.: PRODUCT PORTFOLIO
- TABLE 141. GOLD MEDAL PRODUCTS CO.: KEY STRATERGIES
- TABLE 142. GRINDMASTER-CECILWARE: KEY EXECUTIVES
- TABLE 143. GRINDMASTER-CECILWARE: COMPANY SNAPSHOT
- TABLE 144. GRINDMASTER-CECILWARE: PRODUCT SEGMENTS
- TABLE 145. GRINDMASTER-CECILWARE: SERVICE SEGMENTS
- TABLE 146. GRINDMASTER-CECILWARE: PRODUCT PORTFOLIO
- TABLE 147. GRINDMASTER-CECILWARE: KEY STRATERGIES
LIST OF FIGURES
- FIGURE 01. BEVERAGE DISPENSER MARKET, 2022-2032
- FIGURE 02. SEGMENTATION OF BEVERAGE DISPENSER MARKET,2022-2032
- FIGURE 03. TOP IMPACTING FACTORS IN BEVERAGE DISPENSER MARKET
- FIGURE 04. TOP INVESTMENT POCKETS IN BEVERAGE DISPENSER MARKET (2023-2032)
- FIGURE 05. BARGAINING POWER OF SUPPLIERS
- FIGURE 06. BARGAINING POWER OF BUYERS
- FIGURE 07. THREAT OF SUBSTITUTION
- FIGURE 08. THREAT OF SUBSTITUTION
- FIGURE 09. COMPETITIVE RIVALRY
- FIGURE 10. GLOBAL BEVERAGE DISPENSER MARKET:DRIVERS, RESTRAINTS AND OPPORTUNITIES
- FIGURE 11. BEVERAGE DISPENSER MARKET, BY TYPE, 2022 AND 2032(%)
- FIGURE 12. COMPARATIVE SHARE ANALYSIS OF BEVERAGE DISPENSER MARKET FOR COLD BEVERAGE DISPENSER, BY COUNTRY 2022 AND 2032(%)
- FIGURE 13. COMPARATIVE SHARE ANALYSIS OF BEVERAGE DISPENSER MARKET FOR HOT BEVERAGE DISPENSER, BY COUNTRY 2022 AND 2032(%)
- FIGURE 14. BEVERAGE DISPENSER MARKET, BY MATERIAL, 2022 AND 2032(%)
- FIGURE 15. COMPARATIVE SHARE ANALYSIS OF BEVERAGE DISPENSER MARKET FOR PLASTIC, BY COUNTRY 2022 AND 2032(%)
- FIGURE 16. COMPARATIVE SHARE ANALYSIS OF BEVERAGE DISPENSER MARKET FOR STAINLESS STEEL, BY COUNTRY 2022 AND 2032(%)
- FIGURE 17. COMPARATIVE SHARE ANALYSIS OF BEVERAGE DISPENSER MARKET FOR OTHERS, BY COUNTRY 2022 AND 2032(%)
- FIGURE 18. BEVERAGE DISPENSER MARKET, BY END USE, 2022 AND 2032(%)
- FIGURE 19. COMPARATIVE SHARE ANALYSIS OF BEVERAGE DISPENSER MARKET FOR COMMERCIAL, BY COUNTRY 2022 AND 2032(%)
- FIGURE 20. COMPARATIVE SHARE ANALYSIS OF BEVERAGE DISPENSER MARKET FOR RESIDENTIAL, BY COUNTRY 2022 AND 2032(%)
- FIGURE 21. BEVERAGE DISPENSER MARKET BY REGION, 2022 AND 2032(%)
- FIGURE 22. U.S. BEVERAGE DISPENSER MARKET, 2022-2032 ($MILLION)
- FIGURE 23. CANADA BEVERAGE DISPENSER MARKET, 2022-2032 ($MILLION)
- FIGURE 24. MEXICO BEVERAGE DISPENSER MARKET, 2022-2032 ($MILLION)
- FIGURE 25. FRANCE BEVERAGE DISPENSER MARKET, 2022-2032 ($MILLION)
- FIGURE 26. ITALY BEVERAGE DISPENSER MARKET, 2022-2032 ($MILLION)
- FIGURE 27. GERMANY BEVERAGE DISPENSER MARKET, 2022-2032 ($MILLION)
- FIGURE 28. UK BEVERAGE DISPENSER MARKET, 2022-2032 ($MILLION)
- FIGURE 29. SPAIN BEVERAGE DISPENSER MARKET, 2022-2032 ($MILLION)
- FIGURE 30. REST OF EUROPE BEVERAGE DISPENSER MARKET, 2022-2032 ($MILLION)
- FIGURE 31. CHINA BEVERAGE DISPENSER MARKET, 2022-2032 ($MILLION)
- FIGURE 32. INDIA BEVERAGE DISPENSER MARKET, 2022-2032 ($MILLION)
- FIGURE 33. JAPAN BEVERAGE DISPENSER MARKET, 2022-2032 ($MILLION)
- FIGURE 34. AUSTRALIA BEVERAGE DISPENSER MARKET, 2022-2032 ($MILLION)
- FIGURE 35. SOUTH KOREA BEVERAGE DISPENSER MARKET, 2022-2032 ($MILLION)
- FIGURE 36. REST OF ASIA-PACIFIC BEVERAGE DISPENSER MARKET, 2022-2032 ($MILLION)
- FIGURE 37. BRAZIL BEVERAGE DISPENSER MARKET, 2022-2032 ($MILLION)
- FIGURE 38. SOUTH AFRICA BEVERAGE DISPENSER MARKET, 2022-2032 ($MILLION)
- FIGURE 39. UNITED ARAB EMIRATES BEVERAGE DISPENSER MARKET, 2022-2032 ($MILLION)
- FIGURE 40. SAUDI ARABIA BEVERAGE DISPENSER MARKET, 2022-2032 ($MILLION)
- FIGURE 41. REST OF LAMEA BEVERAGE DISPENSER MARKET, 2022-2032 ($MILLION)
- FIGURE 42. TOP WINNING STRATEGIES, BY YEAR
- FIGURE 43. TOP WINNING STRATEGIES, BY DEVELOPMENT
- FIGURE 44. TOP WINNING STRATEGIES, BY COMPANY
- FIGURE 45. PRODUCT MAPPING OF TOP 10 PLAYERS
- FIGURE 46. COMPETITIVE DASHBOARD
- FIGURE 47. COMPETITIVE HEATMAP: BEVERAGE DISPENSER MARKET
- FIGURE 48. TOP PLAYER POSITIONING, 2022

