
PUBLISHER: Allied Market Research | PRODUCT CODE: 1447192

PUBLISHER: Allied Market Research | PRODUCT CODE: 1447192
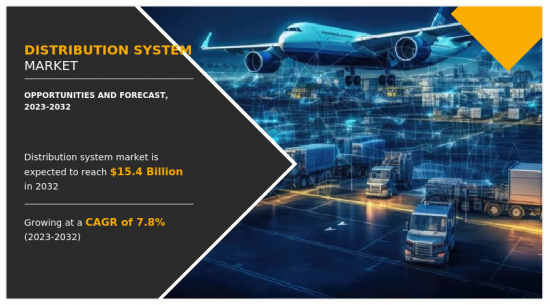
Distribution System Market By Component (Software, Services), By Application (Hotels and Resorts, Cruises, Car Rental, Aviation, Others): Global Opportunity Analysis and Industry Forecast, 2023-2032
Travel agencies, travel management firms, and other travel service providers use technological platforms and networks to access and distribute travel-related content and services. This market is known as the global distribution system (GDS) market. GDS serve as interface bringing together providers including hotels, rental car agencies, airlines, and travel agencies to ease information sharing, reservation-making, and transaction processing. Additionally, companies in this market provide all-inclusive platforms that compile and present current travel inventory, such as flight times, hotel availability, rental car choices, and cost details. Travel agencies and other users are endowed to search, evaluate, and make reservations for travel services on behalf of their clients with the help of these platforms. GDS platforms connect users with a global network of suppliers and travel-related content, making them renowned for their broad reach. The entire travel booking experience is improved by these platforms as it expedites the reservation process, automate procedures, and facilitate effective communication between travel agents and service suppliers. Furthermore, the growing complexity of the travel sector and the rising demand for travel are the main drivers of the worldwide distribution system market. GDS platforms are essential for streamlining the booking process, giving users access to a large variety of travel options, and guaranteeing accurate and current information as the travel industry grows more varied and competitive.
Surge in rising levels of globalization and modernization of technology primarily drives the growth of the distribution system market. However, rising implementation costs and complexity and the difficulty of integration hamper market growth to some extent. Moreover, enhanced effectiveness and output is expected to provide lucrative opportunities for market growth during the forecast period.
On the basis of component, software segment dominated the Distribution system market in 2022 and is expected to maintain its dominance in the upcoming years owing to the offer businesses the ability to manage record, handle logistics, track orders, and also analyze data, between other tasks propels the market growth significantly. However, the services segment is expected to witness the highest growth, owing to organization to help organizations leverage the data generated by the global distribution system to optimize their operations, gain valuable insights, and make informed decisions.
The distribution system market is segmented on the basis of component, application and region. On the basis of component, it is divided into software and services. On the basis of application, it is fragmented into hotels and resorts, cruises, car rental, aviation, and others. On the basis of region, it is analyzed across North America, Europe, Asia-Pacific, Latin America, and Middle East and Africa.
Region-wise, the distribution system market size was dominated by North America in 2022 and is expected to retain its position during the forecast period, owing to the increased focus on technological advancements and infrastructure development aiding the growth of the distribution system market. However, Asia-Pacific is expected to witness significant growth during the forecast period, owing to the increased need for strong distribution networks and efficient order fulfillment processes, which is expected to fuel the market growth in this region.
The key players operating in the market are Amadeus IT Group SA, Sabre GLBL Inc., Travelport, Pegasus, TravelSky Technology Limited., Sirena-Travel JSC, SiteMinder, INFINI, TravelPerk and kiu system solutions. Furthermore, it highlights the strategies of the key players to improve the market share and sustain competition.
Key Benefits For Stakeholders
- This report provides a quantitative analysis of the market segments, current trends, estimations, and dynamics of the distribution system market analysis from 2022 to 2032 to identify the prevailing distribution system market opportunities.
- The market research is offered along with information related to key drivers, restraints, and opportunities.
- Porter's five forces analysis highlights the potency of buyers and suppliers to enable stakeholders make profit-oriented business decisions and strengthen their supplier-buyer network.
- In-depth analysis of the distribution system market segmentation assists to determine the prevailing market opportunities.
- Major countries in each region are mapped according to their revenue contribution to the global market.
- Market player positioning facilitates benchmarking and provides a clear understanding of the present position of the market players.
- The report includes the analysis of the regional as well as global distribution system market trends, key players, market segments, application areas, and market growth strategies.
Additional benefits you will get with this purchase are:
- Quarterly Update and* (only available with a corporate license, on listed price)
- 5 additional Company Profile of client Choice pre- or Post-purchase, as a free update.
- Free Upcoming Version on the Purchase of Five and Enterprise User License.
- 16 analyst hours of support* (post-purchase, if you find additional data requirements upon review of the report, you may receive support amounting to 16 analyst hours to solve questions, and post-sale queries)
- 15% Free Customization* (in case the scope or segment of the report does not match your requirements, 15% is equivalent to 3 working days of free work, applicable once)
- Free data Pack on the Five and Enterprise User License. (Excel version of the report)
- Free Updated report if the report is 6-12 months old or older.
- 24-hour priority response*
- Free Industry updates and white papers.
Possible Customization with this report (with additional cost and timeline, please talk to the sales executive to know more)
- Upcoming/New Entrant by Regions
- Regulatory Guidelines
- Strategic Recommedations
- Additional company profiles with specific to client's interest
- Historic market data
- SWOT Analysis
Key Market Segments
By Application
- Hotels and Resorts
- Cruises
- Car Rental
- Aviation
- Others
By Component
- Software
- Services
By Region
- North America
- U.S.
- Canada
- Europe
- UK
- Germany
- France
- Italy
- Spain
- Rest of Europe
- Asia-Pacific
- China
- Japan
- India
- Australia
- South Korea
- Rest of Asia-Pacific
- Latin America
- Brazil
- Argentina
- Colombia
- Rest of Latin America
- Middle East and Africa
- Saudi Arabia
- South Africa
- UAE
- Rest of Middle East And Africa
Key Market Players:
- Amadeus IT Group SA
- Sabre GLBL Inc.
- Travelport
- Pegasus
- TravelSky Technology Limited.
- Sirena-Travel JSC
- SiteMinder
- INFINI
- kiu system solutions
TABLE OF CONTENTS
CHAPTER 1: INTRODUCTION
- 1.1. Report description
- 1.2. Key market segments
- 1.3. Key benefits to the stakeholders
- 1.4. Research methodology
- 1.4.1. Primary research
- 1.4.2. Secondary research
- 1.4.3. Analyst tools and models
CHAPTER 2: EXECUTIVE SUMMARY
- 2.1. CXO Perspective
CHAPTER 3: MARKET OVERVIEW
- 3.1. Market definition and scope
- 3.2. Key findings
- 3.2.1. Top impacting factors
- 3.2.2. Top investment pockets
- 3.3. Porter's five forces analysis
- 3.4. Market dynamics
- 3.4.1. Drivers
- 3.4.2. Restraints
- 3.4.3. Opportunities
CHAPTER 4: DISTRIBUTION SYSTEM MARKET, BY COMPONENT
- 4.1. Overview
- 4.1.1. Market size and forecast
- 4.2. Software
- 4.2.1. Key market trends, growth factors and opportunities
- 4.2.2. Market size and forecast, by region
- 4.2.3. Market share analysis by country
- 4.3. Services
- 4.3.1. Key market trends, growth factors and opportunities
- 4.3.2. Market size and forecast, by region
- 4.3.3. Market share analysis by country
CHAPTER 5: DISTRIBUTION SYSTEM MARKET, BY APPLICATION
- 5.1. Overview
- 5.1.1. Market size and forecast
- 5.2. Hotels and Resorts
- 5.2.1. Key market trends, growth factors and opportunities
- 5.2.2. Market size and forecast, by region
- 5.2.3. Market share analysis by country
- 5.3. Cruises
- 5.3.1. Key market trends, growth factors and opportunities
- 5.3.2. Market size and forecast, by region
- 5.3.3. Market share analysis by country
- 5.4. Car Rental
- 5.4.1. Key market trends, growth factors and opportunities
- 5.4.2. Market size and forecast, by region
- 5.4.3. Market share analysis by country
- 5.5. Aviation
- 5.5.1. Key market trends, growth factors and opportunities
- 5.5.2. Market size and forecast, by region
- 5.5.3. Market share analysis by country
- 5.6. Others
- 5.6.1. Key market trends, growth factors and opportunities
- 5.6.2. Market size and forecast, by region
- 5.6.3. Market share analysis by country
CHAPTER 6: DISTRIBUTION SYSTEM MARKET, BY REGION
- 6.1. Overview
- 6.1.1. Market size and forecast By Region
- 6.2. North America
- 6.2.1. Key market trends, growth factors and opportunities
- 6.2.2. Market size and forecast, by Component
- 6.2.3. Market size and forecast, by Application
- 6.2.4. Market size and forecast, by country
- 6.2.4.1. U.S.
- 6.2.4.1.1. Market size and forecast, by Component
- 6.2.4.1.2. Market size and forecast, by Application
- 6.2.4.2. Canada
- 6.2.4.2.1. Market size and forecast, by Component
- 6.2.4.2.2. Market size and forecast, by Application
- 6.3. Europe
- 6.3.1. Key market trends, growth factors and opportunities
- 6.3.2. Market size and forecast, by Component
- 6.3.3. Market size and forecast, by Application
- 6.3.4. Market size and forecast, by country
- 6.3.4.1. UK
- 6.3.4.1.1. Market size and forecast, by Component
- 6.3.4.1.2. Market size and forecast, by Application
- 6.3.4.2. Germany
- 6.3.4.2.1. Market size and forecast, by Component
- 6.3.4.2.2. Market size and forecast, by Application
- 6.3.4.3. France
- 6.3.4.3.1. Market size and forecast, by Component
- 6.3.4.3.2. Market size and forecast, by Application
- 6.3.4.4. Italy
- 6.3.4.4.1. Market size and forecast, by Component
- 6.3.4.4.2. Market size and forecast, by Application
- 6.3.4.5. Spain
- 6.3.4.5.1. Market size and forecast, by Component
- 6.3.4.5.2. Market size and forecast, by Application
- 6.3.4.6. Rest of Europe
- 6.3.4.6.1. Market size and forecast, by Component
- 6.3.4.6.2. Market size and forecast, by Application
- 6.4. Asia-Pacific
- 6.4.1. Key market trends, growth factors and opportunities
- 6.4.2. Market size and forecast, by Component
- 6.4.3. Market size and forecast, by Application
- 6.4.4. Market size and forecast, by country
- 6.4.4.1. China
- 6.4.4.1.1. Market size and forecast, by Component
- 6.4.4.1.2. Market size and forecast, by Application
- 6.4.4.2. Japan
- 6.4.4.2.1. Market size and forecast, by Component
- 6.4.4.2.2. Market size and forecast, by Application
- 6.4.4.3. India
- 6.4.4.3.1. Market size and forecast, by Component
- 6.4.4.3.2. Market size and forecast, by Application
- 6.4.4.4. Australia
- 6.4.4.4.1. Market size and forecast, by Component
- 6.4.4.4.2. Market size and forecast, by Application
- 6.4.4.5. South Korea
- 6.4.4.5.1. Market size and forecast, by Component
- 6.4.4.5.2. Market size and forecast, by Application
- 6.4.4.6. Rest of Asia-Pacific
- 6.4.4.6.1. Market size and forecast, by Component
- 6.4.4.6.2. Market size and forecast, by Application
- 6.5. Latin America
- 6.5.1. Key market trends, growth factors and opportunities
- 6.5.2. Market size and forecast, by Component
- 6.5.3. Market size and forecast, by Application
- 6.5.4. Market size and forecast, by country
- 6.5.4.1. Brazil
- 6.5.4.1.1. Market size and forecast, by Component
- 6.5.4.1.2. Market size and forecast, by Application
- 6.5.4.2. Argentina
- 6.5.4.2.1. Market size and forecast, by Component
- 6.5.4.2.2. Market size and forecast, by Application
- 6.5.4.3. Colombia
- 6.5.4.3.1. Market size and forecast, by Component
- 6.5.4.3.2. Market size and forecast, by Application
- 6.5.4.4. Rest of Latin America
- 6.5.4.4.1. Market size and forecast, by Component
- 6.5.4.4.2. Market size and forecast, by Application
- 6.6. Middle East and Africa
- 6.6.1. Key market trends, growth factors and opportunities
- 6.6.2. Market size and forecast, by Component
- 6.6.3. Market size and forecast, by Application
- 6.6.4. Market size and forecast, by country
- 6.6.4.1. Saudi Arabia
- 6.6.4.1.1. Market size and forecast, by Component
- 6.6.4.1.2. Market size and forecast, by Application
- 6.6.4.2. South Africa
- 6.6.4.2.1. Market size and forecast, by Component
- 6.6.4.2.2. Market size and forecast, by Application
- 6.6.4.3. UAE
- 6.6.4.3.1. Market size and forecast, by Component
- 6.6.4.3.2. Market size and forecast, by Application
- 6.6.4.4. Rest of Middle East And Africa
- 6.6.4.4.1. Market size and forecast, by Component
- 6.6.4.4.2. Market size and forecast, by Application
CHAPTER 7: COMPETITIVE LANDSCAPE
- 7.1. Introduction
- 7.2. Top winning strategies
- 7.3. Product mapping of top 10 player
- 7.4. Competitive dashboard
- 7.5. Competitive heatmap
- 7.6. Top player positioning, 2022
CHAPTER 8: COMPANY PROFILES
- 8.1. Amadeus IT Group SA
- 8.1.1. Company overview
- 8.1.2. Key executives
- 8.1.3. Company snapshot
- 8.1.4. Operating business segments
- 8.1.5. Product portfolio
- 8.1.6. Business performance
- 8.1.7. Key strategic moves and developments
- 8.2. Sabre GLBL Inc.
- 8.2.1. Company overview
- 8.2.2. Key executives
- 8.2.3. Company snapshot
- 8.2.4. Operating business segments
- 8.2.5. Product portfolio
- 8.2.6. Business performance
- 8.2.7. Key strategic moves and developments
- 8.3. Travelport
- 8.3.1. Company overview
- 8.3.2. Key executives
- 8.3.3. Company snapshot
- 8.3.4. Operating business segments
- 8.3.5. Product portfolio
- 8.3.6. Business performance
- 8.3.7. Key strategic moves and developments
- 8.4. Pegasus
- 8.4.1. Company overview
- 8.4.2. Key executives
- 8.4.3. Company snapshot
- 8.4.4. Operating business segments
- 8.4.5. Product portfolio
- 8.4.6. Business performance
- 8.4.7. Key strategic moves and developments
- 8.5. TravelSky Technology Limited.
- 8.5.1. Company overview
- 8.5.2. Key executives
- 8.5.3. Company snapshot
- 8.5.4. Operating business segments
- 8.5.5. Product portfolio
- 8.5.6. Business performance
- 8.5.7. Key strategic moves and developments
- 8.6. Sirena-Travel JSC
- 8.6.1. Company overview
- 8.6.2. Key executives
- 8.6.3. Company snapshot
- 8.6.4. Operating business segments
- 8.6.5. Product portfolio
- 8.6.6. Business performance
- 8.6.7. Key strategic moves and developments
- 8.7. SiteMinder
- 8.7.1. Company overview
- 8.7.2. Key executives
- 8.7.3. Company snapshot
- 8.7.4. Operating business segments
- 8.7.5. Product portfolio
- 8.7.6. Business performance
- 8.7.7. Key strategic moves and developments
- 8.8. INFINI
- 8.8.1. Company overview
- 8.8.2. Key executives
- 8.8.3. Company snapshot
- 8.8.4. Operating business segments
- 8.8.5. Product portfolio
- 8.8.6. Business performance
- 8.8.7. Key strategic moves and developments
- 8.9. kiu system solutions
- 8.9.1. Company overview
- 8.9.2. Key executives
- 8.9.3. Company snapshot
- 8.9.4. Operating business segments
- 8.9.5. Product portfolio
- 8.9.6. Business performance
- 8.9.7. Key strategic moves and developments
LIST OF TABLES
- TABLE 01. GLOBAL DISTRIBUTION SYSTEM MARKET, BY COMPONENT, 2022-2032 ($MILLION)
- TABLE 02. DISTRIBUTION SYSTEM MARKET FOR SOFTWARE, BY REGION, 2022-2032 ($MILLION)
- TABLE 03. DISTRIBUTION SYSTEM MARKET FOR SERVICES, BY REGION, 2022-2032 ($MILLION)
- TABLE 04. GLOBAL DISTRIBUTION SYSTEM MARKET, BY APPLICATION, 2022-2032 ($MILLION)
- TABLE 05. DISTRIBUTION SYSTEM MARKET FOR HOTELS AND RESORTS, BY REGION, 2022-2032 ($MILLION)
- TABLE 06. DISTRIBUTION SYSTEM MARKET FOR CRUISES, BY REGION, 2022-2032 ($MILLION)
- TABLE 07. DISTRIBUTION SYSTEM MARKET FOR CAR RENTAL, BY REGION, 2022-2032 ($MILLION)
- TABLE 08. DISTRIBUTION SYSTEM MARKET FOR AVIATION, BY REGION, 2022-2032 ($MILLION)
- TABLE 09. DISTRIBUTION SYSTEM MARKET FOR OTHERS, BY REGION, 2022-2032 ($MILLION)
- TABLE 10. DISTRIBUTION SYSTEM MARKET, BY REGION, 2022-2032 ($MILLION)
- TABLE 11. NORTH AMERICA DISTRIBUTION SYSTEM MARKET, BY COMPONENT, 2022-2032 ($MILLION)
- TABLE 12. NORTH AMERICA DISTRIBUTION SYSTEM MARKET, BY APPLICATION, 2022-2032 ($MILLION)
- TABLE 13. NORTH AMERICA DISTRIBUTION SYSTEM MARKET, BY COUNTRY, 2022-2032 ($MILLION)
- TABLE 14. U.S. DISTRIBUTION SYSTEM MARKET, BY COMPONENT, 2022-2032 ($MILLION)
- TABLE 15. U.S. DISTRIBUTION SYSTEM MARKET, BY APPLICATION, 2022-2032 ($MILLION)
- TABLE 16. CANADA DISTRIBUTION SYSTEM MARKET, BY COMPONENT, 2022-2032 ($MILLION)
- TABLE 17. CANADA DISTRIBUTION SYSTEM MARKET, BY APPLICATION, 2022-2032 ($MILLION)
- TABLE 18. EUROPE DISTRIBUTION SYSTEM MARKET, BY COMPONENT, 2022-2032 ($MILLION)
- TABLE 19. EUROPE DISTRIBUTION SYSTEM MARKET, BY APPLICATION, 2022-2032 ($MILLION)
- TABLE 20. EUROPE DISTRIBUTION SYSTEM MARKET, BY COUNTRY, 2022-2032 ($MILLION)
- TABLE 21. UK DISTRIBUTION SYSTEM MARKET, BY COMPONENT, 2022-2032 ($MILLION)
- TABLE 22. UK DISTRIBUTION SYSTEM MARKET, BY APPLICATION, 2022-2032 ($MILLION)
- TABLE 23. GERMANY DISTRIBUTION SYSTEM MARKET, BY COMPONENT, 2022-2032 ($MILLION)
- TABLE 24. GERMANY DISTRIBUTION SYSTEM MARKET, BY APPLICATION, 2022-2032 ($MILLION)
- TABLE 25. FRANCE DISTRIBUTION SYSTEM MARKET, BY COMPONENT, 2022-2032 ($MILLION)
- TABLE 26. FRANCE DISTRIBUTION SYSTEM MARKET, BY APPLICATION, 2022-2032 ($MILLION)
- TABLE 27. ITALY DISTRIBUTION SYSTEM MARKET, BY COMPONENT, 2022-2032 ($MILLION)
- TABLE 28. ITALY DISTRIBUTION SYSTEM MARKET, BY APPLICATION, 2022-2032 ($MILLION)
- TABLE 29. SPAIN DISTRIBUTION SYSTEM MARKET, BY COMPONENT, 2022-2032 ($MILLION)
- TABLE 30. SPAIN DISTRIBUTION SYSTEM MARKET, BY APPLICATION, 2022-2032 ($MILLION)
- TABLE 31. REST OF EUROPE DISTRIBUTION SYSTEM MARKET, BY COMPONENT, 2022-2032 ($MILLION)
- TABLE 32. REST OF EUROPE DISTRIBUTION SYSTEM MARKET, BY APPLICATION, 2022-2032 ($MILLION)
- TABLE 33. ASIA-PACIFIC DISTRIBUTION SYSTEM MARKET, BY COMPONENT, 2022-2032 ($MILLION)
- TABLE 34. ASIA-PACIFIC DISTRIBUTION SYSTEM MARKET, BY APPLICATION, 2022-2032 ($MILLION)
- TABLE 35. ASIA-PACIFIC DISTRIBUTION SYSTEM MARKET, BY COUNTRY, 2022-2032 ($MILLION)
- TABLE 36. CHINA DISTRIBUTION SYSTEM MARKET, BY COMPONENT, 2022-2032 ($MILLION)
- TABLE 37. CHINA DISTRIBUTION SYSTEM MARKET, BY APPLICATION, 2022-2032 ($MILLION)
- TABLE 38. JAPAN DISTRIBUTION SYSTEM MARKET, BY COMPONENT, 2022-2032 ($MILLION)
- TABLE 39. JAPAN DISTRIBUTION SYSTEM MARKET, BY APPLICATION, 2022-2032 ($MILLION)
- TABLE 40. INDIA DISTRIBUTION SYSTEM MARKET, BY COMPONENT, 2022-2032 ($MILLION)
- TABLE 41. INDIA DISTRIBUTION SYSTEM MARKET, BY APPLICATION, 2022-2032 ($MILLION)
- TABLE 42. AUSTRALIA DISTRIBUTION SYSTEM MARKET, BY COMPONENT, 2022-2032 ($MILLION)
- TABLE 43. AUSTRALIA DISTRIBUTION SYSTEM MARKET, BY APPLICATION, 2022-2032 ($MILLION)
- TABLE 44. SOUTH KOREA DISTRIBUTION SYSTEM MARKET, BY COMPONENT, 2022-2032 ($MILLION)
- TABLE 45. SOUTH KOREA DISTRIBUTION SYSTEM MARKET, BY APPLICATION, 2022-2032 ($MILLION)
- TABLE 46. REST OF ASIA-PACIFIC DISTRIBUTION SYSTEM MARKET, BY COMPONENT, 2022-2032 ($MILLION)
- TABLE 47. REST OF ASIA-PACIFIC DISTRIBUTION SYSTEM MARKET, BY APPLICATION, 2022-2032 ($MILLION)
- TABLE 48. LATIN AMERICA DISTRIBUTION SYSTEM MARKET, BY COMPONENT, 2022-2032 ($MILLION)
- TABLE 49. LATIN AMERICA DISTRIBUTION SYSTEM MARKET, BY APPLICATION, 2022-2032 ($MILLION)
- TABLE 50. LATIN AMERICA DISTRIBUTION SYSTEM MARKET, BY COUNTRY, 2022-2032 ($MILLION)
- TABLE 51. BRAZIL DISTRIBUTION SYSTEM MARKET, BY COMPONENT, 2022-2032 ($MILLION)
- TABLE 52. BRAZIL DISTRIBUTION SYSTEM MARKET, BY APPLICATION, 2022-2032 ($MILLION)
- TABLE 53. ARGENTINA DISTRIBUTION SYSTEM MARKET, BY COMPONENT, 2022-2032 ($MILLION)
- TABLE 54. ARGENTINA DISTRIBUTION SYSTEM MARKET, BY APPLICATION, 2022-2032 ($MILLION)
- TABLE 55. COLOMBIA DISTRIBUTION SYSTEM MARKET, BY COMPONENT, 2022-2032 ($MILLION)
- TABLE 56. COLOMBIA DISTRIBUTION SYSTEM MARKET, BY APPLICATION, 2022-2032 ($MILLION)
- TABLE 57. REST OF LATIN AMERICA DISTRIBUTION SYSTEM MARKET, BY COMPONENT, 2022-2032 ($MILLION)
- TABLE 58. REST OF LATIN AMERICA DISTRIBUTION SYSTEM MARKET, BY APPLICATION, 2022-2032 ($MILLION)
- TABLE 59. MIDDLE EAST AND AFRICA DISTRIBUTION SYSTEM MARKET, BY COMPONENT, 2022-2032 ($MILLION)
- TABLE 60. MIDDLE EAST AND AFRICA DISTRIBUTION SYSTEM MARKET, BY APPLICATION, 2022-2032 ($MILLION)
- TABLE 61. MIDDLE EAST AND AFRICA DISTRIBUTION SYSTEM MARKET, BY COUNTRY, 2022-2032 ($MILLION)
- TABLE 62. SAUDI ARABIA DISTRIBUTION SYSTEM MARKET, BY COMPONENT, 2022-2032 ($MILLION)
- TABLE 63. SAUDI ARABIA DISTRIBUTION SYSTEM MARKET, BY APPLICATION, 2022-2032 ($MILLION)
- TABLE 64. SOUTH AFRICA DISTRIBUTION SYSTEM MARKET, BY COMPONENT, 2022-2032 ($MILLION)
- TABLE 65. SOUTH AFRICA DISTRIBUTION SYSTEM MARKET, BY APPLICATION, 2022-2032 ($MILLION)
- TABLE 66. UAE DISTRIBUTION SYSTEM MARKET, BY COMPONENT, 2022-2032 ($MILLION)
- TABLE 67. UAE DISTRIBUTION SYSTEM MARKET, BY APPLICATION, 2022-2032 ($MILLION)
- TABLE 68. REST OF MIDDLE EAST AND AFRICA DISTRIBUTION SYSTEM MARKET, BY COMPONENT, 2022-2032 ($MILLION)
- TABLE 69. REST OF MIDDLE EAST AND AFRICA DISTRIBUTION SYSTEM MARKET, BY APPLICATION, 2022-2032 ($MILLION)
- TABLE 70. AMADEUS IT GROUP SA: KEY EXECUTIVES
- TABLE 71. AMADEUS IT GROUP SA: COMPANY SNAPSHOT
- TABLE 72. AMADEUS IT GROUP SA: PRODUCT SEGMENTS
- TABLE 73. AMADEUS IT GROUP SA: SERVICE SEGMENTS
- TABLE 74. AMADEUS IT GROUP SA: PRODUCT PORTFOLIO
- TABLE 75. AMADEUS IT GROUP SA: KEY STRATERGIES
- TABLE 76. SABRE GLBL INC.: KEY EXECUTIVES
- TABLE 77. SABRE GLBL INC.: COMPANY SNAPSHOT
- TABLE 78. SABRE GLBL INC.: PRODUCT SEGMENTS
- TABLE 79. SABRE GLBL INC.: SERVICE SEGMENTS
- TABLE 80. SABRE GLBL INC.: PRODUCT PORTFOLIO
- TABLE 81. SABRE GLBL INC.: KEY STRATERGIES
- TABLE 82. TRAVELPORT: KEY EXECUTIVES
- TABLE 83. TRAVELPORT: COMPANY SNAPSHOT
- TABLE 84. TRAVELPORT: PRODUCT SEGMENTS
- TABLE 85. TRAVELPORT: SERVICE SEGMENTS
- TABLE 86. TRAVELPORT: PRODUCT PORTFOLIO
- TABLE 87. TRAVELPORT: KEY STRATERGIES
- TABLE 88. PEGASUS: KEY EXECUTIVES
- TABLE 89. PEGASUS: COMPANY SNAPSHOT
- TABLE 90. PEGASUS: PRODUCT SEGMENTS
- TABLE 91. PEGASUS: SERVICE SEGMENTS
- TABLE 92. PEGASUS: PRODUCT PORTFOLIO
- TABLE 93. PEGASUS: KEY STRATERGIES
- TABLE 94. TRAVELSKY TECHNOLOGY LIMITED.: KEY EXECUTIVES
- TABLE 95. TRAVELSKY TECHNOLOGY LIMITED.: COMPANY SNAPSHOT
- TABLE 96. TRAVELSKY TECHNOLOGY LIMITED.: PRODUCT SEGMENTS
- TABLE 97. TRAVELSKY TECHNOLOGY LIMITED.: SERVICE SEGMENTS
- TABLE 98. TRAVELSKY TECHNOLOGY LIMITED.: PRODUCT PORTFOLIO
- TABLE 99. TRAVELSKY TECHNOLOGY LIMITED.: KEY STRATERGIES
- TABLE 100. SIRENA-TRAVEL JSC: KEY EXECUTIVES
- TABLE 101. SIRENA-TRAVEL JSC: COMPANY SNAPSHOT
- TABLE 102. SIRENA-TRAVEL JSC: PRODUCT SEGMENTS
- TABLE 103. SIRENA-TRAVEL JSC: SERVICE SEGMENTS
- TABLE 104. SIRENA-TRAVEL JSC: PRODUCT PORTFOLIO
- TABLE 105. SIRENA-TRAVEL JSC: KEY STRATERGIES
- TABLE 106. SITEMINDER: KEY EXECUTIVES
- TABLE 107. SITEMINDER: COMPANY SNAPSHOT
- TABLE 108. SITEMINDER: PRODUCT SEGMENTS
- TABLE 109. SITEMINDER: SERVICE SEGMENTS
- TABLE 110. SITEMINDER: PRODUCT PORTFOLIO
- TABLE 111. SITEMINDER: KEY STRATERGIES
- TABLE 112. INFINI: KEY EXECUTIVES
- TABLE 113. INFINI: COMPANY SNAPSHOT
- TABLE 114. INFINI: PRODUCT SEGMENTS
- TABLE 115. INFINI: SERVICE SEGMENTS
- TABLE 116. INFINI: PRODUCT PORTFOLIO
- TABLE 117. INFINI: KEY STRATERGIES
- TABLE 118. KIU SYSTEM SOLUTIONS: KEY EXECUTIVES
- TABLE 119. KIU SYSTEM SOLUTIONS: COMPANY SNAPSHOT
- TABLE 120. KIU SYSTEM SOLUTIONS: PRODUCT SEGMENTS
- TABLE 121. KIU SYSTEM SOLUTIONS: SERVICE SEGMENTS
- TABLE 122. KIU SYSTEM SOLUTIONS: PRODUCT PORTFOLIO
- TABLE 123. KIU SYSTEM SOLUTIONS: KEY STRATERGIES
LIST OF FIGURES
- FIGURE 01. DISTRIBUTION SYSTEM MARKET, 2022-2032
- FIGURE 02. SEGMENTATION OF DISTRIBUTION SYSTEM MARKET,2022-2032
- FIGURE 03. TOP IMPACTING FACTORS IN DISTRIBUTION SYSTEM MARKET
- FIGURE 04. TOP INVESTMENT POCKETS IN DISTRIBUTION SYSTEM MARKET (2023-2032)
- FIGURE 05. BARGAINING POWER OF SUPPLIERS
- FIGURE 06. BARGAINING POWER OF BUYERS
- FIGURE 07. THREAT OF SUBSTITUTION
- FIGURE 08. THREAT OF SUBSTITUTION
- FIGURE 09. COMPETITIVE RIVALRY
- FIGURE 10. GLOBAL DISTRIBUTION SYSTEM MARKET:DRIVERS, RESTRAINTS AND OPPORTUNITIES
- FIGURE 11. DISTRIBUTION SYSTEM MARKET, BY COMPONENT, 2022 AND 2032(%)
- FIGURE 12. COMPARATIVE SHARE ANALYSIS OF DISTRIBUTION SYSTEM MARKET FOR SOFTWARE, BY COUNTRY 2022 AND 2032(%)
- FIGURE 13. COMPARATIVE SHARE ANALYSIS OF DISTRIBUTION SYSTEM MARKET FOR SERVICES, BY COUNTRY 2022 AND 2032(%)
- FIGURE 14. DISTRIBUTION SYSTEM MARKET, BY APPLICATION, 2022 AND 2032(%)
- FIGURE 15. COMPARATIVE SHARE ANALYSIS OF DISTRIBUTION SYSTEM MARKET FOR HOTELS AND RESORTS, BY COUNTRY 2022 AND 2032(%)
- FIGURE 16. COMPARATIVE SHARE ANALYSIS OF DISTRIBUTION SYSTEM MARKET FOR CRUISES, BY COUNTRY 2022 AND 2032(%)
- FIGURE 17. COMPARATIVE SHARE ANALYSIS OF DISTRIBUTION SYSTEM MARKET FOR CAR RENTAL, BY COUNTRY 2022 AND 2032(%)
- FIGURE 18. COMPARATIVE SHARE ANALYSIS OF DISTRIBUTION SYSTEM MARKET FOR AVIATION, BY COUNTRY 2022 AND 2032(%)
- FIGURE 19. COMPARATIVE SHARE ANALYSIS OF DISTRIBUTION SYSTEM MARKET FOR OTHERS, BY COUNTRY 2022 AND 2032(%)
- FIGURE 20. DISTRIBUTION SYSTEM MARKET BY REGION, 2022 AND 2032(%)
- FIGURE 21. U.S. DISTRIBUTION SYSTEM MARKET, 2022-2032 ($MILLION)
- FIGURE 22. CANADA DISTRIBUTION SYSTEM MARKET, 2022-2032 ($MILLION)
- FIGURE 23. UK DISTRIBUTION SYSTEM MARKET, 2022-2032 ($MILLION)
- FIGURE 24. GERMANY DISTRIBUTION SYSTEM MARKET, 2022-2032 ($MILLION)
- FIGURE 25. FRANCE DISTRIBUTION SYSTEM MARKET, 2022-2032 ($MILLION)
- FIGURE 26. ITALY DISTRIBUTION SYSTEM MARKET, 2022-2032 ($MILLION)
- FIGURE 27. SPAIN DISTRIBUTION SYSTEM MARKET, 2022-2032 ($MILLION)
- FIGURE 28. REST OF EUROPE DISTRIBUTION SYSTEM MARKET, 2022-2032 ($MILLION)
- FIGURE 29. CHINA DISTRIBUTION SYSTEM MARKET, 2022-2032 ($MILLION)
- FIGURE 30. JAPAN DISTRIBUTION SYSTEM MARKET, 2022-2032 ($MILLION)
- FIGURE 31. INDIA DISTRIBUTION SYSTEM MARKET, 2022-2032 ($MILLION)
- FIGURE 32. AUSTRALIA DISTRIBUTION SYSTEM MARKET, 2022-2032 ($MILLION)
- FIGURE 33. SOUTH KOREA DISTRIBUTION SYSTEM MARKET, 2022-2032 ($MILLION)
- FIGURE 34. REST OF ASIA-PACIFIC DISTRIBUTION SYSTEM MARKET, 2022-2032 ($MILLION)
- FIGURE 35. BRAZIL DISTRIBUTION SYSTEM MARKET, 2022-2032 ($MILLION)
- FIGURE 36. ARGENTINA DISTRIBUTION SYSTEM MARKET, 2022-2032 ($MILLION)
- FIGURE 37. COLOMBIA DISTRIBUTION SYSTEM MARKET, 2022-2032 ($MILLION)
- FIGURE 38. REST OF LATIN AMERICA DISTRIBUTION SYSTEM MARKET, 2022-2032 ($MILLION)
- FIGURE 39. SAUDI ARABIA DISTRIBUTION SYSTEM MARKET, 2022-2032 ($MILLION)
- FIGURE 40. SOUTH AFRICA DISTRIBUTION SYSTEM MARKET, 2022-2032 ($MILLION)
- FIGURE 41. UAE DISTRIBUTION SYSTEM MARKET, 2022-2032 ($MILLION)
- FIGURE 42. REST OF MIDDLE EAST AND AFRICA DISTRIBUTION SYSTEM MARKET, 2022-2032 ($MILLION)
- FIGURE 43. TOP WINNING STRATEGIES, BY YEAR
- FIGURE 44. TOP WINNING STRATEGIES, BY DEVELOPMENT
- FIGURE 45. TOP WINNING STRATEGIES, BY COMPANY
- FIGURE 46. PRODUCT MAPPING OF TOP 10 PLAYERS
- FIGURE 47. COMPETITIVE DASHBOARD
- FIGURE 48. COMPETITIVE HEATMAP: DISTRIBUTION SYSTEM MARKET
- FIGURE 49. TOP PLAYER POSITIONING, 2022

