
PUBLISHER: Allied Market Research | PRODUCT CODE: 1472239

PUBLISHER: Allied Market Research | PRODUCT CODE: 1472239
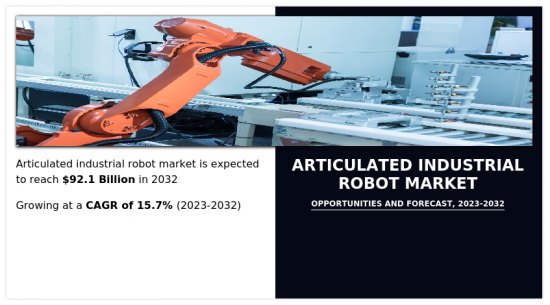
Articulated Industrial Robot Market By Application, By Robot Type, By Load Capacity : Global Opportunity Analysis and Industry Forecast, 2023-2032
Global Articulated Industrial Robot Market by Robot Type (SCARA, Delta robot, 6-Axis, and Other), by Load Capacity (below 10kg, 10kg to 100kg, and above 100kg), and by Application (Assembly, Handling, Welding, and Other): Global Opportunity Analysis and Industry Forecast, 2023-2032.
Category: Construction and Manufacturing | Sub-category: Engineering, Equipment, and Machinery| Author: Amar Chinchane & Sonia Mutreja| | Price: $5,770| No of Pages: XX | No. of Tables: XX | No. of Figures: XX|
The global Articulated Industrial Robot Market size was valued at $21,151.1 million in 2022 and is projected to reach $92,081.2 million by 2032, registering a CAGR of 15.7% from 2023 to 2032.
The articulated robot market has expanded rapidly owing to increased automation adoption and a greater demand for cost-effective, efficient manufacturing processes, specifically in automobile assembly lines. The automobile sector, a primary driver of industrial automation, is seeing a move toward incorporating sophisticated robotic technologies into assembly and manufacturing processes. The growing need for automation in automobile assembly lines is driven by the desire for greater precision, productivity, and cost effectiveness. Articulated robots, with their multi-jointed arms and programmable capabilities, provide various solutions for operations such as welding, painting, and assembling, resulting in more efficient and optimized manufacturing processes. The automobile industry's shift to automation seeks to reduce human error, enhance production speed, and maintain uniform quality.
Articulated robots, loaded with modern sensors and programming, play a critical role in achieving these goals by executing repeated operations with pinpoint accuracy and efficiency. Furthermore, the demand for cost-effective manufacturing processes is driving market expansion, as articulated robots serve to reduce labor costs, minimize material waste, and optimize overall operational expenses. The continued transformation of the automotive sector, with an emphasis on electric vehicles, smart manufacturing, and sector 4.0 concepts, is predicted to drive increasing demand for articulated robots, facilitating the shift to more flexible, interconnected, and automated production settings.
Furthermore, the automobile sector is the most popular user industry of articulated robots as it performs a wide range of jobs such as production and assembly, which include welding, cutting, and painting. Furthermore, the applications of such articulated robots play a significant role in increasing productivity, output, efficiency, and reducing energy consumption in the automobile sector. Furthermore, articulated robots have usually been utilized for monotonous and risky tasks that humans are not able to perform. Manufacturing organizations have integrated robots into their operations to increase production and improve vehicle quality. For instance, at Ford Motor Company's Sanand facility in India, over 450 robots are used to paint automobiles and perform body assembly tasks. Furthermore, Maruti Suzuki India employs 5,000 robots in one of its operations. Demand for automobiles is steadily increasing, and with increased disposable income in regions such as Asia-Pacific, the necessity for automation grows, pushing demand for articulated robots.
Furthermore, automation enables tiny U.S. enterprises to compete with well-established competitors throughout the globe. The U.S. is one of the world's largest automobile marketplaces, with more than 13 major automakers. Automotive manufacturing has been one of the country's most significant income earners in the manufacturing sector. Canada is the world's ninth largest vehicle producer, with over five heavy-duty assembly facilities, over 540 OEM parts makers, 400 dealerships, and many other automotive-related sectors.
By robot type, the 6-Axis Robot segment had the largest revenue in 2022. The versatility of articulated robots to a wide range of applications and sectors makes them useful assets in the ever-changing environment of industrial automation. Their capacity to complete jobs quickly, accurately, and consistently makes them more vital to companies seeking to boost productivity while remaining cost-effective. As technological breakthroughs increase articulated robot capabilities, such as sensor technologies, AI, and collaborative features, demand for these robotic systems is expected to rise rapidly.
The continued movement of businesses toward smart manufacturing techniques, and a growing focus on optimizing production processes, drive demand for articulated industrial robots. For Instance, In January 2022, HASCO partnered with ABB, Ltd., HASCO is a China's leading automotive component supplier. The joint venture aims to accelerate the next generation of smart manufacturing in China's automobile sector. This collaborative approach provides several benefits, the most significant of which are technical development and innovation. Companies may produce more advanced articulated robots with greater capabilities by combining friendly technology, such as sensor upgrades and collaborative features. One of the primary benefits of these collaborations is rapid innovation, in which combined resources and experience result in the development of unique solutions and better capabilities. The ensuing technical breakthroughs increase the interest of companies seeking cutting-edge robotic systems and they establish articulated robots as cutting-edge solutions for a wide range of applications.
Customization for industry-specific requirements increases the commercial attractiveness of articulated robots, specifically in the electronics industry, where accuracy in operations such as circuit board assembly is critical. Integration with artificial intelligence (AI) technology enables articulated robots to autonomously execute complicated jobs, particularly in logistics, where AI-powered robots enhance warehouse operations. The healthcare industry has high development potential owing to prospects in surgery, rehabilitation, and patient care that take advantage of articulated robots' accuracy and stability for less invasive operations.
Furthermore, embedded computers, sophisticated sensors, and microelectronics need micro- and nanoscale assembly, making labor-intensive manufacturing with low-skilled personnel unsuitable for the next generation of high-value, short-life goods. Some factory robots are large and inflexible, dangerous near people, designed to be exact and repeatable but not adaptive. To collaborate with people, robots must be adaptable to changing techniques and technological advancements. Advances in robotics and automation technology are key to achieving this goal. The next generation of high-value products, with short product life cycles, is extremely dependent on embedded computers, powerful sensors, and microelectronics that need micro- and nanoscale construction. Traditional labor-intensive manufacturing with low-skilled human workers is unsuitable for such complex operations. While some factory robots are huge and stiff, designed for accuracy and repetition, they pose safety risks when interacting with humans and lack flexibility. To interact effectively with people, robots must be adaptable enough to handle changes in procedures and increasing technical improvements in goods. As a result, advancements in robotics and automation technologies are critical to achieving this degree of flexibility.
The articulated industrial robot market is segmented on the basis of robot type, application, load capacity, and region. By robot type, the market is categorized into SCARA, Delta robot, 6-Axis, and Other. Depending on application, it is divided into assembly, handling, welding, and other. On the basis of load capacity, it is classified into below 10kg, 10kg to 100kg, and above 100kg. and Region wise, the market is analyzed across North America, Europe, Asia-Pacific, LA, and MEA.
Competition Analysis
Key companies profiled in the articulated industrial robot market include Mitsubishi Electric Automation, Inc, DENSO Robotics Incorporated, KUKA AG, Delta Electronics, Inc., Robotic Automation Systems, ABB Ltd., Omron Corporation, Kawasaki Heavy Industries, Ltd., Hirata Corporation, and Panasonic Industry Co., Ltd.
Key Benefits For Stakeholders
- This report provides a quantitative analysis of the market segments, current trends, estimations, and dynamics of the articulated industrial robot market analysis from 2022 to 2032 to identify the prevailing articulated industrial robot market opportunities.
- The market research is offered along with information related to key drivers, restraints, and opportunities.
- Porter's five forces analysis highlights the potency of buyers and suppliers to enable stakeholders make profit-oriented business decisions and strengthen their supplier-buyer network.
- In-depth analysis of the articulated industrial robot market segmentation assists to determine the prevailing market opportunities.
- Major countries in each region are mapped according to their revenue contribution to the global market.
- Market player positioning facilitates benchmarking and provides a clear understanding of the present position of the market players.
- The report includes the analysis of the regional as well as global articulated industrial robot market trends, key players, market segments, application areas, and market growth strategies.
Additional benefits you will get with this purchase are:
- Quarterly Update and* (only available with a corporate license, on listed price)
- 5 additional Company Profile of client Choice pre- or Post-purchase, as a free update.
- Free Upcoming Version on the Purchase of Five and Enterprise User License.
- 16 analyst hours of support* (post-purchase, if you find additional data requirements upon review of the report, you may receive support amounting to 16 analyst hours to solve questions, and post-sale queries)
- 15% Free Customization* (in case the scope or segment of the report does not match your requirements, 15% is equivalent to 3 working days of free work, applicable once)
- Free data Pack on the Five and Enterprise User License. (Excel version of the report)
- Free Updated report if the report is 6-12 months old or older.
- 24-hour priority response*
- Free Industry updates and white papers.
Possible Customization with this report (with additional cost and timeline, please talk to the sales executive to know more)
- Capital Investment breakdown
- End user preferences and pain points
- Investment Opportunities
- Product Life Cycles
- Supply Chain Analysis & Vendor Margins
- Technology Trend Analysis
- Consumer Preference and Product Specifications
- Market share analysis of players by products/segments
- New Product Development/ Product Matrix of Key Players
- Strategic Recommedations
- Additional company profiles with specific to client's interest
- Additional country or region analysis- market size and forecast
- Expanded list for Company Profiles
- Market share analysis of players at global/region/country level
- Volume Market Size and Forecast
Key Market Segments
By Application
- Assembly
- Other
- Handling
- Welding
By Robot Type
- SCARA Robot
- 6-Axis Robot
- Delta Robot
- Other
By Load Capacity
- Below 10kg
- 10kg to 100kg
- Above 100kg
By Region
- North America
- U.S.
- Canada
- Mexico
- Europe
- Germany
- France
- UK
- Italy
- Rest of Europe
- Asia-Pacific
- China
- Japan
- South Korea
- India
- Rest of Asia-Pacific
- Latin America
- Brazil
- Argentina
- Colombia
- Chile
- Rest of Latin America
- Middle East and Africa
- Saudi Arabia
- UAE
- Nigeria
- Egypt
- Rest Of Mea
Key Market Players:
- DENSO Robotics Incorporated
- KUKA AG
- Delta Electronics, Inc.
- Robotic Automation Systems
- ABB Ltd.
- Omron Corporation
- Kawasaki Heavy Industries, Ltd.
- HIRATA Corporation
- Mitsubishi Electric Automation, Inc
- Panasonic Industry Co., Ltd.
TABLE OF CONTENTS
CHAPTER 1: INTRODUCTION
- 1.1. Report description
- 1.2. Key market segments
- 1.3. Key benefits to the stakeholders
- 1.4. Research methodology
- 1.4.1. Primary research
- 1.4.2. Secondary research
- 1.4.3. Analyst tools and models
CHAPTER 2: EXECUTIVE SUMMARY
- 2.1. CXO perspective
CHAPTER 3: MARKET OVERVIEW
- 3.1. Market definition and scope
- 3.2. Key findings
- 3.2.1. Top impacting factors
- 3.2.2. Top investment pockets
- 3.3. Porter's five forces analysis
- 3.4. Market dynamics
- 3.4.1. Drivers
- 3.4.2. Restraints
- 3.4.3. Opportunities
CHAPTER 4: ARTICULATED INDUSTRIAL ROBOT MARKET, BY APPLICATION
- 4.1. Overview
- 4.1.1. Market size and forecast
- 4.2. Handling
- 4.2.1. Key market trends, growth factors and opportunities
- 4.2.2. Market size and forecast, by region
- 4.2.3. Market share analysis by country
- 4.3. Welding
- 4.3.1. Key market trends, growth factors and opportunities
- 4.3.2. Market size and forecast, by region
- 4.3.3. Market share analysis by country
- 4.4. Assembly
- 4.4.1. Key market trends, growth factors and opportunities
- 4.4.2. Market size and forecast, by region
- 4.4.3. Market share analysis by country
- 4.5. Other
- 4.5.1. Key market trends, growth factors and opportunities
- 4.5.2. Market size and forecast, by region
- 4.5.3. Market share analysis by country
CHAPTER 5: ARTICULATED INDUSTRIAL ROBOT MARKET, BY ROBOT TYPE
- 5.1. Overview
- 5.1.1. Market size and forecast
- 5.2. SCARA Robot
- 5.2.1. Key market trends, growth factors and opportunities
- 5.2.2. Market size and forecast, by region
- 5.2.3. Market share analysis by country
- 5.3. 6-Axis Robot
- 5.3.1. Key market trends, growth factors and opportunities
- 5.3.2. Market size and forecast, by region
- 5.3.3. Market share analysis by country
- 5.4. Delta Robot
- 5.4.1. Key market trends, growth factors and opportunities
- 5.4.2. Market size and forecast, by region
- 5.4.3. Market share analysis by country
- 5.5. Other
- 5.5.1. Key market trends, growth factors and opportunities
- 5.5.2. Market size and forecast, by region
- 5.5.3. Market share analysis by country
CHAPTER 6: ARTICULATED INDUSTRIAL ROBOT MARKET, BY LOAD CAPACITY
- 6.1. Overview
- 6.1.1. Market size and forecast
- 6.2. Below 10kg
- 6.2.1. Key market trends, growth factors and opportunities
- 6.2.2. Market size and forecast, by region
- 6.2.3. Market share analysis by country
- 6.3. 10kg to 100kg
- 6.3.1. Key market trends, growth factors and opportunities
- 6.3.2. Market size and forecast, by region
- 6.3.3. Market share analysis by country
- 6.4. Above 100kg
- 6.4.1. Key market trends, growth factors and opportunities
- 6.4.2. Market size and forecast, by region
- 6.4.3. Market share analysis by country
CHAPTER 7: ARTICULATED INDUSTRIAL ROBOT MARKET, BY REGION
- 7.1. Overview
- 7.1.1. Market size and forecast By Region
- 7.2. North America
- 7.2.1. Key market trends, growth factors and opportunities
- 7.2.2. Market size and forecast, by Application
- 7.2.3. Market size and forecast, by Robot Type
- 7.2.4. Market size and forecast, by Load Capacity
- 7.2.5. Market size and forecast, by country
- 7.2.5.1. U.S.
- 7.2.5.1.1. Market size and forecast, by Application
- 7.2.5.1.2. Market size and forecast, by Robot Type
- 7.2.5.1.3. Market size and forecast, by Load Capacity
- 7.2.5.2. Canada
- 7.2.5.2.1. Market size and forecast, by Application
- 7.2.5.2.2. Market size and forecast, by Robot Type
- 7.2.5.2.3. Market size and forecast, by Load Capacity
- 7.2.5.3. Mexico
- 7.2.5.3.1. Market size and forecast, by Application
- 7.2.5.3.2. Market size and forecast, by Robot Type
- 7.2.5.3.3. Market size and forecast, by Load Capacity
- 7.3. Europe
- 7.3.1. Key market trends, growth factors and opportunities
- 7.3.2. Market size and forecast, by Application
- 7.3.3. Market size and forecast, by Robot Type
- 7.3.4. Market size and forecast, by Load Capacity
- 7.3.5. Market size and forecast, by country
- 7.3.5.1. Germany
- 7.3.5.1.1. Market size and forecast, by Application
- 7.3.5.1.2. Market size and forecast, by Robot Type
- 7.3.5.1.3. Market size and forecast, by Load Capacity
- 7.3.5.2. France
- 7.3.5.2.1. Market size and forecast, by Application
- 7.3.5.2.2. Market size and forecast, by Robot Type
- 7.3.5.2.3. Market size and forecast, by Load Capacity
- 7.3.5.3. UK
- 7.3.5.3.1. Market size and forecast, by Application
- 7.3.5.3.2. Market size and forecast, by Robot Type
- 7.3.5.3.3. Market size and forecast, by Load Capacity
- 7.3.5.4. Italy
- 7.3.5.4.1. Market size and forecast, by Application
- 7.3.5.4.2. Market size and forecast, by Robot Type
- 7.3.5.4.3. Market size and forecast, by Load Capacity
- 7.3.5.5. Rest of Europe
- 7.3.5.5.1. Market size and forecast, by Application
- 7.3.5.5.2. Market size and forecast, by Robot Type
- 7.3.5.5.3. Market size and forecast, by Load Capacity
- 7.4. Asia-Pacific
- 7.4.1. Key market trends, growth factors and opportunities
- 7.4.2. Market size and forecast, by Application
- 7.4.3. Market size and forecast, by Robot Type
- 7.4.4. Market size and forecast, by Load Capacity
- 7.4.5. Market size and forecast, by country
- 7.4.5.1. China
- 7.4.5.1.1. Market size and forecast, by Application
- 7.4.5.1.2. Market size and forecast, by Robot Type
- 7.4.5.1.3. Market size and forecast, by Load Capacity
- 7.4.5.2. Japan
- 7.4.5.2.1. Market size and forecast, by Application
- 7.4.5.2.2. Market size and forecast, by Robot Type
- 7.4.5.2.3. Market size and forecast, by Load Capacity
- 7.4.5.3. South Korea
- 7.4.5.3.1. Market size and forecast, by Application
- 7.4.5.3.2. Market size and forecast, by Robot Type
- 7.4.5.3.3. Market size and forecast, by Load Capacity
- 7.4.5.4. India
- 7.4.5.4.1. Market size and forecast, by Application
- 7.4.5.4.2. Market size and forecast, by Robot Type
- 7.4.5.4.3. Market size and forecast, by Load Capacity
- 7.4.5.5. Rest of Asia-Pacific
- 7.4.5.5.1. Market size and forecast, by Application
- 7.4.5.5.2. Market size and forecast, by Robot Type
- 7.4.5.5.3. Market size and forecast, by Load Capacity
- 7.5. Latin America
- 7.5.1. Key market trends, growth factors and opportunities
- 7.5.2. Market size and forecast, by Application
- 7.5.3. Market size and forecast, by Robot Type
- 7.5.4. Market size and forecast, by Load Capacity
- 7.5.5. Market size and forecast, by country
- 7.5.5.1. Brazil
- 7.5.5.1.1. Market size and forecast, by Application
- 7.5.5.1.2. Market size and forecast, by Robot Type
- 7.5.5.1.3. Market size and forecast, by Load Capacity
- 7.5.5.2. Argentina
- 7.5.5.2.1. Market size and forecast, by Application
- 7.5.5.2.2. Market size and forecast, by Robot Type
- 7.5.5.2.3. Market size and forecast, by Load Capacity
- 7.5.5.3. Colombia
- 7.5.5.3.1. Market size and forecast, by Application
- 7.5.5.3.2. Market size and forecast, by Robot Type
- 7.5.5.3.3. Market size and forecast, by Load Capacity
- 7.5.5.4. Chile
- 7.5.5.4.1. Market size and forecast, by Application
- 7.5.5.4.2. Market size and forecast, by Robot Type
- 7.5.5.4.3. Market size and forecast, by Load Capacity
- 7.5.5.5. Rest of Latin America
- 7.5.5.5.1. Market size and forecast, by Application
- 7.5.5.5.2. Market size and forecast, by Robot Type
- 7.5.5.5.3. Market size and forecast, by Load Capacity
- 7.6. Middle East and Africa
- 7.6.1. Key market trends, growth factors and opportunities
- 7.6.2. Market size and forecast, by Application
- 7.6.3. Market size and forecast, by Robot Type
- 7.6.4. Market size and forecast, by Load Capacity
- 7.6.5. Market size and forecast, by country
- 7.6.5.1. Saudi Arabia
- 7.6.5.1.1. Market size and forecast, by Application
- 7.6.5.1.2. Market size and forecast, by Robot Type
- 7.6.5.1.3. Market size and forecast, by Load Capacity
- 7.6.5.2. UAE
- 7.6.5.2.1. Market size and forecast, by Application
- 7.6.5.2.2. Market size and forecast, by Robot Type
- 7.6.5.2.3. Market size and forecast, by Load Capacity
- 7.6.5.3. Nigeria
- 7.6.5.3.1. Market size and forecast, by Application
- 7.6.5.3.2. Market size and forecast, by Robot Type
- 7.6.5.3.3. Market size and forecast, by Load Capacity
- 7.6.5.4. Egypt
- 7.6.5.4.1. Market size and forecast, by Application
- 7.6.5.4.2. Market size and forecast, by Robot Type
- 7.6.5.4.3. Market size and forecast, by Load Capacity
- 7.6.5.5. Rest Of Mea
- 7.6.5.5.1. Market size and forecast, by Application
- 7.6.5.5.2. Market size and forecast, by Robot Type
- 7.6.5.5.3. Market size and forecast, by Load Capacity
CHAPTER 8: COMPETITIVE LANDSCAPE
- 8.1. Introduction
- 8.2. Top winning strategies
- 8.3. Product mapping of top 10 player
- 8.4. Competitive dashboard
- 8.5. Competitive heatmap
- 8.6. Top player positioning, 2022
CHAPTER 9: COMPANY PROFILES
- 9.1. Mitsubishi Electric Automation, Inc
- 9.1.1. Company overview
- 9.1.2. Key executives
- 9.1.3. Company snapshot
- 9.1.4. Operating business segments
- 9.1.5. Product portfolio
- 9.1.6. Business performance
- 9.1.7. Key strategic moves and developments
- 9.2. DENSO Robotics Incorporated
- 9.2.1. Company overview
- 9.2.2. Key executives
- 9.2.3. Company snapshot
- 9.2.4. Operating business segments
- 9.2.5. Product portfolio
- 9.2.6. Business performance
- 9.2.7. Key strategic moves and developments
- 9.3. KUKA AG
- 9.3.1. Company overview
- 9.3.2. Key executives
- 9.3.3. Company snapshot
- 9.3.4. Operating business segments
- 9.3.5. Product portfolio
- 9.3.6. Business performance
- 9.3.7. Key strategic moves and developments
- 9.4. Delta Electronics, Inc.
- 9.4.1. Company overview
- 9.4.2. Key executives
- 9.4.3. Company snapshot
- 9.4.4. Operating business segments
- 9.4.5. Product portfolio
- 9.4.6. Business performance
- 9.4.7. Key strategic moves and developments
- 9.5. Robotic Automation Systems
- 9.5.1. Company overview
- 9.5.2. Key executives
- 9.5.3. Company snapshot
- 9.5.4. Operating business segments
- 9.5.5. Product portfolio
- 9.5.6. Business performance
- 9.5.7. Key strategic moves and developments
- 9.6. ABB Ltd.
- 9.6.1. Company overview
- 9.6.2. Key executives
- 9.6.3. Company snapshot
- 9.6.4. Operating business segments
- 9.6.5. Product portfolio
- 9.6.6. Business performance
- 9.6.7. Key strategic moves and developments
- 9.7. Omron Corporation
- 9.7.1. Company overview
- 9.7.2. Key executives
- 9.7.3. Company snapshot
- 9.7.4. Operating business segments
- 9.7.5. Product portfolio
- 9.7.6. Business performance
- 9.7.7. Key strategic moves and developments
- 9.8. Kawasaki Heavy Industries, Ltd.
- 9.8.1. Company overview
- 9.8.2. Key executives
- 9.8.3. Company snapshot
- 9.8.4. Operating business segments
- 9.8.5. Product portfolio
- 9.8.6. Business performance
- 9.8.7. Key strategic moves and developments
- 9.9. HIRATA Corporation
- 9.9.1. Company overview
- 9.9.2. Key executives
- 9.9.3. Company snapshot
- 9.9.4. Operating business segments
- 9.9.5. Product portfolio
- 9.9.6. Business performance
- 9.9.7. Key strategic moves and developments
- 9.10. Panasonic Industry Co., Ltd.
- 9.10.1. Company overview
- 9.10.2. Key executives
- 9.10.3. Company snapshot
- 9.10.4. Operating business segments
- 9.10.5. Product portfolio
- 9.10.6. Business performance
- 9.10.7. Key strategic moves and developments
LIST OF TABLES
- TABLE 01. GLOBAL ARTICULATED INDUSTRIAL ROBOT MARKET, BY APPLICATION, 2022-2032 ($MILLION)
- TABLE 02. ARTICULATED INDUSTRIAL ROBOT MARKET FOR HANDLING, BY REGION, 2022-2032 ($MILLION)
- TABLE 03. ARTICULATED INDUSTRIAL ROBOT MARKET FOR WELDING, BY REGION, 2022-2032 ($MILLION)
- TABLE 04. ARTICULATED INDUSTRIAL ROBOT MARKET FOR ASSEMBLY, BY REGION, 2022-2032 ($MILLION)
- TABLE 05. ARTICULATED INDUSTRIAL ROBOT MARKET FOR OTHER, BY REGION, 2022-2032 ($MILLION)
- TABLE 06. GLOBAL ARTICULATED INDUSTRIAL ROBOT MARKET, BY ROBOT TYPE, 2022-2032 ($MILLION)
- TABLE 07. ARTICULATED INDUSTRIAL ROBOT MARKET FOR SCARA ROBOT, BY REGION, 2022-2032 ($MILLION)
- TABLE 08. ARTICULATED INDUSTRIAL ROBOT MARKET FOR 6-AXIS ROBOT, BY REGION, 2022-2032 ($MILLION)
- TABLE 09. ARTICULATED INDUSTRIAL ROBOT MARKET FOR DELTA ROBOT, BY REGION, 2022-2032 ($MILLION)
- TABLE 10. ARTICULATED INDUSTRIAL ROBOT MARKET FOR OTHER, BY REGION, 2022-2032 ($MILLION)
- TABLE 11. GLOBAL ARTICULATED INDUSTRIAL ROBOT MARKET, BY LOAD CAPACITY, 2022-2032 ($MILLION)
- TABLE 12. ARTICULATED INDUSTRIAL ROBOT MARKET FOR BELOW 10KG, BY REGION, 2022-2032 ($MILLION)
- TABLE 13. ARTICULATED INDUSTRIAL ROBOT MARKET FOR 10KG TO 100KG, BY REGION, 2022-2032 ($MILLION)
- TABLE 14. ARTICULATED INDUSTRIAL ROBOT MARKET FOR ABOVE 100KG, BY REGION, 2022-2032 ($MILLION)
- TABLE 15. ARTICULATED INDUSTRIAL ROBOT MARKET, BY REGION, 2022-2032 ($MILLION)
- TABLE 16. NORTH AMERICA ARTICULATED INDUSTRIAL ROBOT MARKET, BY APPLICATION, 2022-2032 ($MILLION)
- TABLE 17. NORTH AMERICA ARTICULATED INDUSTRIAL ROBOT MARKET, BY ROBOT TYPE, 2022-2032 ($MILLION)
- TABLE 18. NORTH AMERICA ARTICULATED INDUSTRIAL ROBOT MARKET, BY LOAD CAPACITY, 2022-2032 ($MILLION)
- TABLE 19. NORTH AMERICA ARTICULATED INDUSTRIAL ROBOT MARKET, BY COUNTRY, 2022-2032 ($MILLION)
- TABLE 20. U.S. ARTICULATED INDUSTRIAL ROBOT MARKET, BY APPLICATION, 2022-2032 ($MILLION)
- TABLE 21. U.S. ARTICULATED INDUSTRIAL ROBOT MARKET, BY ROBOT TYPE, 2022-2032 ($MILLION)
- TABLE 22. U.S. ARTICULATED INDUSTRIAL ROBOT MARKET, BY LOAD CAPACITY, 2022-2032 ($MILLION)
- TABLE 23. CANADA ARTICULATED INDUSTRIAL ROBOT MARKET, BY APPLICATION, 2022-2032 ($MILLION)
- TABLE 24. CANADA ARTICULATED INDUSTRIAL ROBOT MARKET, BY ROBOT TYPE, 2022-2032 ($MILLION)
- TABLE 25. CANADA ARTICULATED INDUSTRIAL ROBOT MARKET, BY LOAD CAPACITY, 2022-2032 ($MILLION)
- TABLE 26. MEXICO ARTICULATED INDUSTRIAL ROBOT MARKET, BY APPLICATION, 2022-2032 ($MILLION)
- TABLE 27. MEXICO ARTICULATED INDUSTRIAL ROBOT MARKET, BY ROBOT TYPE, 2022-2032 ($MILLION)
- TABLE 28. MEXICO ARTICULATED INDUSTRIAL ROBOT MARKET, BY LOAD CAPACITY, 2022-2032 ($MILLION)
- TABLE 29. EUROPE ARTICULATED INDUSTRIAL ROBOT MARKET, BY APPLICATION, 2022-2032 ($MILLION)
- TABLE 30. EUROPE ARTICULATED INDUSTRIAL ROBOT MARKET, BY ROBOT TYPE, 2022-2032 ($MILLION)
- TABLE 31. EUROPE ARTICULATED INDUSTRIAL ROBOT MARKET, BY LOAD CAPACITY, 2022-2032 ($MILLION)
- TABLE 32. EUROPE ARTICULATED INDUSTRIAL ROBOT MARKET, BY COUNTRY, 2022-2032 ($MILLION)
- TABLE 33. GERMANY ARTICULATED INDUSTRIAL ROBOT MARKET, BY APPLICATION, 2022-2032 ($MILLION)
- TABLE 34. GERMANY ARTICULATED INDUSTRIAL ROBOT MARKET, BY ROBOT TYPE, 2022-2032 ($MILLION)
- TABLE 35. GERMANY ARTICULATED INDUSTRIAL ROBOT MARKET, BY LOAD CAPACITY, 2022-2032 ($MILLION)
- TABLE 36. FRANCE ARTICULATED INDUSTRIAL ROBOT MARKET, BY APPLICATION, 2022-2032 ($MILLION)
- TABLE 37. FRANCE ARTICULATED INDUSTRIAL ROBOT MARKET, BY ROBOT TYPE, 2022-2032 ($MILLION)
- TABLE 38. FRANCE ARTICULATED INDUSTRIAL ROBOT MARKET, BY LOAD CAPACITY, 2022-2032 ($MILLION)
- TABLE 39. UK ARTICULATED INDUSTRIAL ROBOT MARKET, BY APPLICATION, 2022-2032 ($MILLION)
- TABLE 40. UK ARTICULATED INDUSTRIAL ROBOT MARKET, BY ROBOT TYPE, 2022-2032 ($MILLION)
- TABLE 41. UK ARTICULATED INDUSTRIAL ROBOT MARKET, BY LOAD CAPACITY, 2022-2032 ($MILLION)
- TABLE 42. ITALY ARTICULATED INDUSTRIAL ROBOT MARKET, BY APPLICATION, 2022-2032 ($MILLION)
- TABLE 43. ITALY ARTICULATED INDUSTRIAL ROBOT MARKET, BY ROBOT TYPE, 2022-2032 ($MILLION)
- TABLE 44. ITALY ARTICULATED INDUSTRIAL ROBOT MARKET, BY LOAD CAPACITY, 2022-2032 ($MILLION)
- TABLE 45. REST OF EUROPE ARTICULATED INDUSTRIAL ROBOT MARKET, BY APPLICATION, 2022-2032 ($MILLION)
- TABLE 46. REST OF EUROPE ARTICULATED INDUSTRIAL ROBOT MARKET, BY ROBOT TYPE, 2022-2032 ($MILLION)
- TABLE 47. REST OF EUROPE ARTICULATED INDUSTRIAL ROBOT MARKET, BY LOAD CAPACITY, 2022-2032 ($MILLION)
- TABLE 48. ASIA-PACIFIC ARTICULATED INDUSTRIAL ROBOT MARKET, BY APPLICATION, 2022-2032 ($MILLION)
- TABLE 49. ASIA-PACIFIC ARTICULATED INDUSTRIAL ROBOT MARKET, BY ROBOT TYPE, 2022-2032 ($MILLION)
- TABLE 50. ASIA-PACIFIC ARTICULATED INDUSTRIAL ROBOT MARKET, BY LOAD CAPACITY, 2022-2032 ($MILLION)
- TABLE 51. ASIA-PACIFIC ARTICULATED INDUSTRIAL ROBOT MARKET, BY COUNTRY, 2022-2032 ($MILLION)
- TABLE 52. CHINA ARTICULATED INDUSTRIAL ROBOT MARKET, BY APPLICATION, 2022-2032 ($MILLION)
- TABLE 53. CHINA ARTICULATED INDUSTRIAL ROBOT MARKET, BY ROBOT TYPE, 2022-2032 ($MILLION)
- TABLE 54. CHINA ARTICULATED INDUSTRIAL ROBOT MARKET, BY LOAD CAPACITY, 2022-2032 ($MILLION)
- TABLE 55. JAPAN ARTICULATED INDUSTRIAL ROBOT MARKET, BY APPLICATION, 2022-2032 ($MILLION)
- TABLE 56. JAPAN ARTICULATED INDUSTRIAL ROBOT MARKET, BY ROBOT TYPE, 2022-2032 ($MILLION)
- TABLE 57. JAPAN ARTICULATED INDUSTRIAL ROBOT MARKET, BY LOAD CAPACITY, 2022-2032 ($MILLION)
- TABLE 58. SOUTH KOREA ARTICULATED INDUSTRIAL ROBOT MARKET, BY APPLICATION, 2022-2032 ($MILLION)
- TABLE 59. SOUTH KOREA ARTICULATED INDUSTRIAL ROBOT MARKET, BY ROBOT TYPE, 2022-2032 ($MILLION)
- TABLE 60. SOUTH KOREA ARTICULATED INDUSTRIAL ROBOT MARKET, BY LOAD CAPACITY, 2022-2032 ($MILLION)
- TABLE 61. INDIA ARTICULATED INDUSTRIAL ROBOT MARKET, BY APPLICATION, 2022-2032 ($MILLION)
- TABLE 62. INDIA ARTICULATED INDUSTRIAL ROBOT MARKET, BY ROBOT TYPE, 2022-2032 ($MILLION)
- TABLE 63. INDIA ARTICULATED INDUSTRIAL ROBOT MARKET, BY LOAD CAPACITY, 2022-2032 ($MILLION)
- TABLE 64. REST OF ASIA-PACIFIC ARTICULATED INDUSTRIAL ROBOT MARKET, BY APPLICATION, 2022-2032 ($MILLION)
- TABLE 65. REST OF ASIA-PACIFIC ARTICULATED INDUSTRIAL ROBOT MARKET, BY ROBOT TYPE, 2022-2032 ($MILLION)
- TABLE 66. REST OF ASIA-PACIFIC ARTICULATED INDUSTRIAL ROBOT MARKET, BY LOAD CAPACITY, 2022-2032 ($MILLION)
- TABLE 67. LATIN AMERICA ARTICULATED INDUSTRIAL ROBOT MARKET, BY APPLICATION, 2022-2032 ($MILLION)
- TABLE 68. LATIN AMERICA ARTICULATED INDUSTRIAL ROBOT MARKET, BY ROBOT TYPE, 2022-2032 ($MILLION)
- TABLE 69. LATIN AMERICA ARTICULATED INDUSTRIAL ROBOT MARKET, BY LOAD CAPACITY, 2022-2032 ($MILLION)
- TABLE 70. LATIN AMERICA ARTICULATED INDUSTRIAL ROBOT MARKET, BY COUNTRY, 2022-2032 ($MILLION)
- TABLE 71. BRAZIL ARTICULATED INDUSTRIAL ROBOT MARKET, BY APPLICATION, 2022-2032 ($MILLION)
- TABLE 72. BRAZIL ARTICULATED INDUSTRIAL ROBOT MARKET, BY ROBOT TYPE, 2022-2032 ($MILLION)
- TABLE 73. BRAZIL ARTICULATED INDUSTRIAL ROBOT MARKET, BY LOAD CAPACITY, 2022-2032 ($MILLION)
- TABLE 74. ARGENTINA ARTICULATED INDUSTRIAL ROBOT MARKET, BY APPLICATION, 2022-2032 ($MILLION)
- TABLE 75. ARGENTINA ARTICULATED INDUSTRIAL ROBOT MARKET, BY ROBOT TYPE, 2022-2032 ($MILLION)
- TABLE 76. ARGENTINA ARTICULATED INDUSTRIAL ROBOT MARKET, BY LOAD CAPACITY, 2022-2032 ($MILLION)
- TABLE 77. COLOMBIA ARTICULATED INDUSTRIAL ROBOT MARKET, BY APPLICATION, 2022-2032 ($MILLION)
- TABLE 78. COLOMBIA ARTICULATED INDUSTRIAL ROBOT MARKET, BY ROBOT TYPE, 2022-2032 ($MILLION)
- TABLE 79. COLOMBIA ARTICULATED INDUSTRIAL ROBOT MARKET, BY LOAD CAPACITY, 2022-2032 ($MILLION)
- TABLE 80. CHILE ARTICULATED INDUSTRIAL ROBOT MARKET, BY APPLICATION, 2022-2032 ($MILLION)
- TABLE 81. CHILE ARTICULATED INDUSTRIAL ROBOT MARKET, BY ROBOT TYPE, 2022-2032 ($MILLION)
- TABLE 82. CHILE ARTICULATED INDUSTRIAL ROBOT MARKET, BY LOAD CAPACITY, 2022-2032 ($MILLION)
- TABLE 83. REST OF LATIN AMERICA ARTICULATED INDUSTRIAL ROBOT MARKET, BY APPLICATION, 2022-2032 ($MILLION)
- TABLE 84. REST OF LATIN AMERICA ARTICULATED INDUSTRIAL ROBOT MARKET, BY ROBOT TYPE, 2022-2032 ($MILLION)
- TABLE 85. REST OF LATIN AMERICA ARTICULATED INDUSTRIAL ROBOT MARKET, BY LOAD CAPACITY, 2022-2032 ($MILLION)
- TABLE 86. MIDDLE EAST AND AFRICA ARTICULATED INDUSTRIAL ROBOT MARKET, BY APPLICATION, 2022-2032 ($MILLION)
- TABLE 87. MIDDLE EAST AND AFRICA ARTICULATED INDUSTRIAL ROBOT MARKET, BY ROBOT TYPE, 2022-2032 ($MILLION)
- TABLE 88. MIDDLE EAST AND AFRICA ARTICULATED INDUSTRIAL ROBOT MARKET, BY LOAD CAPACITY, 2022-2032 ($MILLION)
- TABLE 89. MIDDLE EAST AND AFRICA ARTICULATED INDUSTRIAL ROBOT MARKET, BY COUNTRY, 2022-2032 ($MILLION)
- TABLE 90. SAUDI ARABIA ARTICULATED INDUSTRIAL ROBOT MARKET, BY APPLICATION, 2022-2032 ($MILLION)
- TABLE 91. SAUDI ARABIA ARTICULATED INDUSTRIAL ROBOT MARKET, BY ROBOT TYPE, 2022-2032 ($MILLION)
- TABLE 92. SAUDI ARABIA ARTICULATED INDUSTRIAL ROBOT MARKET, BY LOAD CAPACITY, 2022-2032 ($MILLION)
- TABLE 93. UAE ARTICULATED INDUSTRIAL ROBOT MARKET, BY APPLICATION, 2022-2032 ($MILLION)
- TABLE 94. UAE ARTICULATED INDUSTRIAL ROBOT MARKET, BY ROBOT TYPE, 2022-2032 ($MILLION)
- TABLE 95. UAE ARTICULATED INDUSTRIAL ROBOT MARKET, BY LOAD CAPACITY, 2022-2032 ($MILLION)
- TABLE 96. NIGERIA ARTICULATED INDUSTRIAL ROBOT MARKET, BY APPLICATION, 2022-2032 ($MILLION)
- TABLE 97. NIGERIA ARTICULATED INDUSTRIAL ROBOT MARKET, BY ROBOT TYPE, 2022-2032 ($MILLION)
- TABLE 98. NIGERIA ARTICULATED INDUSTRIAL ROBOT MARKET, BY LOAD CAPACITY, 2022-2032 ($MILLION)
- TABLE 99. EGYPT ARTICULATED INDUSTRIAL ROBOT MARKET, BY APPLICATION, 2022-2032 ($MILLION)
- TABLE 100. EGYPT ARTICULATED INDUSTRIAL ROBOT MARKET, BY ROBOT TYPE, 2022-2032 ($MILLION)
- TABLE 101. EGYPT ARTICULATED INDUSTRIAL ROBOT MARKET, BY LOAD CAPACITY, 2022-2032 ($MILLION)
- TABLE 102. REST OF MEA ARTICULATED INDUSTRIAL ROBOT MARKET, BY APPLICATION, 2022-2032 ($MILLION)
- TABLE 103. REST OF MEA ARTICULATED INDUSTRIAL ROBOT MARKET, BY ROBOT TYPE, 2022-2032 ($MILLION)
- TABLE 104. REST OF MEA ARTICULATED INDUSTRIAL ROBOT MARKET, BY LOAD CAPACITY, 2022-2032 ($MILLION)
- TABLE 105. MITSUBISHI ELECTRIC AUTOMATION, INC: KEY EXECUTIVES
- TABLE 106. MITSUBISHI ELECTRIC AUTOMATION, INC: COMPANY SNAPSHOT
- TABLE 107. MITSUBISHI ELECTRIC AUTOMATION, INC: PRODUCT SEGMENTS
- TABLE 108. MITSUBISHI ELECTRIC AUTOMATION, INC: SERVICE SEGMENTS
- TABLE 109. MITSUBISHI ELECTRIC AUTOMATION, INC: PRODUCT PORTFOLIO
- TABLE 110. MITSUBISHI ELECTRIC AUTOMATION, INC: KEY STRATERGIES
- TABLE 111. DENSO ROBOTICS INCORPORATED: KEY EXECUTIVES
- TABLE 112. DENSO ROBOTICS INCORPORATED: COMPANY SNAPSHOT
- TABLE 113. DENSO ROBOTICS INCORPORATED: PRODUCT SEGMENTS
- TABLE 114. DENSO ROBOTICS INCORPORATED: SERVICE SEGMENTS
- TABLE 115. DENSO ROBOTICS INCORPORATED: PRODUCT PORTFOLIO
- TABLE 116. DENSO ROBOTICS INCORPORATED: KEY STRATERGIES
- TABLE 117. KUKA AG: KEY EXECUTIVES
- TABLE 118. KUKA AG: COMPANY SNAPSHOT
- TABLE 119. KUKA AG: PRODUCT SEGMENTS
- TABLE 120. KUKA AG: SERVICE SEGMENTS
- TABLE 121. KUKA AG: PRODUCT PORTFOLIO
- TABLE 122. KUKA AG: KEY STRATERGIES
- TABLE 123. DELTA ELECTRONICS, INC.: KEY EXECUTIVES
- TABLE 124. DELTA ELECTRONICS, INC.: COMPANY SNAPSHOT
- TABLE 125. DELTA ELECTRONICS, INC.: PRODUCT SEGMENTS
- TABLE 126. DELTA ELECTRONICS, INC.: SERVICE SEGMENTS
- TABLE 127. DELTA ELECTRONICS, INC.: PRODUCT PORTFOLIO
- TABLE 128. DELTA ELECTRONICS, INC.: KEY STRATERGIES
- TABLE 129. ROBOTIC AUTOMATION SYSTEMS: KEY EXECUTIVES
- TABLE 130. ROBOTIC AUTOMATION SYSTEMS: COMPANY SNAPSHOT
- TABLE 131. ROBOTIC AUTOMATION SYSTEMS: PRODUCT SEGMENTS
- TABLE 132. ROBOTIC AUTOMATION SYSTEMS: SERVICE SEGMENTS
- TABLE 133. ROBOTIC AUTOMATION SYSTEMS: PRODUCT PORTFOLIO
- TABLE 134. ROBOTIC AUTOMATION SYSTEMS: KEY STRATERGIES
- TABLE 135. ABB LTD.: KEY EXECUTIVES
- TABLE 136. ABB LTD.: COMPANY SNAPSHOT
- TABLE 137. ABB LTD.: PRODUCT SEGMENTS
- TABLE 138. ABB LTD.: SERVICE SEGMENTS
- TABLE 139. ABB LTD.: PRODUCT PORTFOLIO
- TABLE 140. ABB LTD.: KEY STRATERGIES
- TABLE 141. OMRON CORPORATION: KEY EXECUTIVES
- TABLE 142. OMRON CORPORATION: COMPANY SNAPSHOT
- TABLE 143. OMRON CORPORATION: PRODUCT SEGMENTS
- TABLE 144. OMRON CORPORATION: SERVICE SEGMENTS
- TABLE 145. OMRON CORPORATION: PRODUCT PORTFOLIO
- TABLE 146. OMRON CORPORATION: KEY STRATERGIES
- TABLE 147. KAWASAKI HEAVY INDUSTRIES, LTD.: KEY EXECUTIVES
- TABLE 148. KAWASAKI HEAVY INDUSTRIES, LTD.: COMPANY SNAPSHOT
- TABLE 149. KAWASAKI HEAVY INDUSTRIES, LTD.: PRODUCT SEGMENTS
- TABLE 150. KAWASAKI HEAVY INDUSTRIES, LTD.: SERVICE SEGMENTS
- TABLE 151. KAWASAKI HEAVY INDUSTRIES, LTD.: PRODUCT PORTFOLIO
- TABLE 152. KAWASAKI HEAVY INDUSTRIES, LTD.: KEY STRATERGIES
- TABLE 153. HIRATA CORPORATION: KEY EXECUTIVES
- TABLE 154. HIRATA CORPORATION: COMPANY SNAPSHOT
- TABLE 155. HIRATA CORPORATION: PRODUCT SEGMENTS
- TABLE 156. HIRATA CORPORATION: SERVICE SEGMENTS
- TABLE 157. HIRATA CORPORATION: PRODUCT PORTFOLIO
- TABLE 158. HIRATA CORPORATION: KEY STRATERGIES
- TABLE 159. PANASONIC INDUSTRY CO., LTD.: KEY EXECUTIVES
- TABLE 160. PANASONIC INDUSTRY CO., LTD.: COMPANY SNAPSHOT
- TABLE 161. PANASONIC INDUSTRY CO., LTD.: PRODUCT SEGMENTS
- TABLE 162. PANASONIC INDUSTRY CO., LTD.: SERVICE SEGMENTS
- TABLE 163. PANASONIC INDUSTRY CO., LTD.: PRODUCT PORTFOLIO
- TABLE 164. PANASONIC INDUSTRY CO., LTD.: KEY STRATERGIES
LIST OF FIGURES
- FIGURE 01. ARTICULATED INDUSTRIAL ROBOT MARKET, 2022-2032
- FIGURE 02. SEGMENTATION OF ARTICULATED INDUSTRIAL ROBOT MARKET,2022-2032
- FIGURE 03. TOP IMPACTING FACTORS IN ARTICULATED INDUSTRIAL ROBOT MARKET
- FIGURE 04. TOP INVESTMENT POCKETS IN ARTICULATED INDUSTRIAL ROBOT MARKET (2023-2032)
- FIGURE 05. BARGAINING POWER OF SUPPLIERS
- FIGURE 06. BARGAINING POWER OF BUYERS
- FIGURE 07. THREAT OF SUBSTITUTION
- FIGURE 08. THREAT OF SUBSTITUTION
- FIGURE 09. COMPETITIVE RIVALRY
- FIGURE 10. GLOBAL ARTICULATED INDUSTRIAL ROBOT MARKET:DRIVERS, RESTRAINTS AND OPPORTUNITIES
- FIGURE 11. ARTICULATED INDUSTRIAL ROBOT MARKET, BY APPLICATION, 2022 AND 2032(%)
- FIGURE 12. COMPARATIVE SHARE ANALYSIS OF ARTICULATED INDUSTRIAL ROBOT MARKET FOR HANDLING, BY COUNTRY 2022 AND 2032(%)
- FIGURE 13. COMPARATIVE SHARE ANALYSIS OF ARTICULATED INDUSTRIAL ROBOT MARKET FOR WELDING, BY COUNTRY 2022 AND 2032(%)
- FIGURE 14. COMPARATIVE SHARE ANALYSIS OF ARTICULATED INDUSTRIAL ROBOT MARKET FOR ASSEMBLY, BY COUNTRY 2022 AND 2032(%)
- FIGURE 15. COMPARATIVE SHARE ANALYSIS OF ARTICULATED INDUSTRIAL ROBOT MARKET FOR OTHER, BY COUNTRY 2022 AND 2032(%)
- FIGURE 16. ARTICULATED INDUSTRIAL ROBOT MARKET, BY ROBOT TYPE, 2022 AND 2032(%)
- FIGURE 17. COMPARATIVE SHARE ANALYSIS OF ARTICULATED INDUSTRIAL ROBOT MARKET FOR SCARA ROBOT, BY COUNTRY 2022 AND 2032(%)
- FIGURE 18. COMPARATIVE SHARE ANALYSIS OF ARTICULATED INDUSTRIAL ROBOT MARKET FOR 6-AXIS ROBOT, BY COUNTRY 2022 AND 2032(%)
- FIGURE 19. COMPARATIVE SHARE ANALYSIS OF ARTICULATED INDUSTRIAL ROBOT MARKET FOR DELTA ROBOT, BY COUNTRY 2022 AND 2032(%)
- FIGURE 20. COMPARATIVE SHARE ANALYSIS OF ARTICULATED INDUSTRIAL ROBOT MARKET FOR OTHER, BY COUNTRY 2022 AND 2032(%)
- FIGURE 21. ARTICULATED INDUSTRIAL ROBOT MARKET, BY LOAD CAPACITY, 2022 AND 2032(%)
- FIGURE 22. COMPARATIVE SHARE ANALYSIS OF ARTICULATED INDUSTRIAL ROBOT MARKET FOR BELOW 10KG, BY COUNTRY 2022 AND 2032(%)
- FIGURE 23. COMPARATIVE SHARE ANALYSIS OF ARTICULATED INDUSTRIAL ROBOT MARKET FOR 10KG TO 100KG, BY COUNTRY 2022 AND 2032(%)
- FIGURE 24. COMPARATIVE SHARE ANALYSIS OF ARTICULATED INDUSTRIAL ROBOT MARKET FOR ABOVE 100KG, BY COUNTRY 2022 AND 2032(%)
- FIGURE 25. ARTICULATED INDUSTRIAL ROBOT MARKET BY REGION, 2022 AND 2032(%)
- FIGURE 26. U.S. ARTICULATED INDUSTRIAL ROBOT MARKET, 2022-2032 ($MILLION)
- FIGURE 27. CANADA ARTICULATED INDUSTRIAL ROBOT MARKET, 2022-2032 ($MILLION)
- FIGURE 28. MEXICO ARTICULATED INDUSTRIAL ROBOT MARKET, 2022-2032 ($MILLION)
- FIGURE 29. GERMANY ARTICULATED INDUSTRIAL ROBOT MARKET, 2022-2032 ($MILLION)
- FIGURE 30. FRANCE ARTICULATED INDUSTRIAL ROBOT MARKET, 2022-2032 ($MILLION)
- FIGURE 31. UK ARTICULATED INDUSTRIAL ROBOT MARKET, 2022-2032 ($MILLION)
- FIGURE 32. ITALY ARTICULATED INDUSTRIAL ROBOT MARKET, 2022-2032 ($MILLION)
- FIGURE 33. REST OF EUROPE ARTICULATED INDUSTRIAL ROBOT MARKET, 2022-2032 ($MILLION)
- FIGURE 34. CHINA ARTICULATED INDUSTRIAL ROBOT MARKET, 2022-2032 ($MILLION)
- FIGURE 35. JAPAN ARTICULATED INDUSTRIAL ROBOT MARKET, 2022-2032 ($MILLION)
- FIGURE 36. SOUTH KOREA ARTICULATED INDUSTRIAL ROBOT MARKET, 2022-2032 ($MILLION)
- FIGURE 37. INDIA ARTICULATED INDUSTRIAL ROBOT MARKET, 2022-2032 ($MILLION)
- FIGURE 38. REST OF ASIA-PACIFIC ARTICULATED INDUSTRIAL ROBOT MARKET, 2022-2032 ($MILLION)
- FIGURE 39. BRAZIL ARTICULATED INDUSTRIAL ROBOT MARKET, 2022-2032 ($MILLION)
- FIGURE 40. ARGENTINA ARTICULATED INDUSTRIAL ROBOT MARKET, 2022-2032 ($MILLION)
- FIGURE 41. COLOMBIA ARTICULATED INDUSTRIAL ROBOT MARKET, 2022-2032 ($MILLION)
- FIGURE 42. CHILE ARTICULATED INDUSTRIAL ROBOT MARKET, 2022-2032 ($MILLION)
- FIGURE 43. REST OF LATIN AMERICA ARTICULATED INDUSTRIAL ROBOT MARKET, 2022-2032 ($MILLION)
- FIGURE 44. SAUDI ARABIA ARTICULATED INDUSTRIAL ROBOT MARKET, 2022-2032 ($MILLION)
- FIGURE 45. UAE ARTICULATED INDUSTRIAL ROBOT MARKET, 2022-2032 ($MILLION)
- FIGURE 46. NIGERIA ARTICULATED INDUSTRIAL ROBOT MARKET, 2022-2032 ($MILLION)
- FIGURE 47. EGYPT ARTICULATED INDUSTRIAL ROBOT MARKET, 2022-2032 ($MILLION)
- FIGURE 48. REST OF MEA ARTICULATED INDUSTRIAL ROBOT MARKET, 2022-2032 ($MILLION)
- FIGURE 49. TOP WINNING STRATEGIES, BY YEAR
- FIGURE 50. TOP WINNING STRATEGIES, BY DEVELOPMENT
- FIGURE 51. TOP WINNING STRATEGIES, BY COMPANY
- FIGURE 52. PRODUCT MAPPING OF TOP 10 PLAYERS
- FIGURE 53. COMPETITIVE DASHBOARD
- FIGURE 54. COMPETITIVE HEATMAP: ARTICULATED INDUSTRIAL ROBOT MARKET
- FIGURE 55. TOP PLAYER POSITIONING, 2022

