
PUBLISHER: Allied Market Research | PRODUCT CODE: 1472251

PUBLISHER: Allied Market Research | PRODUCT CODE: 1472251
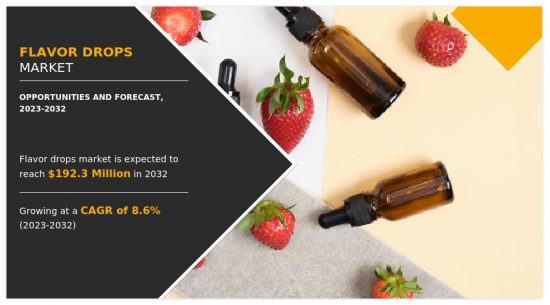
Flavor Drops Market By Flavor Type (Fruit, Tea-Coffee, Chocolate, Lemon, Vanilla, Others), By Content Type (Regular, Sugar Free), By Nature (Organic, Conventional): Global Opportunity Analysis and Industry Forecast, 2023-2032
The global flavor drops market was valued at $86.4 million in 2022, and is projected to reach $192.3 million by 2032, registering a CAGR of 8.6% from 2023 to 2032.
Flavor drops are concentrated liquid flavorings designed to enhance the taste and aroma of food and beverages. It is packed in small, portable containers with dropper or nozzle dispensers that offer a convenient way to add flavor to various culinary creations. Flavor drops come in a wide range of flavors, from classic options such as fruit and vanilla to more exotic or gourmet combinations. Whether used to flavor water, coffee, tea, or baked goods, flavor drops provide consumers with the flexibility to customize their food and beverage experiences according to their individual preferences. Their versatility and ease of use make them a popular choice for those seeking to boost the taste of their favorite dishes and drinks effortlessly.
The convenience and portable nature of flavor drop products have become key drivers in surging the flavor drops market demand. In today's fast-paced lifestyle, consumers seek products that seamlessly integrate into their on-the-go routines. Flavor drops offer a practical solution, enabling individuals to enhance the taste of their beverages or snacks as per their requirement. The compact size and easy-to-use packaging make flavor drops incredibly convenient for use at work, while traveling, or during outdoor activities. This accessibility aligns perfectly with the need of modern consumer for products that fit into their busy schedules without sacrificing flavor or quality.
Moreover, the portability of flavor drops opens new opportunities for consumers in terms of experimentation and customization. Consumers can easily carry a variety of flavors to suit different moods or occasions, allowing for personalized flavor experiences throughout the day. As a result, the convenience and portability of flavor drops meet the demand for on-the-go solutions and simultaneously contribute to the market growth by providing consumers with a convenient way to enhance their food and beverage consumption habits.
However, limited consumer awareness regarding the availability and benefits of flavor drops acts as a significant constraint on market demand for flavor drops. Many consumers are unaware of the existence of flavor drops or the wide range of applications they offer in enhancing the flavor of food and beverages. The lack of awareness leads to a missed opportunity for flavor drop manufacturers to tap into potential market segments. In addition, without a clear understanding of the benefits and versatility of flavor drops, consumers may opt for traditional flavoring methods or products, thereby hindering the adoption of flavor drops.
Furthermore, the lack of awareness about the benefits of flavor drops results in a slower adoption rate among consumers, especially those who prioritize convenience and flavor enhancement in their consumption habits. Without adequate education and promotion efforts, consumers may perceive flavor drops as niche or unfamiliar products, leading to unwillingness in trying them out. Limited awareness also affects the perception of value associated with flavor drops, as consumers may not fully grasp the potential benefits they offer in terms of flavor customization, reduced sugar intake, or calorie control, which is thus anticipated to hamper the flavor drops market growth.
Strategic partnerships with health and wellness brands present many opportunities in the flavor drops market by promoting their use as part of a healthy lifestyle. Collaborating with established brands in the health and wellness industry allows flavor drop manufacturers to leverage their credibility and reach a wider audience of health-conscious consumers. So, by aligning flavor drops with the values and objectives of health-focused brands, manufacturers have started positioning their products as essential components of a balanced diet and active lifestyle. The association with health and wellness brands helps to enhance the perceived health benefits of flavor drops, encouraging consumers to incorporate them into their daily routines.
Moreover, partnerships with health and wellness brands provide flavor drop manufacturers with access to valuable resources and expertise. Thus, by collaborating with brands that specialize in nutrition, fitness, or wellness, manufacturers are expected to gain insights into consumer trends, preferences, and emerging market opportunities. The vast knowledge of these wellness brands enables flavor drop manufacturers to develop targeted marketing strategies and product innovations that resonate with health-conscious consumers. In addition, partnering with influential figures or experts in the health and wellness space can help to further promote the use of flavor drops and build trust among consumers. Overall, strategic partnerships with health and wellness brands offer a mutually beneficial opportunity for flavor drop manufacturers to expand their market presence and establish themselves as key players in the health and wellness industry.
The flavor drops market is analyzed on the basis of flavor type, content type, nature, and region. By flavor type, the market is segmented into fruit, tea/coffee, chocolate, lemon, vanilla, and others. By content type, the market is divided into regular and sugar free. Depending on nature, it is classified into organic and conventional. Region-wise, the market is analyzed across North America (the U.S., Canada, and Mexico), Europe (Germany, the UK, France, Italy, Spain, and the rest of Europe), Asia-Pacific (China, India, Japan, South Korea, Australia, ASEAN, and the rest of Asia-Pacific), Latin America (Brazil, Colombia, Argentina, and the rest of Latin America), and Middle East and Africa (GCC, South Africa, and the rest of MEA).
The major players operating in the global flavor drops market are Beyond Water, Flavorah, Flavor West Manufacturing LLC., GymBeam, One on One Flavors, Prozis, SodaStream Inc., LorAnn Oils, Capella Flavors, Inc., and My Protein.
Key Benefits For Stakeholders
- This report provides a quantitative analysis of the market segments, current trends, estimations, and dynamics of the flavor drops market analysis from 2022 to 2032 to identify the prevailing flavor drops market opportunities.
- The market research is offered along with information related to key drivers, restraints, and opportunities.
- Porter's five forces analysis highlights the potency of buyers and suppliers to enable stakeholders make profit-oriented business decisions and strengthen their supplier-buyer network.
- In-depth analysis of the flavor drops market segmentation assists to determine the prevailing market opportunities.
- Major countries in each region are mapped according to their revenue contribution to the global market.
- Market player positioning facilitates benchmarking and provides a clear understanding of the present position of the market players.
- The report includes the analysis of the regional as well as global flavor drops market trends, key players, market segments, application areas, and market growth strategies.
Additional benefits you will get with this purchase are:
- Quarterly Update and* (only available with a corporate license, on listed price)
- 5 additional Company Profile of client Choice pre- or Post-purchase, as a free update.
- Free Upcoming Version on the Purchase of Five and Enterprise User License.
- 16 analyst hours of support* (post-purchase, if you find additional data requirements upon review of the report, you may receive support amounting to 16 analyst hours to solve questions, and post-sale queries)
- 15% Free Customization* (in case the scope or segment of the report does not match your requirements, 15% is equivalent to 3 working days of free work, applicable once)
- Free data Pack on the Five and Enterprise User License. (Excel version of the report)
- Free Updated report if the report is 6-12 months old or older.
- 24-hour priority response*
- Free Industry updates and white papers.
Possible Customization with this report (with additional cost and timeline, please talk to the sales executive to know more)
- Analysis of raw material in a product (by %)
- Investment Opportunities
- Product Life Cycles
- Supply Chain Analysis & Vendor Margins
- Regulatory Guidelines
- Additional company profiles with specific to client's interest
- Additional country or region analysis- market size and forecast
- Brands Share Analysis
- Expanded list for Company Profiles
- Historic market data
- Key player details (including location, contact details, supplier/vendor network etc. in excel format)
- SWOT Analysis
Key Market Segments
By Content Type
- Regular
- Sugar Free
By Nature
- Organic
- Conventional
By Flavor Type
- Fruit
- Tea-Coffee
- Chocolate
- Lemon
- Vanilla
- Others
By Region
- North America
- U.S.
- Canada
- Mexico
- Europe
- Germany
- UK
- France
- Italy
- Spain
- Rest of Europe
- Asia-Pacific
- China
- India
- Japan
- South Korea
- Australia
- Asean
- Rest of Asia-Pacific
- Latin America
- Brazil
- Colombia
- Argentina
- Rest of Latin America
- Middle East and Africa
- Gcc
- South Africa
- Rest of Middle East And Africa
Key Market Players:
- Beyond Water
- Flavorah
- Flavor West Manufacturing LLC.
- GymBeam
- One on One Flavors
- Prozis
- SodaStream Inc.
- LorAnn Oils
- Capella Flavors, Inc.
- My Protein
TABLE OF CONTENTS
CHAPTER 1: INTRODUCTION
- 1.1. Report description
- 1.2. Key market segments
- 1.3. Key benefits to the stakeholders
- 1.4. Research methodology
- 1.4.1. Primary research
- 1.4.2. Secondary research
- 1.4.3. Analyst tools and models
CHAPTER 2: EXECUTIVE SUMMARY
- 2.1. CXO perspective
CHAPTER 3: MARKET OVERVIEW
- 3.1. Market definition and scope
- 3.2. Key findings
- 3.2.1. Top impacting factors
- 3.2.2. Top investment pockets
- 3.3. Porter's five forces analysis
- 3.4. Market dynamics
- 3.4.1. Drivers
- 3.4.2. Restraints
- 3.4.3. Opportunities
CHAPTER 4: FLAVOR DROPS MARKET, BY FLAVOR TYPE
- 4.1. Overview
- 4.1.1. Market size and forecast
- 4.2. Fruit
- 4.2.1. Key market trends, growth factors and opportunities
- 4.2.2. Market size and forecast, by region
- 4.2.3. Market share analysis by country
- 4.3. Tea-Coffee
- 4.3.1. Key market trends, growth factors and opportunities
- 4.3.2. Market size and forecast, by region
- 4.3.3. Market share analysis by country
- 4.4. Chocolate
- 4.4.1. Key market trends, growth factors and opportunities
- 4.4.2. Market size and forecast, by region
- 4.4.3. Market share analysis by country
- 4.5. Lemon
- 4.5.1. Key market trends, growth factors and opportunities
- 4.5.2. Market size and forecast, by region
- 4.5.3. Market share analysis by country
- 4.6. Vanilla
- 4.6.1. Key market trends, growth factors and opportunities
- 4.6.2. Market size and forecast, by region
- 4.6.3. Market share analysis by country
- 4.7. Others
- 4.7.1. Key market trends, growth factors and opportunities
- 4.7.2. Market size and forecast, by region
- 4.7.3. Market share analysis by country
CHAPTER 5: FLAVOR DROPS MARKET, BY CONTENT TYPE
- 5.1. Overview
- 5.1.1. Market size and forecast
- 5.2. Regular
- 5.2.1. Key market trends, growth factors and opportunities
- 5.2.2. Market size and forecast, by region
- 5.2.3. Market share analysis by country
- 5.3. Sugar Free
- 5.3.1. Key market trends, growth factors and opportunities
- 5.3.2. Market size and forecast, by region
- 5.3.3. Market share analysis by country
CHAPTER 6: FLAVOR DROPS MARKET, BY NATURE
- 6.1. Overview
- 6.1.1. Market size and forecast
- 6.2. Organic
- 6.2.1. Key market trends, growth factors and opportunities
- 6.2.2. Market size and forecast, by region
- 6.2.3. Market share analysis by country
- 6.3. Conventional
- 6.3.1. Key market trends, growth factors and opportunities
- 6.3.2. Market size and forecast, by region
- 6.3.3. Market share analysis by country
CHAPTER 7: FLAVOR DROPS MARKET, BY REGION
- 7.1. Overview
- 7.1.1. Market size and forecast By Region
- 7.2. North America
- 7.2.1. Key market trends, growth factors and opportunities
- 7.2.2. Market size and forecast, by Flavor Type
- 7.2.3. Market size and forecast, by Content Type
- 7.2.4. Market size and forecast, by Nature
- 7.2.5. Market size and forecast, by country
- 7.2.5.1. U.S.
- 7.2.5.1.1. Market size and forecast, by Flavor Type
- 7.2.5.1.2. Market size and forecast, by Content Type
- 7.2.5.1.3. Market size and forecast, by Nature
- 7.2.5.2. Canada
- 7.2.5.2.1. Market size and forecast, by Flavor Type
- 7.2.5.2.2. Market size and forecast, by Content Type
- 7.2.5.2.3. Market size and forecast, by Nature
- 7.2.5.3. Mexico
- 7.2.5.3.1. Market size and forecast, by Flavor Type
- 7.2.5.3.2. Market size and forecast, by Content Type
- 7.2.5.3.3. Market size and forecast, by Nature
- 7.3. Europe
- 7.3.1. Key market trends, growth factors and opportunities
- 7.3.2. Market size and forecast, by Flavor Type
- 7.3.3. Market size and forecast, by Content Type
- 7.3.4. Market size and forecast, by Nature
- 7.3.5. Market size and forecast, by country
- 7.3.5.1. Germany
- 7.3.5.1.1. Market size and forecast, by Flavor Type
- 7.3.5.1.2. Market size and forecast, by Content Type
- 7.3.5.1.3. Market size and forecast, by Nature
- 7.3.5.2. UK
- 7.3.5.2.1. Market size and forecast, by Flavor Type
- 7.3.5.2.2. Market size and forecast, by Content Type
- 7.3.5.2.3. Market size and forecast, by Nature
- 7.3.5.3. France
- 7.3.5.3.1. Market size and forecast, by Flavor Type
- 7.3.5.3.2. Market size and forecast, by Content Type
- 7.3.5.3.3. Market size and forecast, by Nature
- 7.3.5.4. Italy
- 7.3.5.4.1. Market size and forecast, by Flavor Type
- 7.3.5.4.2. Market size and forecast, by Content Type
- 7.3.5.4.3. Market size and forecast, by Nature
- 7.3.5.5. Spain
- 7.3.5.5.1. Market size and forecast, by Flavor Type
- 7.3.5.5.2. Market size and forecast, by Content Type
- 7.3.5.5.3. Market size and forecast, by Nature
- 7.3.5.6. Rest of Europe
- 7.3.5.6.1. Market size and forecast, by Flavor Type
- 7.3.5.6.2. Market size and forecast, by Content Type
- 7.3.5.6.3. Market size and forecast, by Nature
- 7.4. Asia-Pacific
- 7.4.1. Key market trends, growth factors and opportunities
- 7.4.2. Market size and forecast, by Flavor Type
- 7.4.3. Market size and forecast, by Content Type
- 7.4.4. Market size and forecast, by Nature
- 7.4.5. Market size and forecast, by country
- 7.4.5.1. China
- 7.4.5.1.1. Market size and forecast, by Flavor Type
- 7.4.5.1.2. Market size and forecast, by Content Type
- 7.4.5.1.3. Market size and forecast, by Nature
- 7.4.5.2. India
- 7.4.5.2.1. Market size and forecast, by Flavor Type
- 7.4.5.2.2. Market size and forecast, by Content Type
- 7.4.5.2.3. Market size and forecast, by Nature
- 7.4.5.3. Japan
- 7.4.5.3.1. Market size and forecast, by Flavor Type
- 7.4.5.3.2. Market size and forecast, by Content Type
- 7.4.5.3.3. Market size and forecast, by Nature
- 7.4.5.4. South Korea
- 7.4.5.4.1. Market size and forecast, by Flavor Type
- 7.4.5.4.2. Market size and forecast, by Content Type
- 7.4.5.4.3. Market size and forecast, by Nature
- 7.4.5.5. Australia
- 7.4.5.5.1. Market size and forecast, by Flavor Type
- 7.4.5.5.2. Market size and forecast, by Content Type
- 7.4.5.5.3. Market size and forecast, by Nature
- 7.4.5.6. Asean
- 7.4.5.6.1. Market size and forecast, by Flavor Type
- 7.4.5.6.2. Market size and forecast, by Content Type
- 7.4.5.6.3. Market size and forecast, by Nature
- 7.4.5.7. Rest of Asia-Pacific
- 7.4.5.7.1. Market size and forecast, by Flavor Type
- 7.4.5.7.2. Market size and forecast, by Content Type
- 7.4.5.7.3. Market size and forecast, by Nature
- 7.5. Latin America
- 7.5.1. Key market trends, growth factors and opportunities
- 7.5.2. Market size and forecast, by Flavor Type
- 7.5.3. Market size and forecast, by Content Type
- 7.5.4. Market size and forecast, by Nature
- 7.5.5. Market size and forecast, by country
- 7.5.5.1. Brazil
- 7.5.5.1.1. Market size and forecast, by Flavor Type
- 7.5.5.1.2. Market size and forecast, by Content Type
- 7.5.5.1.3. Market size and forecast, by Nature
- 7.5.5.2. Colombia
- 7.5.5.2.1. Market size and forecast, by Flavor Type
- 7.5.5.2.2. Market size and forecast, by Content Type
- 7.5.5.2.3. Market size and forecast, by Nature
- 7.5.5.3. Argentina
- 7.5.5.3.1. Market size and forecast, by Flavor Type
- 7.5.5.3.2. Market size and forecast, by Content Type
- 7.5.5.3.3. Market size and forecast, by Nature
- 7.5.5.4. Rest of Latin America
- 7.5.5.4.1. Market size and forecast, by Flavor Type
- 7.5.5.4.2. Market size and forecast, by Content Type
- 7.5.5.4.3. Market size and forecast, by Nature
- 7.6. Middle East and Africa
- 7.6.1. Key market trends, growth factors and opportunities
- 7.6.2. Market size and forecast, by Flavor Type
- 7.6.3. Market size and forecast, by Content Type
- 7.6.4. Market size and forecast, by Nature
- 7.6.5. Market size and forecast, by country
- 7.6.5.1. Gcc
- 7.6.5.1.1. Market size and forecast, by Flavor Type
- 7.6.5.1.2. Market size and forecast, by Content Type
- 7.6.5.1.3. Market size and forecast, by Nature
- 7.6.5.2. South Africa
- 7.6.5.2.1. Market size and forecast, by Flavor Type
- 7.6.5.2.2. Market size and forecast, by Content Type
- 7.6.5.2.3. Market size and forecast, by Nature
- 7.6.5.3. Rest of Middle East And Africa
- 7.6.5.3.1. Market size and forecast, by Flavor Type
- 7.6.5.3.2. Market size and forecast, by Content Type
- 7.6.5.3.3. Market size and forecast, by Nature
CHAPTER 8: COMPETITIVE LANDSCAPE
- 8.1. Introduction
- 8.2. Top winning strategies
- 8.3. Product mapping of top 10 player
- 8.4. Competitive dashboard
- 8.5. Competitive heatmap
- 8.6. Top player positioning, 2022
CHAPTER 9: COMPANY PROFILES
- 9.1. Beyond Water
- 9.1.1. Company overview
- 9.1.2. Key executives
- 9.1.3. Company snapshot
- 9.1.4. Operating business segments
- 9.1.5. Product portfolio
- 9.1.6. Business performance
- 9.1.7. Key strategic moves and developments
- 9.2. Flavorah
- 9.2.1. Company overview
- 9.2.2. Key executives
- 9.2.3. Company snapshot
- 9.2.4. Operating business segments
- 9.2.5. Product portfolio
- 9.2.6. Business performance
- 9.2.7. Key strategic moves and developments
- 9.3. Flavor West Manufacturing LLC.
- 9.3.1. Company overview
- 9.3.2. Key executives
- 9.3.3. Company snapshot
- 9.3.4. Operating business segments
- 9.3.5. Product portfolio
- 9.3.6. Business performance
- 9.3.7. Key strategic moves and developments
- 9.4. GymBeam
- 9.4.1. Company overview
- 9.4.2. Key executives
- 9.4.3. Company snapshot
- 9.4.4. Operating business segments
- 9.4.5. Product portfolio
- 9.4.6. Business performance
- 9.4.7. Key strategic moves and developments
- 9.5. One on One Flavors
- 9.5.1. Company overview
- 9.5.2. Key executives
- 9.5.3. Company snapshot
- 9.5.4. Operating business segments
- 9.5.5. Product portfolio
- 9.5.6. Business performance
- 9.5.7. Key strategic moves and developments
- 9.6. Prozis
- 9.6.1. Company overview
- 9.6.2. Key executives
- 9.6.3. Company snapshot
- 9.6.4. Operating business segments
- 9.6.5. Product portfolio
- 9.6.6. Business performance
- 9.6.7. Key strategic moves and developments
- 9.7. SodaStream Inc.
- 9.7.1. Company overview
- 9.7.2. Key executives
- 9.7.3. Company snapshot
- 9.7.4. Operating business segments
- 9.7.5. Product portfolio
- 9.7.6. Business performance
- 9.7.7. Key strategic moves and developments
- 9.8. LorAnn Oils
- 9.8.1. Company overview
- 9.8.2. Key executives
- 9.8.3. Company snapshot
- 9.8.4. Operating business segments
- 9.8.5. Product portfolio
- 9.8.6. Business performance
- 9.8.7. Key strategic moves and developments
- 9.9. Capella Flavors, Inc.
- 9.9.1. Company overview
- 9.9.2. Key executives
- 9.9.3. Company snapshot
- 9.9.4. Operating business segments
- 9.9.5. Product portfolio
- 9.9.6. Business performance
- 9.9.7. Key strategic moves and developments
- 9.10. My Protein
- 9.10.1. Company overview
- 9.10.2. Key executives
- 9.10.3. Company snapshot
- 9.10.4. Operating business segments
- 9.10.5. Product portfolio
- 9.10.6. Business performance
- 9.10.7. Key strategic moves and developments
LIST OF TABLES
- TABLE 01. GLOBAL FLAVOR DROPS MARKET, BY FLAVOR TYPE, 2022-2032 ($MILLION)
- TABLE 02. FLAVOR DROPS MARKET FOR FRUIT, BY REGION, 2022-2032 ($MILLION)
- TABLE 03. FLAVOR DROPS MARKET FOR TEA-COFFEE, BY REGION, 2022-2032 ($MILLION)
- TABLE 04. FLAVOR DROPS MARKET FOR CHOCOLATE, BY REGION, 2022-2032 ($MILLION)
- TABLE 05. FLAVOR DROPS MARKET FOR LEMON, BY REGION, 2022-2032 ($MILLION)
- TABLE 06. FLAVOR DROPS MARKET FOR VANILLA, BY REGION, 2022-2032 ($MILLION)
- TABLE 07. FLAVOR DROPS MARKET FOR OTHERS, BY REGION, 2022-2032 ($MILLION)
- TABLE 08. GLOBAL FLAVOR DROPS MARKET, BY CONTENT TYPE, 2022-2032 ($MILLION)
- TABLE 09. FLAVOR DROPS MARKET FOR REGULAR, BY REGION, 2022-2032 ($MILLION)
- TABLE 10. FLAVOR DROPS MARKET FOR SUGAR FREE, BY REGION, 2022-2032 ($MILLION)
- TABLE 11. GLOBAL FLAVOR DROPS MARKET, BY NATURE, 2022-2032 ($MILLION)
- TABLE 12. FLAVOR DROPS MARKET FOR ORGANIC, BY REGION, 2022-2032 ($MILLION)
- TABLE 13. FLAVOR DROPS MARKET FOR CONVENTIONAL, BY REGION, 2022-2032 ($MILLION)
- TABLE 14. FLAVOR DROPS MARKET, BY REGION, 2022-2032 ($MILLION)
- TABLE 15. NORTH AMERICA FLAVOR DROPS MARKET, BY FLAVOR TYPE, 2022-2032 ($MILLION)
- TABLE 16. NORTH AMERICA FLAVOR DROPS MARKET, BY CONTENT TYPE, 2022-2032 ($MILLION)
- TABLE 17. NORTH AMERICA FLAVOR DROPS MARKET, BY NATURE, 2022-2032 ($MILLION)
- TABLE 18. NORTH AMERICA FLAVOR DROPS MARKET, BY COUNTRY, 2022-2032 ($MILLION)
- TABLE 19. U.S. FLAVOR DROPS MARKET, BY FLAVOR TYPE, 2022-2032 ($MILLION)
- TABLE 20. U.S. FLAVOR DROPS MARKET, BY CONTENT TYPE, 2022-2032 ($MILLION)
- TABLE 21. U.S. FLAVOR DROPS MARKET, BY NATURE, 2022-2032 ($MILLION)
- TABLE 22. CANADA FLAVOR DROPS MARKET, BY FLAVOR TYPE, 2022-2032 ($MILLION)
- TABLE 23. CANADA FLAVOR DROPS MARKET, BY CONTENT TYPE, 2022-2032 ($MILLION)
- TABLE 24. CANADA FLAVOR DROPS MARKET, BY NATURE, 2022-2032 ($MILLION)
- TABLE 25. MEXICO FLAVOR DROPS MARKET, BY FLAVOR TYPE, 2022-2032 ($MILLION)
- TABLE 26. MEXICO FLAVOR DROPS MARKET, BY CONTENT TYPE, 2022-2032 ($MILLION)
- TABLE 27. MEXICO FLAVOR DROPS MARKET, BY NATURE, 2022-2032 ($MILLION)
- TABLE 28. EUROPE FLAVOR DROPS MARKET, BY FLAVOR TYPE, 2022-2032 ($MILLION)
- TABLE 29. EUROPE FLAVOR DROPS MARKET, BY CONTENT TYPE, 2022-2032 ($MILLION)
- TABLE 30. EUROPE FLAVOR DROPS MARKET, BY NATURE, 2022-2032 ($MILLION)
- TABLE 31. EUROPE FLAVOR DROPS MARKET, BY COUNTRY, 2022-2032 ($MILLION)
- TABLE 32. GERMANY FLAVOR DROPS MARKET, BY FLAVOR TYPE, 2022-2032 ($MILLION)
- TABLE 33. GERMANY FLAVOR DROPS MARKET, BY CONTENT TYPE, 2022-2032 ($MILLION)
- TABLE 34. GERMANY FLAVOR DROPS MARKET, BY NATURE, 2022-2032 ($MILLION)
- TABLE 35. UK FLAVOR DROPS MARKET, BY FLAVOR TYPE, 2022-2032 ($MILLION)
- TABLE 36. UK FLAVOR DROPS MARKET, BY CONTENT TYPE, 2022-2032 ($MILLION)
- TABLE 37. UK FLAVOR DROPS MARKET, BY NATURE, 2022-2032 ($MILLION)
- TABLE 38. FRANCE FLAVOR DROPS MARKET, BY FLAVOR TYPE, 2022-2032 ($MILLION)
- TABLE 39. FRANCE FLAVOR DROPS MARKET, BY CONTENT TYPE, 2022-2032 ($MILLION)
- TABLE 40. FRANCE FLAVOR DROPS MARKET, BY NATURE, 2022-2032 ($MILLION)
- TABLE 41. ITALY FLAVOR DROPS MARKET, BY FLAVOR TYPE, 2022-2032 ($MILLION)
- TABLE 42. ITALY FLAVOR DROPS MARKET, BY CONTENT TYPE, 2022-2032 ($MILLION)
- TABLE 43. ITALY FLAVOR DROPS MARKET, BY NATURE, 2022-2032 ($MILLION)
- TABLE 44. SPAIN FLAVOR DROPS MARKET, BY FLAVOR TYPE, 2022-2032 ($MILLION)
- TABLE 45. SPAIN FLAVOR DROPS MARKET, BY CONTENT TYPE, 2022-2032 ($MILLION)
- TABLE 46. SPAIN FLAVOR DROPS MARKET, BY NATURE, 2022-2032 ($MILLION)
- TABLE 47. REST OF EUROPE FLAVOR DROPS MARKET, BY FLAVOR TYPE, 2022-2032 ($MILLION)
- TABLE 48. REST OF EUROPE FLAVOR DROPS MARKET, BY CONTENT TYPE, 2022-2032 ($MILLION)
- TABLE 49. REST OF EUROPE FLAVOR DROPS MARKET, BY NATURE, 2022-2032 ($MILLION)
- TABLE 50. ASIA-PACIFIC FLAVOR DROPS MARKET, BY FLAVOR TYPE, 2022-2032 ($MILLION)
- TABLE 51. ASIA-PACIFIC FLAVOR DROPS MARKET, BY CONTENT TYPE, 2022-2032 ($MILLION)
- TABLE 52. ASIA-PACIFIC FLAVOR DROPS MARKET, BY NATURE, 2022-2032 ($MILLION)
- TABLE 53. ASIA-PACIFIC FLAVOR DROPS MARKET, BY COUNTRY, 2022-2032 ($MILLION)
- TABLE 54. CHINA FLAVOR DROPS MARKET, BY FLAVOR TYPE, 2022-2032 ($MILLION)
- TABLE 55. CHINA FLAVOR DROPS MARKET, BY CONTENT TYPE, 2022-2032 ($MILLION)
- TABLE 56. CHINA FLAVOR DROPS MARKET, BY NATURE, 2022-2032 ($MILLION)
- TABLE 57. INDIA FLAVOR DROPS MARKET, BY FLAVOR TYPE, 2022-2032 ($MILLION)
- TABLE 58. INDIA FLAVOR DROPS MARKET, BY CONTENT TYPE, 2022-2032 ($MILLION)
- TABLE 59. INDIA FLAVOR DROPS MARKET, BY NATURE, 2022-2032 ($MILLION)
- TABLE 60. JAPAN FLAVOR DROPS MARKET, BY FLAVOR TYPE, 2022-2032 ($MILLION)
- TABLE 61. JAPAN FLAVOR DROPS MARKET, BY CONTENT TYPE, 2022-2032 ($MILLION)
- TABLE 62. JAPAN FLAVOR DROPS MARKET, BY NATURE, 2022-2032 ($MILLION)
- TABLE 63. SOUTH KOREA FLAVOR DROPS MARKET, BY FLAVOR TYPE, 2022-2032 ($MILLION)
- TABLE 64. SOUTH KOREA FLAVOR DROPS MARKET, BY CONTENT TYPE, 2022-2032 ($MILLION)
- TABLE 65. SOUTH KOREA FLAVOR DROPS MARKET, BY NATURE, 2022-2032 ($MILLION)
- TABLE 66. AUSTRALIA FLAVOR DROPS MARKET, BY FLAVOR TYPE, 2022-2032 ($MILLION)
- TABLE 67. AUSTRALIA FLAVOR DROPS MARKET, BY CONTENT TYPE, 2022-2032 ($MILLION)
- TABLE 68. AUSTRALIA FLAVOR DROPS MARKET, BY NATURE, 2022-2032 ($MILLION)
- TABLE 69. ASEAN FLAVOR DROPS MARKET, BY FLAVOR TYPE, 2022-2032 ($MILLION)
- TABLE 70. ASEAN FLAVOR DROPS MARKET, BY CONTENT TYPE, 2022-2032 ($MILLION)
- TABLE 71. ASEAN FLAVOR DROPS MARKET, BY NATURE, 2022-2032 ($MILLION)
- TABLE 72. REST OF ASIA-PACIFIC FLAVOR DROPS MARKET, BY FLAVOR TYPE, 2022-2032 ($MILLION)
- TABLE 73. REST OF ASIA-PACIFIC FLAVOR DROPS MARKET, BY CONTENT TYPE, 2022-2032 ($MILLION)
- TABLE 74. REST OF ASIA-PACIFIC FLAVOR DROPS MARKET, BY NATURE, 2022-2032 ($MILLION)
- TABLE 75. LATIN AMERICA FLAVOR DROPS MARKET, BY FLAVOR TYPE, 2022-2032 ($MILLION)
- TABLE 76. LATIN AMERICA FLAVOR DROPS MARKET, BY CONTENT TYPE, 2022-2032 ($MILLION)
- TABLE 77. LATIN AMERICA FLAVOR DROPS MARKET, BY NATURE, 2022-2032 ($MILLION)
- TABLE 78. LATIN AMERICA FLAVOR DROPS MARKET, BY COUNTRY, 2022-2032 ($MILLION)
- TABLE 79. BRAZIL FLAVOR DROPS MARKET, BY FLAVOR TYPE, 2022-2032 ($MILLION)
- TABLE 80. BRAZIL FLAVOR DROPS MARKET, BY CONTENT TYPE, 2022-2032 ($MILLION)
- TABLE 81. BRAZIL FLAVOR DROPS MARKET, BY NATURE, 2022-2032 ($MILLION)
- TABLE 82. COLOMBIA FLAVOR DROPS MARKET, BY FLAVOR TYPE, 2022-2032 ($MILLION)
- TABLE 83. COLOMBIA FLAVOR DROPS MARKET, BY CONTENT TYPE, 2022-2032 ($MILLION)
- TABLE 84. COLOMBIA FLAVOR DROPS MARKET, BY NATURE, 2022-2032 ($MILLION)
- TABLE 85. ARGENTINA FLAVOR DROPS MARKET, BY FLAVOR TYPE, 2022-2032 ($MILLION)
- TABLE 86. ARGENTINA FLAVOR DROPS MARKET, BY CONTENT TYPE, 2022-2032 ($MILLION)
- TABLE 87. ARGENTINA FLAVOR DROPS MARKET, BY NATURE, 2022-2032 ($MILLION)
- TABLE 88. REST OF LATIN AMERICA FLAVOR DROPS MARKET, BY FLAVOR TYPE, 2022-2032 ($MILLION)
- TABLE 89. REST OF LATIN AMERICA FLAVOR DROPS MARKET, BY CONTENT TYPE, 2022-2032 ($MILLION)
- TABLE 90. REST OF LATIN AMERICA FLAVOR DROPS MARKET, BY NATURE, 2022-2032 ($MILLION)
- TABLE 91. MIDDLE EAST AND AFRICA FLAVOR DROPS MARKET, BY FLAVOR TYPE, 2022-2032 ($MILLION)
- TABLE 92. MIDDLE EAST AND AFRICA FLAVOR DROPS MARKET, BY CONTENT TYPE, 2022-2032 ($MILLION)
- TABLE 93. MIDDLE EAST AND AFRICA FLAVOR DROPS MARKET, BY NATURE, 2022-2032 ($MILLION)
- TABLE 94. MIDDLE EAST AND AFRICA FLAVOR DROPS MARKET, BY COUNTRY, 2022-2032 ($MILLION)
- TABLE 95. GCC FLAVOR DROPS MARKET, BY FLAVOR TYPE, 2022-2032 ($MILLION)
- TABLE 96. GCC FLAVOR DROPS MARKET, BY CONTENT TYPE, 2022-2032 ($MILLION)
- TABLE 97. GCC FLAVOR DROPS MARKET, BY NATURE, 2022-2032 ($MILLION)
- TABLE 98. SOUTH AFRICA FLAVOR DROPS MARKET, BY FLAVOR TYPE, 2022-2032 ($MILLION)
- TABLE 99. SOUTH AFRICA FLAVOR DROPS MARKET, BY CONTENT TYPE, 2022-2032 ($MILLION)
- TABLE 100. SOUTH AFRICA FLAVOR DROPS MARKET, BY NATURE, 2022-2032 ($MILLION)
- TABLE 101. REST OF MIDDLE EAST AND AFRICA FLAVOR DROPS MARKET, BY FLAVOR TYPE, 2022-2032 ($MILLION)
- TABLE 102. REST OF MIDDLE EAST AND AFRICA FLAVOR DROPS MARKET, BY CONTENT TYPE, 2022-2032 ($MILLION)
- TABLE 103. REST OF MIDDLE EAST AND AFRICA FLAVOR DROPS MARKET, BY NATURE, 2022-2032 ($MILLION)
- TABLE 104. BEYOND WATER: KEY EXECUTIVES
- TABLE 105. BEYOND WATER: COMPANY SNAPSHOT
- TABLE 106. BEYOND WATER: PRODUCT SEGMENTS
- TABLE 107. BEYOND WATER: SERVICE SEGMENTS
- TABLE 108. BEYOND WATER: PRODUCT PORTFOLIO
- TABLE 109. BEYOND WATER: KEY STRATERGIES
- TABLE 110. FLAVORAH: KEY EXECUTIVES
- TABLE 111. FLAVORAH: COMPANY SNAPSHOT
- TABLE 112. FLAVORAH: PRODUCT SEGMENTS
- TABLE 113. FLAVORAH: SERVICE SEGMENTS
- TABLE 114. FLAVORAH: PRODUCT PORTFOLIO
- TABLE 115. FLAVORAH: KEY STRATERGIES
- TABLE 116. FLAVOR WEST MANUFACTURING LLC.: KEY EXECUTIVES
- TABLE 117. FLAVOR WEST MANUFACTURING LLC.: COMPANY SNAPSHOT
- TABLE 118. FLAVOR WEST MANUFACTURING LLC.: PRODUCT SEGMENTS
- TABLE 119. FLAVOR WEST MANUFACTURING LLC.: SERVICE SEGMENTS
- TABLE 120. FLAVOR WEST MANUFACTURING LLC.: PRODUCT PORTFOLIO
- TABLE 121. FLAVOR WEST MANUFACTURING LLC.: KEY STRATERGIES
- TABLE 122. GYMBEAM: KEY EXECUTIVES
- TABLE 123. GYMBEAM: COMPANY SNAPSHOT
- TABLE 124. GYMBEAM: PRODUCT SEGMENTS
- TABLE 125. GYMBEAM: SERVICE SEGMENTS
- TABLE 126. GYMBEAM: PRODUCT PORTFOLIO
- TABLE 127. GYMBEAM: KEY STRATERGIES
- TABLE 128. ONE ON ONE FLAVORS: KEY EXECUTIVES
- TABLE 129. ONE ON ONE FLAVORS: COMPANY SNAPSHOT
- TABLE 130. ONE ON ONE FLAVORS: PRODUCT SEGMENTS
- TABLE 131. ONE ON ONE FLAVORS: SERVICE SEGMENTS
- TABLE 132. ONE ON ONE FLAVORS: PRODUCT PORTFOLIO
- TABLE 133. ONE ON ONE FLAVORS: KEY STRATERGIES
- TABLE 134. PROZIS: KEY EXECUTIVES
- TABLE 135. PROZIS: COMPANY SNAPSHOT
- TABLE 136. PROZIS: PRODUCT SEGMENTS
- TABLE 137. PROZIS: SERVICE SEGMENTS
- TABLE 138. PROZIS: PRODUCT PORTFOLIO
- TABLE 139. PROZIS: KEY STRATERGIES
- TABLE 140. SODASTREAM INC.: KEY EXECUTIVES
- TABLE 141. SODASTREAM INC.: COMPANY SNAPSHOT
- TABLE 142. SODASTREAM INC.: PRODUCT SEGMENTS
- TABLE 143. SODASTREAM INC.: SERVICE SEGMENTS
- TABLE 144. SODASTREAM INC.: PRODUCT PORTFOLIO
- TABLE 145. SODASTREAM INC.: KEY STRATERGIES
- TABLE 146. LORANN OILS: KEY EXECUTIVES
- TABLE 147. LORANN OILS: COMPANY SNAPSHOT
- TABLE 148. LORANN OILS: PRODUCT SEGMENTS
- TABLE 149. LORANN OILS: SERVICE SEGMENTS
- TABLE 150. LORANN OILS: PRODUCT PORTFOLIO
- TABLE 151. LORANN OILS: KEY STRATERGIES
- TABLE 152. CAPELLA FLAVORS, INC.: KEY EXECUTIVES
- TABLE 153. CAPELLA FLAVORS, INC.: COMPANY SNAPSHOT
- TABLE 154. CAPELLA FLAVORS, INC.: PRODUCT SEGMENTS
- TABLE 155. CAPELLA FLAVORS, INC.: SERVICE SEGMENTS
- TABLE 156. CAPELLA FLAVORS, INC.: PRODUCT PORTFOLIO
- TABLE 157. CAPELLA FLAVORS, INC.: KEY STRATERGIES
- TABLE 158. MY PROTEIN: KEY EXECUTIVES
- TABLE 159. MY PROTEIN: COMPANY SNAPSHOT
- TABLE 160. MY PROTEIN: PRODUCT SEGMENTS
- TABLE 161. MY PROTEIN: SERVICE SEGMENTS
- TABLE 162. MY PROTEIN: PRODUCT PORTFOLIO
- TABLE 163. MY PROTEIN: KEY STRATERGIES
LIST OF FIGURES
- FIGURE 01. FLAVOR DROPS MARKET, 2022-2032
- FIGURE 02. SEGMENTATION OF FLAVOR DROPS MARKET,2022-2032
- FIGURE 03. TOP IMPACTING FACTORS IN FLAVOR DROPS MARKET
- FIGURE 04. TOP INVESTMENT POCKETS IN FLAVOR DROPS MARKET (2023-2032)
- FIGURE 05. BARGAINING POWER OF SUPPLIERS
- FIGURE 06. BARGAINING POWER OF BUYERS
- FIGURE 07. THREAT OF SUBSTITUTION
- FIGURE 08. THREAT OF SUBSTITUTION
- FIGURE 09. COMPETITIVE RIVALRY
- FIGURE 10. GLOBAL FLAVOR DROPS MARKET:DRIVERS, RESTRAINTS AND OPPORTUNITIES
- FIGURE 11. FLAVOR DROPS MARKET, BY FLAVOR TYPE, 2022 AND 2032(%)
- FIGURE 12. COMPARATIVE SHARE ANALYSIS OF FLAVOR DROPS MARKET FOR FRUIT, BY COUNTRY 2022 AND 2032(%)
- FIGURE 13. COMPARATIVE SHARE ANALYSIS OF FLAVOR DROPS MARKET FOR TEA-COFFEE, BY COUNTRY 2022 AND 2032(%)
- FIGURE 14. COMPARATIVE SHARE ANALYSIS OF FLAVOR DROPS MARKET FOR CHOCOLATE, BY COUNTRY 2022 AND 2032(%)
- FIGURE 15. COMPARATIVE SHARE ANALYSIS OF FLAVOR DROPS MARKET FOR LEMON, BY COUNTRY 2022 AND 2032(%)
- FIGURE 16. COMPARATIVE SHARE ANALYSIS OF FLAVOR DROPS MARKET FOR VANILLA, BY COUNTRY 2022 AND 2032(%)
- FIGURE 17. COMPARATIVE SHARE ANALYSIS OF FLAVOR DROPS MARKET FOR OTHERS, BY COUNTRY 2022 AND 2032(%)
- FIGURE 18. FLAVOR DROPS MARKET, BY CONTENT TYPE, 2022 AND 2032(%)
- FIGURE 19. COMPARATIVE SHARE ANALYSIS OF FLAVOR DROPS MARKET FOR REGULAR, BY COUNTRY 2022 AND 2032(%)
- FIGURE 20. COMPARATIVE SHARE ANALYSIS OF FLAVOR DROPS MARKET FOR SUGAR FREE, BY COUNTRY 2022 AND 2032(%)
- FIGURE 21. FLAVOR DROPS MARKET, BY NATURE, 2022 AND 2032(%)
- FIGURE 22. COMPARATIVE SHARE ANALYSIS OF FLAVOR DROPS MARKET FOR ORGANIC, BY COUNTRY 2022 AND 2032(%)
- FIGURE 23. COMPARATIVE SHARE ANALYSIS OF FLAVOR DROPS MARKET FOR CONVENTIONAL, BY COUNTRY 2022 AND 2032(%)
- FIGURE 24. FLAVOR DROPS MARKET BY REGION, 2022 AND 2032(%)
- FIGURE 25. U.S. FLAVOR DROPS MARKET, 2022-2032 ($MILLION)
- FIGURE 26. CANADA FLAVOR DROPS MARKET, 2022-2032 ($MILLION)
- FIGURE 27. MEXICO FLAVOR DROPS MARKET, 2022-2032 ($MILLION)
- FIGURE 28. GERMANY FLAVOR DROPS MARKET, 2022-2032 ($MILLION)
- FIGURE 29. UK FLAVOR DROPS MARKET, 2022-2032 ($MILLION)
- FIGURE 30. FRANCE FLAVOR DROPS MARKET, 2022-2032 ($MILLION)
- FIGURE 31. ITALY FLAVOR DROPS MARKET, 2022-2032 ($MILLION)
- FIGURE 32. SPAIN FLAVOR DROPS MARKET, 2022-2032 ($MILLION)
- FIGURE 33. REST OF EUROPE FLAVOR DROPS MARKET, 2022-2032 ($MILLION)
- FIGURE 34. CHINA FLAVOR DROPS MARKET, 2022-2032 ($MILLION)
- FIGURE 35. INDIA FLAVOR DROPS MARKET, 2022-2032 ($MILLION)
- FIGURE 36. JAPAN FLAVOR DROPS MARKET, 2022-2032 ($MILLION)
- FIGURE 37. SOUTH KOREA FLAVOR DROPS MARKET, 2022-2032 ($MILLION)
- FIGURE 38. AUSTRALIA FLAVOR DROPS MARKET, 2022-2032 ($MILLION)
- FIGURE 39. ASEAN FLAVOR DROPS MARKET, 2022-2032 ($MILLION)
- FIGURE 40. REST OF ASIA-PACIFIC FLAVOR DROPS MARKET, 2022-2032 ($MILLION)
- FIGURE 41. BRAZIL FLAVOR DROPS MARKET, 2022-2032 ($MILLION)
- FIGURE 42. COLOMBIA FLAVOR DROPS MARKET, 2022-2032 ($MILLION)
- FIGURE 43. ARGENTINA FLAVOR DROPS MARKET, 2022-2032 ($MILLION)
- FIGURE 44. REST OF LATIN AMERICA FLAVOR DROPS MARKET, 2022-2032 ($MILLION)
- FIGURE 45. GCC FLAVOR DROPS MARKET, 2022-2032 ($MILLION)
- FIGURE 46. SOUTH AFRICA FLAVOR DROPS MARKET, 2022-2032 ($MILLION)
- FIGURE 47. REST OF MIDDLE EAST AND AFRICA FLAVOR DROPS MARKET, 2022-2032 ($MILLION)
- FIGURE 48. TOP WINNING STRATEGIES, BY YEAR
- FIGURE 49. TOP WINNING STRATEGIES, BY DEVELOPMENT
- FIGURE 50. TOP WINNING STRATEGIES, BY COMPANY
- FIGURE 51. PRODUCT MAPPING OF TOP 10 PLAYERS
- FIGURE 52. COMPETITIVE DASHBOARD
- FIGURE 53. COMPETITIVE HEATMAP: FLAVOR DROPS MARKET
- FIGURE 54. TOP PLAYER POSITIONING, 2022

