
PUBLISHER: Allied Market Research | PRODUCT CODE: 1472253

PUBLISHER: Allied Market Research | PRODUCT CODE: 1472253
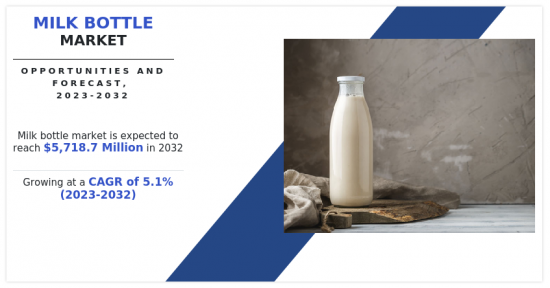
Milk Bottle Market By Capacity, By Application, By Material, By Closure Type : Global Opportunity Analysis and Industry Forecast, 2023-2032
The global milk bottle market is anticipated to reach $5,718,650.5 thousand by 2032, growing from $3,580,115.0 thousand in 2022 at a CAGR of 5.1 % from 2023 to 2032.
A milk bottle is a container particularly intended to store and carry milk. It is often made of glass, plastic, or other materials and functions as a vessel to retain the freshness and quality of milk while assuring ease of use for both producers and customers. Glass milk bottles have a unique form with a small neck and a secure closure mechanism, such as a threaded cap or a foil seal.
Milk bottles are designed to meet the strict health and safety requirements. The non-reactive nature of glass and HDPE guarantees that the milk remains uncontaminated by exterior chemicals. This is especially important for maintaining the nutritional content of milk and protecting consumer health. The fact that milk bottles may be recycled is one of their most significant advantages. Glass bottles, in example, may be recycled endlessly without affecting their quality. Recycling reduces the demand for fresh raw materials while also minimizing the environmental effect of package manufacture. Milk bottles come in a variety of shapes and sizes, allowing for creative design options. This enables dairy firms to appeal to a variety of consumer tastes and market niches. In a competitive market, unique container forms and labelling help to increase brand identification and distinction.
Milk bottles, particularly those made of plastic, may not provide adequate protection from external influences that might compromise the freshness of milk. Exposure to light and air can cause milk quality to decrease over time. Milk placed in bottles has a limited shelf life, especially if not adequately chilled, which causes issues for both customers and merchants. Innovative packaging technology, such as light-blocking materials or enhanced sealing procedures, is critical to resolving these challenges. While glass bottles are typically regarded as a more ecologically responsible alternative to plastic, they have their own set of drawbacks. Glass bottles are heavier and more delicate, which increases the likelihood of breaking during shipping, storage, or handling.
With the increasing emphasis on sustainability and environmental consciousness, there is a rising demand for eco-friendly packaging solutions such as refillable and recyclable milk bottles. Key companies operating in the market can capitalize on this trend by introducing innovative designs and materials that minimize environmental impact while ensuring product freshness and safety. Moreover, the growing popularity of online grocery shopping offers avenues for expansion, as consumers seek convenient and reliable packaging options for home delivery. Leveraging technological advancements, such as smart packaging and traceability features, can further enhance consumer trust and engagement. By embracing these opportunities, key players operating in the milk bottle market can differentiate themselves, foster brand loyalty, and drive sustainable growth in the ever-evolving dairy industry.
The key players profiled in this report include Longshen Industrial, Huhtamaki, Amcor, Gerresheimer, Tupperware Brands, Maharashtra Industries, MeadWestvaco, Bormioli, Rocco, WWP Direct, and Kadolta Packaging. The market players are continuously striving to achieve a dominant position in this competitive market using strategies such as Brand positioning and marketing and product innovation.
Key Benefits For Stakeholders
- This report provides a quantitative analysis of the market segments, current trends, estimations, and dynamics of the milk bottle market analysis from 2022 to 2032 to identify the prevailing milk bottle market opportunities.
- The market research is offered along with information related to key drivers, restraints, and opportunities.
- Porter's five forces analysis highlights the potency of buyers and suppliers to enable stakeholders make profit-oriented business decisions and strengthen their supplier-buyer network.
- In-depth analysis of the milk bottle market segmentation assists to determine the prevailing market opportunities.
- Major countries in each region are mapped according to their revenue contribution to the global market.
- Market player positioning facilitates benchmarking and provides a clear understanding of the present position of the market players.
- The report includes the analysis of the regional as well as global milk bottle market trends, key players, market segments, application areas, and market growth strategies.
Additional benefits you will get with this purchase are:
- Quarterly Update and* (only available with a corporate license, on listed price)
- 5 additional Company Profile of client Choice pre- or Post-purchase, as a free update.
- Free Upcoming Version on the Purchase of Five and Enterprise User License.
- 16 analyst hours of support* (post-purchase, if you find additional data requirements upon review of the report, you may receive support amounting to 16 analyst hours to solve questions, and post-sale queries)
- 15% Free Customization* (in case the scope or segment of the report does not match your requirements, 15% is equivalent to 3 working days of free work, applicable once)
- Free data Pack on the Five and Enterprise User License. (Excel version of the report)
- Free Updated report if the report is 6-12 months old or older.
- 24-hour priority response*
- Free Industry updates and white papers.
Possible Customization with this report (with additional cost and timeline, please talk to the sales executive to know more)
- Investment Opportunities
- Supply Chain Analysis & Vendor Margins
- Technology Trend Analysis
- Market share analysis of players by products/segments
- New Product Development/ Product Matrix of Key Players
- Regulatory Guidelines
- Additional company profiles with specific to client's interest
- Additional country or region analysis- market size and forecast
- Criss-cross segment analysis- market size and forecast
- Expanded list for Company Profiles
- Historic market data
- Key player details (including location, contact details, supplier/vendor network etc. in excel format)
- List of customers/consumers/raw material suppliers- value chain analysis
- Market share analysis of players at global/region/country level
- SWOT Analysis
Key Market Segments
By Capacity
- Below 200 ML
- 200 ML to 500 ML
- 500 ML to 2000 ML
- Above 2000 ML
By Application
- Baby Feeding Bottle
- Milk Store Bottle
By Material
- Plastics
- Glass
By Closure Type
- Screw Cap
- Snap-On Caps
- Others
By Region
- North America
- U.S.
- Canada
- Mexico
- Europe
- Germany
- UK
- France
- Spain
- Italy
- Rest of Europe
- Asia-Pacific
- China
- Japan
- India
- South Korea
- Australia
- Rest of Asia-Pacific
- LAMEA
- Brazil
- Saudi Arabia
- UAE
- South Africa
- Rest of LAMEA
Key Market Players:
- Longshen Industrial
- Huhtamaki
- Amcor
- gerresheimer
- tupperware brands
- Maharashtra Industries
- meadwestvaco
- bormioli rocco
- WWP Direct
- Kadolta Packaging
TABLE OF CONTENTS
CHAPTER 1: INTRODUCTION
- 1.1. Report description
- 1.2. Key market segments
- 1.3. Key benefits to the stakeholders
- 1.4. Research methodology
- 1.4.1. Primary research
- 1.4.2. Secondary research
- 1.4.3. Analyst tools and models
CHAPTER 2: EXECUTIVE SUMMARY
- 2.1. CXO perspective
CHAPTER 3: MARKET OVERVIEW
- 3.1. Market definition and scope
- 3.2. Key findings
- 3.2.1. Top impacting factors
- 3.2.2. Top investment pockets
- 3.3. Porter's five forces analysis
- 3.4. Market dynamics
- 3.4.1. Drivers
- 3.4.2. Restraints
- 3.4.3. Opportunities
- 3.5. Market Share Analysis
- 3.6. Brand Share Analysis
- 3.7. Value Chain Analysis
- 3.8. Regulatory Guidelines
- 3.9. Key Regulation Analysis
CHAPTER 4: MILK BOTTLE MARKET, BY CAPACITY
- 4.1. Overview
- 4.1.1. Market size and forecast
- 4.2. Below 200 ML
- 4.2.1. Key market trends, growth factors and opportunities
- 4.2.2. Market size and forecast, by region
- 4.2.3. Market share analysis by country
- 4.3. 200 ML to 500 ML
- 4.3.1. Key market trends, growth factors and opportunities
- 4.3.2. Market size and forecast, by region
- 4.3.3. Market share analysis by country
- 4.4. 500 ML to 2000 ML
- 4.4.1. Key market trends, growth factors and opportunities
- 4.4.2. Market size and forecast, by region
- 4.4.3. Market share analysis by country
- 4.5. Above 2000 ML
- 4.5.1. Key market trends, growth factors and opportunities
- 4.5.2. Market size and forecast, by region
- 4.5.3. Market share analysis by country
CHAPTER 5: MILK BOTTLE MARKET, BY APPLICATION
- 5.1. Overview
- 5.1.1. Market size and forecast
- 5.2. Baby Feeding Bottle
- 5.2.1. Key market trends, growth factors and opportunities
- 5.2.2. Market size and forecast, by region
- 5.2.3. Market share analysis by country
- 5.3. Milk Store Bottle
- 5.3.1. Key market trends, growth factors and opportunities
- 5.3.2. Market size and forecast, by region
- 5.3.3. Market share analysis by country
CHAPTER 6: MILK BOTTLE MARKET, BY MATERIAL
- 6.1. Overview
- 6.1.1. Market size and forecast
- 6.2. Plastics
- 6.2.1. Key market trends, growth factors and opportunities
- 6.2.2. Market size and forecast, by region
- 6.2.3. Market share analysis by country
- 6.3. Glass
- 6.3.1. Key market trends, growth factors and opportunities
- 6.3.2. Market size and forecast, by region
- 6.3.3. Market share analysis by country
CHAPTER 7: MILK BOTTLE MARKET, BY CLOSURE TYPE
- 7.1. Overview
- 7.1.1. Market size and forecast
- 7.2. Screw Cap
- 7.2.1. Key market trends, growth factors and opportunities
- 7.2.2. Market size and forecast, by region
- 7.2.3. Market share analysis by country
- 7.3. Snap-On Caps
- 7.3.1. Key market trends, growth factors and opportunities
- 7.3.2. Market size and forecast, by region
- 7.3.3. Market share analysis by country
- 7.4. Others
- 7.4.1. Key market trends, growth factors and opportunities
- 7.4.2. Market size and forecast, by region
- 7.4.3. Market share analysis by country
CHAPTER 8: MILK BOTTLE MARKET, BY REGION
- 8.1. Overview
- 8.1.1. Market size and forecast By Region
- 8.2. North America
- 8.2.1. Key market trends, growth factors and opportunities
- 8.2.2. Market size and forecast, by Capacity
- 8.2.3. Market size and forecast, by Application
- 8.2.4. Market size and forecast, by Material
- 8.2.5. Market size and forecast, by Closure Type
- 8.2.6. Market size and forecast, by country
- 8.2.6.1. U.S.
- 8.2.6.1.1. Market size and forecast, by Capacity
- 8.2.6.1.2. Market size and forecast, by Application
- 8.2.6.1.3. Market size and forecast, by Material
- 8.2.6.1.4. Market size and forecast, by Closure Type
- 8.2.6.2. Canada
- 8.2.6.2.1. Market size and forecast, by Capacity
- 8.2.6.2.2. Market size and forecast, by Application
- 8.2.6.2.3. Market size and forecast, by Material
- 8.2.6.2.4. Market size and forecast, by Closure Type
- 8.2.6.3. Mexico
- 8.2.6.3.1. Market size and forecast, by Capacity
- 8.2.6.3.2. Market size and forecast, by Application
- 8.2.6.3.3. Market size and forecast, by Material
- 8.2.6.3.4. Market size and forecast, by Closure Type
- 8.3. Europe
- 8.3.1. Key market trends, growth factors and opportunities
- 8.3.2. Market size and forecast, by Capacity
- 8.3.3. Market size and forecast, by Application
- 8.3.4. Market size and forecast, by Material
- 8.3.5. Market size and forecast, by Closure Type
- 8.3.6. Market size and forecast, by country
- 8.3.6.1. Germany
- 8.3.6.1.1. Market size and forecast, by Capacity
- 8.3.6.1.2. Market size and forecast, by Application
- 8.3.6.1.3. Market size and forecast, by Material
- 8.3.6.1.4. Market size and forecast, by Closure Type
- 8.3.6.2. UK
- 8.3.6.2.1. Market size and forecast, by Capacity
- 8.3.6.2.2. Market size and forecast, by Application
- 8.3.6.2.3. Market size and forecast, by Material
- 8.3.6.2.4. Market size and forecast, by Closure Type
- 8.3.6.3. France
- 8.3.6.3.1. Market size and forecast, by Capacity
- 8.3.6.3.2. Market size and forecast, by Application
- 8.3.6.3.3. Market size and forecast, by Material
- 8.3.6.3.4. Market size and forecast, by Closure Type
- 8.3.6.4. Spain
- 8.3.6.4.1. Market size and forecast, by Capacity
- 8.3.6.4.2. Market size and forecast, by Application
- 8.3.6.4.3. Market size and forecast, by Material
- 8.3.6.4.4. Market size and forecast, by Closure Type
- 8.3.6.5. Italy
- 8.3.6.5.1. Market size and forecast, by Capacity
- 8.3.6.5.2. Market size and forecast, by Application
- 8.3.6.5.3. Market size and forecast, by Material
- 8.3.6.5.4. Market size and forecast, by Closure Type
- 8.3.6.6. Rest of Europe
- 8.3.6.6.1. Market size and forecast, by Capacity
- 8.3.6.6.2. Market size and forecast, by Application
- 8.3.6.6.3. Market size and forecast, by Material
- 8.3.6.6.4. Market size and forecast, by Closure Type
- 8.4. Asia-Pacific
- 8.4.1. Key market trends, growth factors and opportunities
- 8.4.2. Market size and forecast, by Capacity
- 8.4.3. Market size and forecast, by Application
- 8.4.4. Market size and forecast, by Material
- 8.4.5. Market size and forecast, by Closure Type
- 8.4.6. Market size and forecast, by country
- 8.4.6.1. China
- 8.4.6.1.1. Market size and forecast, by Capacity
- 8.4.6.1.2. Market size and forecast, by Application
- 8.4.6.1.3. Market size and forecast, by Material
- 8.4.6.1.4. Market size and forecast, by Closure Type
- 8.4.6.2. Japan
- 8.4.6.2.1. Market size and forecast, by Capacity
- 8.4.6.2.2. Market size and forecast, by Application
- 8.4.6.2.3. Market size and forecast, by Material
- 8.4.6.2.4. Market size and forecast, by Closure Type
- 8.4.6.3. India
- 8.4.6.3.1. Market size and forecast, by Capacity
- 8.4.6.3.2. Market size and forecast, by Application
- 8.4.6.3.3. Market size and forecast, by Material
- 8.4.6.3.4. Market size and forecast, by Closure Type
- 8.4.6.4. South Korea
- 8.4.6.4.1. Market size and forecast, by Capacity
- 8.4.6.4.2. Market size and forecast, by Application
- 8.4.6.4.3. Market size and forecast, by Material
- 8.4.6.4.4. Market size and forecast, by Closure Type
- 8.4.6.5. Australia
- 8.4.6.5.1. Market size and forecast, by Capacity
- 8.4.6.5.2. Market size and forecast, by Application
- 8.4.6.5.3. Market size and forecast, by Material
- 8.4.6.5.4. Market size and forecast, by Closure Type
- 8.4.6.6. Rest of Asia-Pacific
- 8.4.6.6.1. Market size and forecast, by Capacity
- 8.4.6.6.2. Market size and forecast, by Application
- 8.4.6.6.3. Market size and forecast, by Material
- 8.4.6.6.4. Market size and forecast, by Closure Type
- 8.5. LAMEA
- 8.5.1. Key market trends, growth factors and opportunities
- 8.5.2. Market size and forecast, by Capacity
- 8.5.3. Market size and forecast, by Application
- 8.5.4. Market size and forecast, by Material
- 8.5.5. Market size and forecast, by Closure Type
- 8.5.6. Market size and forecast, by country
- 8.5.6.1. Brazil
- 8.5.6.1.1. Market size and forecast, by Capacity
- 8.5.6.1.2. Market size and forecast, by Application
- 8.5.6.1.3. Market size and forecast, by Material
- 8.5.6.1.4. Market size and forecast, by Closure Type
- 8.5.6.2. Saudi Arabia
- 8.5.6.2.1. Market size and forecast, by Capacity
- 8.5.6.2.2. Market size and forecast, by Application
- 8.5.6.2.3. Market size and forecast, by Material
- 8.5.6.2.4. Market size and forecast, by Closure Type
- 8.5.6.3. UAE
- 8.5.6.3.1. Market size and forecast, by Capacity
- 8.5.6.3.2. Market size and forecast, by Application
- 8.5.6.3.3. Market size and forecast, by Material
- 8.5.6.3.4. Market size and forecast, by Closure Type
- 8.5.6.4. South Africa
- 8.5.6.4.1. Market size and forecast, by Capacity
- 8.5.6.4.2. Market size and forecast, by Application
- 8.5.6.4.3. Market size and forecast, by Material
- 8.5.6.4.4. Market size and forecast, by Closure Type
- 8.5.6.5. Rest of LAMEA
- 8.5.6.5.1. Market size and forecast, by Capacity
- 8.5.6.5.2. Market size and forecast, by Application
- 8.5.6.5.3. Market size and forecast, by Material
- 8.5.6.5.4. Market size and forecast, by Closure Type
CHAPTER 9: COMPETITIVE LANDSCAPE
- 9.1. Introduction
- 9.2. Top winning strategies
- 9.3. Product mapping of top 10 player
- 9.4. Competitive dashboard
- 9.5. Competitive heatmap
- 9.6. Top player positioning, 2022
CHAPTER 10: COMPANY PROFILES
- 10.1. Longshen Industrial
- 10.1.1. Company overview
- 10.1.2. Key executives
- 10.1.3. Company snapshot
- 10.2. Huhtamaki
- 10.2.1. Company overview
- 10.2.2. Key executives
- 10.2.3. Company snapshot
- 10.3. Amcor
- 10.3.1. Company overview
- 10.3.2. Key executives
- 10.3.3. Company snapshot
- 10.4. gerresheimer
- 10.4.1. Company overview
- 10.4.2. Key executives
- 10.4.3. Company snapshot
- 10.5. tupperware brands
- 10.5.1. Company overview
- 10.5.2. Key executives
- 10.5.3. Company snapshot
- 10.6. Maharashtra Industries
- 10.6.1. Company overview
- 10.6.2. Key executives
- 10.6.3. Company snapshot
- 10.7. meadwestvaco
- 10.7.1. Company overview
- 10.7.2. Key executives
- 10.7.3. Company snapshot
- 10.8. bormioli rocco
- 10.8.1. Company overview
- 10.8.2. Key executives
- 10.8.3. Company snapshot
- 10.9. WWP Direct
- 10.9.1. Company overview
- 10.9.2. Key executives
- 10.9.3. Company snapshot
- 10.10. Kadolta Packaging
- 10.10.1. Company overview
- 10.10.2. Key executives
- 10.10.3. Company snapshot
LIST OF TABLES
- TABLE 01. GLOBAL MILK BOTTLE MARKET, BY CAPACITY, 2022-2032 ($THOUSAND)
- TABLE 02. MILK BOTTLE MARKET FOR BELOW 200 ML, BY REGION, 2022-2032 ($THOUSAND)
- TABLE 03. MILK BOTTLE MARKET FOR 200 ML TO 500 ML, BY REGION, 2022-2032 ($THOUSAND)
- TABLE 04. MILK BOTTLE MARKET FOR 500 ML TO 2000 ML, BY REGION, 2022-2032 ($THOUSAND)
- TABLE 05. MILK BOTTLE MARKET FOR ABOVE 2000 ML, BY REGION, 2022-2032 ($THOUSAND)
- TABLE 06. GLOBAL MILK BOTTLE MARKET, BY APPLICATION, 2022-2032 ($THOUSAND)
- TABLE 07. MILK BOTTLE MARKET FOR BABY FEEDING BOTTLE, BY REGION, 2022-2032 ($THOUSAND)
- TABLE 08. MILK BOTTLE MARKET FOR MILK STORE BOTTLE, BY REGION, 2022-2032 ($THOUSAND)
- TABLE 09. GLOBAL MILK BOTTLE MARKET, BY MATERIAL, 2022-2032 ($THOUSAND)
- TABLE 10. MILK BOTTLE MARKET FOR PLASTICS, BY REGION, 2022-2032 ($THOUSAND)
- TABLE 11. MILK BOTTLE MARKET FOR GLASS, BY REGION, 2022-2032 ($THOUSAND)
- TABLE 12. GLOBAL MILK BOTTLE MARKET, BY CLOSURE TYPE, 2022-2032 ($THOUSAND)
- TABLE 13. MILK BOTTLE MARKET FOR SCREW CAP, BY REGION, 2022-2032 ($THOUSAND)
- TABLE 14. MILK BOTTLE MARKET FOR SNAP-ON CAPS, BY REGION, 2022-2032 ($THOUSAND)
- TABLE 15. MILK BOTTLE MARKET FOR OTHERS, BY REGION, 2022-2032 ($THOUSAND)
- TABLE 16. MILK BOTTLE MARKET, BY REGION, 2022-2032 ($THOUSAND)
- TABLE 17. NORTH AMERICA MILK BOTTLE MARKET, BY CAPACITY, 2022-2032 ($THOUSAND)
- TABLE 18. NORTH AMERICA MILK BOTTLE MARKET, BY APPLICATION, 2022-2032 ($THOUSAND)
- TABLE 19. NORTH AMERICA MILK BOTTLE MARKET, BY MATERIAL, 2022-2032 ($THOUSAND)
- TABLE 20. NORTH AMERICA MILK BOTTLE MARKET, BY CLOSURE TYPE, 2022-2032 ($THOUSAND)
- TABLE 21. NORTH AMERICA MILK BOTTLE MARKET, BY COUNTRY, 2022-2032 ($THOUSAND)
- TABLE 22. U.S. MILK BOTTLE MARKET, BY CAPACITY, 2022-2032 ($THOUSAND)
- TABLE 23. U.S. MILK BOTTLE MARKET, BY APPLICATION, 2022-2032 ($THOUSAND)
- TABLE 24. U.S. MILK BOTTLE MARKET, BY MATERIAL, 2022-2032 ($THOUSAND)
- TABLE 25. U.S. MILK BOTTLE MARKET, BY CLOSURE TYPE, 2022-2032 ($THOUSAND)
- TABLE 26. CANADA MILK BOTTLE MARKET, BY CAPACITY, 2022-2032 ($THOUSAND)
- TABLE 27. CANADA MILK BOTTLE MARKET, BY APPLICATION, 2022-2032 ($THOUSAND)
- TABLE 28. CANADA MILK BOTTLE MARKET, BY MATERIAL, 2022-2032 ($THOUSAND)
- TABLE 29. CANADA MILK BOTTLE MARKET, BY CLOSURE TYPE, 2022-2032 ($THOUSAND)
- TABLE 30. MEXICO MILK BOTTLE MARKET, BY CAPACITY, 2022-2032 ($THOUSAND)
- TABLE 31. MEXICO MILK BOTTLE MARKET, BY APPLICATION, 2022-2032 ($THOUSAND)
- TABLE 32. MEXICO MILK BOTTLE MARKET, BY MATERIAL, 2022-2032 ($THOUSAND)
- TABLE 33. MEXICO MILK BOTTLE MARKET, BY CLOSURE TYPE, 2022-2032 ($THOUSAND)
- TABLE 34. EUROPE MILK BOTTLE MARKET, BY CAPACITY, 2022-2032 ($THOUSAND)
- TABLE 35. EUROPE MILK BOTTLE MARKET, BY APPLICATION, 2022-2032 ($THOUSAND)
- TABLE 36. EUROPE MILK BOTTLE MARKET, BY MATERIAL, 2022-2032 ($THOUSAND)
- TABLE 37. EUROPE MILK BOTTLE MARKET, BY CLOSURE TYPE, 2022-2032 ($THOUSAND)
- TABLE 38. EUROPE MILK BOTTLE MARKET, BY COUNTRY, 2022-2032 ($THOUSAND)
- TABLE 39. GERMANY MILK BOTTLE MARKET, BY CAPACITY, 2022-2032 ($THOUSAND)
- TABLE 40. GERMANY MILK BOTTLE MARKET, BY APPLICATION, 2022-2032 ($THOUSAND)
- TABLE 41. GERMANY MILK BOTTLE MARKET, BY MATERIAL, 2022-2032 ($THOUSAND)
- TABLE 42. GERMANY MILK BOTTLE MARKET, BY CLOSURE TYPE, 2022-2032 ($THOUSAND)
- TABLE 43. UK MILK BOTTLE MARKET, BY CAPACITY, 2022-2032 ($THOUSAND)
- TABLE 44. UK MILK BOTTLE MARKET, BY APPLICATION, 2022-2032 ($THOUSAND)
- TABLE 45. UK MILK BOTTLE MARKET, BY MATERIAL, 2022-2032 ($THOUSAND)
- TABLE 46. UK MILK BOTTLE MARKET, BY CLOSURE TYPE, 2022-2032 ($THOUSAND)
- TABLE 47. FRANCE MILK BOTTLE MARKET, BY CAPACITY, 2022-2032 ($THOUSAND)
- TABLE 48. FRANCE MILK BOTTLE MARKET, BY APPLICATION, 2022-2032 ($THOUSAND)
- TABLE 49. FRANCE MILK BOTTLE MARKET, BY MATERIAL, 2022-2032 ($THOUSAND)
- TABLE 50. FRANCE MILK BOTTLE MARKET, BY CLOSURE TYPE, 2022-2032 ($THOUSAND)
- TABLE 51. SPAIN MILK BOTTLE MARKET, BY CAPACITY, 2022-2032 ($THOUSAND)
- TABLE 52. SPAIN MILK BOTTLE MARKET, BY APPLICATION, 2022-2032 ($THOUSAND)
- TABLE 53. SPAIN MILK BOTTLE MARKET, BY MATERIAL, 2022-2032 ($THOUSAND)
- TABLE 54. SPAIN MILK BOTTLE MARKET, BY CLOSURE TYPE, 2022-2032 ($THOUSAND)
- TABLE 55. ITALY MILK BOTTLE MARKET, BY CAPACITY, 2022-2032 ($THOUSAND)
- TABLE 56. ITALY MILK BOTTLE MARKET, BY APPLICATION, 2022-2032 ($THOUSAND)
- TABLE 57. ITALY MILK BOTTLE MARKET, BY MATERIAL, 2022-2032 ($THOUSAND)
- TABLE 58. ITALY MILK BOTTLE MARKET, BY CLOSURE TYPE, 2022-2032 ($THOUSAND)
- TABLE 59. REST OF EUROPE MILK BOTTLE MARKET, BY CAPACITY, 2022-2032 ($THOUSAND)
- TABLE 60. REST OF EUROPE MILK BOTTLE MARKET, BY APPLICATION, 2022-2032 ($THOUSAND)
- TABLE 61. REST OF EUROPE MILK BOTTLE MARKET, BY MATERIAL, 2022-2032 ($THOUSAND)
- TABLE 62. REST OF EUROPE MILK BOTTLE MARKET, BY CLOSURE TYPE, 2022-2032 ($THOUSAND)
- TABLE 63. ASIA-PACIFIC MILK BOTTLE MARKET, BY CAPACITY, 2022-2032 ($THOUSAND)
- TABLE 64. ASIA-PACIFIC MILK BOTTLE MARKET, BY APPLICATION, 2022-2032 ($THOUSAND)
- TABLE 65. ASIA-PACIFIC MILK BOTTLE MARKET, BY MATERIAL, 2022-2032 ($THOUSAND)
- TABLE 66. ASIA-PACIFIC MILK BOTTLE MARKET, BY CLOSURE TYPE, 2022-2032 ($THOUSAND)
- TABLE 67. ASIA-PACIFIC MILK BOTTLE MARKET, BY COUNTRY, 2022-2032 ($THOUSAND)
- TABLE 68. CHINA MILK BOTTLE MARKET, BY CAPACITY, 2022-2032 ($THOUSAND)
- TABLE 69. CHINA MILK BOTTLE MARKET, BY APPLICATION, 2022-2032 ($THOUSAND)
- TABLE 70. CHINA MILK BOTTLE MARKET, BY MATERIAL, 2022-2032 ($THOUSAND)
- TABLE 71. CHINA MILK BOTTLE MARKET, BY CLOSURE TYPE, 2022-2032 ($THOUSAND)
- TABLE 72. JAPAN MILK BOTTLE MARKET, BY CAPACITY, 2022-2032 ($THOUSAND)
- TABLE 73. JAPAN MILK BOTTLE MARKET, BY APPLICATION, 2022-2032 ($THOUSAND)
- TABLE 74. JAPAN MILK BOTTLE MARKET, BY MATERIAL, 2022-2032 ($THOUSAND)
- TABLE 75. JAPAN MILK BOTTLE MARKET, BY CLOSURE TYPE, 2022-2032 ($THOUSAND)
- TABLE 76. INDIA MILK BOTTLE MARKET, BY CAPACITY, 2022-2032 ($THOUSAND)
- TABLE 77. INDIA MILK BOTTLE MARKET, BY APPLICATION, 2022-2032 ($THOUSAND)
- TABLE 78. INDIA MILK BOTTLE MARKET, BY MATERIAL, 2022-2032 ($THOUSAND)
- TABLE 79. INDIA MILK BOTTLE MARKET, BY CLOSURE TYPE, 2022-2032 ($THOUSAND)
- TABLE 80. SOUTH KOREA MILK BOTTLE MARKET, BY CAPACITY, 2022-2032 ($THOUSAND)
- TABLE 81. SOUTH KOREA MILK BOTTLE MARKET, BY APPLICATION, 2022-2032 ($THOUSAND)
- TABLE 82. SOUTH KOREA MILK BOTTLE MARKET, BY MATERIAL, 2022-2032 ($THOUSAND)
- TABLE 83. SOUTH KOREA MILK BOTTLE MARKET, BY CLOSURE TYPE, 2022-2032 ($THOUSAND)
- TABLE 84. AUSTRALIA MILK BOTTLE MARKET, BY CAPACITY, 2022-2032 ($THOUSAND)
- TABLE 85. AUSTRALIA MILK BOTTLE MARKET, BY APPLICATION, 2022-2032 ($THOUSAND)
- TABLE 86. AUSTRALIA MILK BOTTLE MARKET, BY MATERIAL, 2022-2032 ($THOUSAND)
- TABLE 87. AUSTRALIA MILK BOTTLE MARKET, BY CLOSURE TYPE, 2022-2032 ($THOUSAND)
- TABLE 88. REST OF ASIA-PACIFIC MILK BOTTLE MARKET, BY CAPACITY, 2022-2032 ($THOUSAND)
- TABLE 89. REST OF ASIA-PACIFIC MILK BOTTLE MARKET, BY APPLICATION, 2022-2032 ($THOUSAND)
- TABLE 90. REST OF ASIA-PACIFIC MILK BOTTLE MARKET, BY MATERIAL, 2022-2032 ($THOUSAND)
- TABLE 91. REST OF ASIA-PACIFIC MILK BOTTLE MARKET, BY CLOSURE TYPE, 2022-2032 ($THOUSAND)
- TABLE 92. LAMEA MILK BOTTLE MARKET, BY CAPACITY, 2022-2032 ($THOUSAND)
- TABLE 93. LAMEA MILK BOTTLE MARKET, BY APPLICATION, 2022-2032 ($THOUSAND)
- TABLE 94. LAMEA MILK BOTTLE MARKET, BY MATERIAL, 2022-2032 ($THOUSAND)
- TABLE 95. LAMEA MILK BOTTLE MARKET, BY CLOSURE TYPE, 2022-2032 ($THOUSAND)
- TABLE 96. LAMEA MILK BOTTLE MARKET, BY COUNTRY, 2022-2032 ($THOUSAND)
- TABLE 97. BRAZIL MILK BOTTLE MARKET, BY CAPACITY, 2022-2032 ($THOUSAND)
- TABLE 98. BRAZIL MILK BOTTLE MARKET, BY APPLICATION, 2022-2032 ($THOUSAND)
- TABLE 99. BRAZIL MILK BOTTLE MARKET, BY MATERIAL, 2022-2032 ($THOUSAND)
- TABLE 100. BRAZIL MILK BOTTLE MARKET, BY CLOSURE TYPE, 2022-2032 ($THOUSAND)
- TABLE 101. SAUDI ARABIA MILK BOTTLE MARKET, BY CAPACITY, 2022-2032 ($THOUSAND)
- TABLE 102. SAUDI ARABIA MILK BOTTLE MARKET, BY APPLICATION, 2022-2032 ($THOUSAND)
- TABLE 103. SAUDI ARABIA MILK BOTTLE MARKET, BY MATERIAL, 2022-2032 ($THOUSAND)
- TABLE 104. SAUDI ARABIA MILK BOTTLE MARKET, BY CLOSURE TYPE, 2022-2032 ($THOUSAND)
- TABLE 105. UAE MILK BOTTLE MARKET, BY CAPACITY, 2022-2032 ($THOUSAND)
- TABLE 106. UAE MILK BOTTLE MARKET, BY APPLICATION, 2022-2032 ($THOUSAND)
- TABLE 107. UAE MILK BOTTLE MARKET, BY MATERIAL, 2022-2032 ($THOUSAND)
- TABLE 108. UAE MILK BOTTLE MARKET, BY CLOSURE TYPE, 2022-2032 ($THOUSAND)
- TABLE 109. SOUTH AFRICA MILK BOTTLE MARKET, BY CAPACITY, 2022-2032 ($THOUSAND)
- TABLE 110. SOUTH AFRICA MILK BOTTLE MARKET, BY APPLICATION, 2022-2032 ($THOUSAND)
- TABLE 111. SOUTH AFRICA MILK BOTTLE MARKET, BY MATERIAL, 2022-2032 ($THOUSAND)
- TABLE 112. SOUTH AFRICA MILK BOTTLE MARKET, BY CLOSURE TYPE, 2022-2032 ($THOUSAND)
- TABLE 113. REST OF LAMEA MILK BOTTLE MARKET, BY CAPACITY, 2022-2032 ($THOUSAND)
- TABLE 114. REST OF LAMEA MILK BOTTLE MARKET, BY APPLICATION, 2022-2032 ($THOUSAND)
- TABLE 115. REST OF LAMEA MILK BOTTLE MARKET, BY MATERIAL, 2022-2032 ($THOUSAND)
- TABLE 116. REST OF LAMEA MILK BOTTLE MARKET, BY CLOSURE TYPE, 2022-2032 ($THOUSAND)
- TABLE 117. LONGSHEN INDUSTRIAL: KEY EXECUTIVES
- TABLE 118. LONGSHEN INDUSTRIAL: COMPANY SNAPSHOT
- TABLE 119. HUHTAMAKI: KEY EXECUTIVES
- TABLE 120. HUHTAMAKI: COMPANY SNAPSHOT
- TABLE 121. AMCOR: KEY EXECUTIVES
- TABLE 122. AMCOR: COMPANY SNAPSHOT
- TABLE 123. GERRESHEIMER: KEY EXECUTIVES
- TABLE 124. GERRESHEIMER: COMPANY SNAPSHOT
- TABLE 125. TUPPERWARE BRANDS: KEY EXECUTIVES
- TABLE 126. TUPPERWARE BRANDS: COMPANY SNAPSHOT
- TABLE 127. MAHARASHTRA INDUSTRIES: KEY EXECUTIVES
- TABLE 128. MAHARASHTRA INDUSTRIES: COMPANY SNAPSHOT
- TABLE 129. MEADWESTVACO: KEY EXECUTIVES
- TABLE 130. MEADWESTVACO: COMPANY SNAPSHOT
- TABLE 131. BORMIOLI ROCCO: KEY EXECUTIVES
- TABLE 132. BORMIOLI ROCCO: COMPANY SNAPSHOT
- TABLE 133. WWP DIRECT: KEY EXECUTIVES
- TABLE 134. WWP DIRECT: COMPANY SNAPSHOT
- TABLE 135. KADOLTA PACKAGING: KEY EXECUTIVES
- TABLE 136. KADOLTA PACKAGING: COMPANY SNAPSHOT
LIST OF FIGURES
- FIGURE 01. MILK BOTTLE MARKET, 2022-2032
- FIGURE 02. SEGMENTATION OF MILK BOTTLE MARKET,2022-2032
- FIGURE 03. TOP IMPACTING FACTORS IN MILK BOTTLE MARKET
- FIGURE 04. TOP INVESTMENT POCKETS IN MILK BOTTLE MARKET (2023-2032)
- FIGURE 05. BARGAINING POWER OF SUPPLIERS
- FIGURE 06. BARGAINING POWER OF BUYERS
- FIGURE 07. THREAT OF SUBSTITUTION
- FIGURE 08. THREAT OF SUBSTITUTION
- FIGURE 09. COMPETITIVE RIVALRY
- FIGURE 10. GLOBAL MILK BOTTLE MARKET:DRIVERS, RESTRAINTS AND OPPORTUNITIES
- FIGURE 11. IMPACT OF KEY REGULATION: MILK BOTTLE MARKET
- FIGURE 12. MILK BOTTLE MARKET, BY CAPACITY, 2022 AND 2032(%)
- FIGURE 13. COMPARATIVE SHARE ANALYSIS OF MILK BOTTLE MARKET FOR BELOW 200 ML, BY COUNTRY 2022 AND 2032(%)
- FIGURE 14. COMPARATIVE SHARE ANALYSIS OF MILK BOTTLE MARKET FOR 200 ML TO 500 ML, BY COUNTRY 2022 AND 2032(%)
- FIGURE 15. COMPARATIVE SHARE ANALYSIS OF MILK BOTTLE MARKET FOR 500 ML TO 2000 ML, BY COUNTRY 2022 AND 2032(%)
- FIGURE 16. COMPARATIVE SHARE ANALYSIS OF MILK BOTTLE MARKET FOR ABOVE 2000 ML, BY COUNTRY 2022 AND 2032(%)
- FIGURE 17. MILK BOTTLE MARKET, BY APPLICATION, 2022 AND 2032(%)
- FIGURE 18. COMPARATIVE SHARE ANALYSIS OF MILK BOTTLE MARKET FOR BABY FEEDING BOTTLE, BY COUNTRY 2022 AND 2032(%)
- FIGURE 19. COMPARATIVE SHARE ANALYSIS OF MILK BOTTLE MARKET FOR MILK STORE BOTTLE, BY COUNTRY 2022 AND 2032(%)
- FIGURE 20. MILK BOTTLE MARKET, BY MATERIAL, 2022 AND 2032(%)
- FIGURE 21. COMPARATIVE SHARE ANALYSIS OF MILK BOTTLE MARKET FOR PLASTICS, BY COUNTRY 2022 AND 2032(%)
- FIGURE 22. COMPARATIVE SHARE ANALYSIS OF MILK BOTTLE MARKET FOR GLASS, BY COUNTRY 2022 AND 2032(%)
- FIGURE 23. MILK BOTTLE MARKET, BY CLOSURE TYPE, 2022 AND 2032(%)
- FIGURE 24. COMPARATIVE SHARE ANALYSIS OF MILK BOTTLE MARKET FOR SCREW CAP, BY COUNTRY 2022 AND 2032(%)
- FIGURE 25. COMPARATIVE SHARE ANALYSIS OF MILK BOTTLE MARKET FOR SNAP-ON CAPS, BY COUNTRY 2022 AND 2032(%)
- FIGURE 26. COMPARATIVE SHARE ANALYSIS OF MILK BOTTLE MARKET FOR OTHERS, BY COUNTRY 2022 AND 2032(%)
- FIGURE 27. MILK BOTTLE MARKET BY REGION, 2022 AND 2032(%)
- FIGURE 28. U.S. MILK BOTTLE MARKET, 2022-2032 ($THOUSAND)
- FIGURE 29. CANADA MILK BOTTLE MARKET, 2022-2032 ($THOUSAND)
- FIGURE 30. MEXICO MILK BOTTLE MARKET, 2022-2032 ($THOUSAND)
- FIGURE 31. GERMANY MILK BOTTLE MARKET, 2022-2032 ($THOUSAND)
- FIGURE 32. UK MILK BOTTLE MARKET, 2022-2032 ($THOUSAND)
- FIGURE 33. FRANCE MILK BOTTLE MARKET, 2022-2032 ($THOUSAND)
- FIGURE 34. SPAIN MILK BOTTLE MARKET, 2022-2032 ($THOUSAND)
- FIGURE 35. ITALY MILK BOTTLE MARKET, 2022-2032 ($THOUSAND)
- FIGURE 36. REST OF EUROPE MILK BOTTLE MARKET, 2022-2032 ($THOUSAND)
- FIGURE 37. CHINA MILK BOTTLE MARKET, 2022-2032 ($THOUSAND)
- FIGURE 38. JAPAN MILK BOTTLE MARKET, 2022-2032 ($THOUSAND)
- FIGURE 39. INDIA MILK BOTTLE MARKET, 2022-2032 ($THOUSAND)
- FIGURE 40. SOUTH KOREA MILK BOTTLE MARKET, 2022-2032 ($THOUSAND)
- FIGURE 41. AUSTRALIA MILK BOTTLE MARKET, 2022-2032 ($THOUSAND)
- FIGURE 42. REST OF ASIA-PACIFIC MILK BOTTLE MARKET, 2022-2032 ($THOUSAND)
- FIGURE 43. BRAZIL MILK BOTTLE MARKET, 2022-2032 ($THOUSAND)
- FIGURE 44. SAUDI ARABIA MILK BOTTLE MARKET, 2022-2032 ($THOUSAND)
- FIGURE 45. UAE MILK BOTTLE MARKET, 2022-2032 ($THOUSAND)
- FIGURE 46. SOUTH AFRICA MILK BOTTLE MARKET, 2022-2032 ($THOUSAND)
- FIGURE 47. REST OF LAMEA MILK BOTTLE MARKET, 2022-2032 ($THOUSAND)
- FIGURE 48. PRODUCT MAPPING OF TOP 10 PLAYERS
- FIGURE 49. COMPETITIVE DASHBOARD
- FIGURE 50. COMPETITIVE HEATMAP: MILK BOTTLE MARKET
- FIGURE 51. TOP PLAYER POSITIONING, 2022

