
PUBLISHER: Allied Market Research | PRODUCT CODE: 1472266

PUBLISHER: Allied Market Research | PRODUCT CODE: 1472266
Hazmat Plastic Packaging Market By Product Type (Drums, Intermediate bulk containers (IBCs), Pails, Bottles, Jerrycan), By End-user Industry (Chemicals, Pharmaceuticals, Oil and Gas, Others): Global Opportunity Analysis and Industry Forecast, 2023-2032
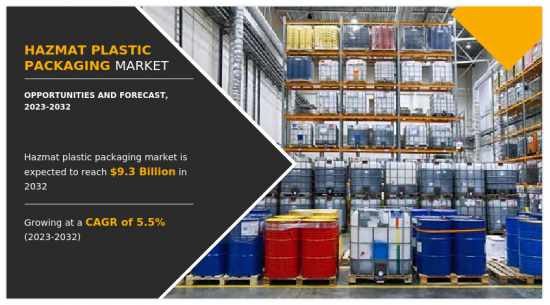
The hazmat plastic packaging market was valued for $5,484.10 million in 2022 and is estimated to reach $9,290.30 million by 2032, exhibiting a CAGR of 5.5% from 2023 to 2032. Hazmat plastic packaging, also referred to as hazardous material plastic packaging, emerged as an effective solution in the protective packaging segment. The hazmat plastic packaging is meant for the storage of hazardous substances and material, which need to be transported across borders. Shipping of hazardous material is not only considered dangerous but also requires a lot of regulations and guidelines to be transported.
Factors such as safety compliance, protection of workers and assets, environmental stewardship, risk management, regulatory compliance, and supply chain efficiency drives the hazmat plastic packaging market. Changes in compliance requirements may necessitate modifications to packaging designs, materials, labeling, and documentation, influencing product development and market dynamics.
Changes in trade policies, tariffs, and international trade agreements can impact the global supply chain and market dynamics for hazmat plastic packaging materials and products. Shifts in trade patterns, import/export regulations, and geopolitical tensions may influence sourcing strategies, pricing, and market competitiveness for industry stakeholders.
Ensuring the safe and secure handling of hazardous materials is a top priority for industries that deal with such substances. The hazmat plastic packaging provides containment, protection, and risk mitigation measures to prevent leaks, spills, and accidents that could harm workers, assets, and the environment. Companies invest in hazmat plastic packaging to minimize risks, liabilities, and potential damages associated with hazardous materials.
Hazardous materials are used in various industries such as chemicals, manufacturing, oil and gas, pharmaceuticals, agriculture, and transportation. These industries rely on hazmat plastic packaging solutions to safely store, transport, and handle hazardous substances during production, distribution, and usage. The demand for hazmat plastic packaging is driven by the needs of these industries to ensure operational safety, regulatory compliance, and environmental stewardship. Such factors are expected to offer lucrative opportunities for the market growth during the forecast period.
The hazmat plastic packaging market is segmented on the basis of product type, end-user industry, and region. By product type, it is divided into drums, intermediate bulk containers (IBCs), pails, bottles, and Jerrycan. By end-user industry, it is divided into chemical, pharmaceutical, oil & gas, and others. By region, it is analyzed across North America, Europe, Asia-Pacific, and LAMEA.
The major players that operate in the global market have adopted key strategies such as product launch, acquisition, expansion, and product development to strengthen their market outreach and sustain the stiff competition in the market.
Competition Analysis
The major players profiled in the hazmat plastic packaging market include Berlin Packaging, Berry Global Inc., C.L. Smith, Cjk, Crateco, Fibrestar Drums Limited, Greif, Mauser Group, Peninsula Drums, and Sabu.
Key Benefits for Stakeholders
The report provides an extensive analysis of the current and emerging hazmat plastic packaging market trends and dynamics.
In-depth market analysis is conducted by constructing market estimations for the key market segments between 2022 and 2032.
Extensive analysis of the hazmat plastic packaging market is conducted by following key product positioning and monitoring of the top competitors within the market framework.
A comprehensive analysis of all regions is provided to determine the prevailing opportunities.
The hazmat plastic packaging market forecast analysis from 2023 to 2032 is included in the report.
The key market players within hazmat plastic packaging market are profiled in this report and their strategies are analyzed thoroughly, which help understand the competitive outlook of the hazmat plastic packaging industry.
Additional benefits you will get with this purchase are:
- Quarterly Update and* (only available with a corporate license, on listed price)
- 5 additional Company Profile of client Choice pre- or Post-purchase, as a free update.
- Free Upcoming Version on the Purchase of Five and Enterprise User License.
- 16 analyst hours of support* (post-purchase, if you find additional data requirements upon review of the report, you may receive support amounting to 16 analyst hours to solve questions, and post-sale queries)
- 15% Free Customization* (in case the scope or segment of the report does not match your requirements, 15% is equivalent to 3 working days of free work, applicable once)
- Free data Pack on the Five and Enterprise User License. (Excel version of the report)
- Free Updated report if the report is 6-12 months old or older.
- 24-hour priority response*
- Free Industry updates and white papers.
Possible Customization with this report (with additional cost and timeline, please talk to the sales executive to know more)
- Investment Opportunities
- Upcoming/New Entrant by Regions
- Technology Trend Analysis
- Market share analysis of players by products/segments
- Pain Point Analysis
- Additional company profiles with specific to client's interest
- Additional country or region analysis- market size and forecast
- Average Selling Price Analysis / Price Point Analysis
- Brands Share Analysis
- Criss-cross segment analysis- market size and forecast
- Expanded list for Company Profiles
- Historic market data
- Key player details (including location, contact details, supplier/vendor network etc. in excel format)
- Market share analysis of players at global/region/country level
- SWOT Analysis
- Volume Market Size and Forecast
Key Market Segments
By Product Type
- Drums
- Intermediate bulk containers (IBCs)
- Pails
- Bottles
- Jerrycan
By End-user Industry
- Chemicals
- Pharmaceuticals
- Oil and Gas
- Others
By Region
- North America
- U.S.
- Canada
- Mexico
- Europe
- Germany
- France
- UK
- Italy
- Rest of Europe
- Asia-Pacific
- China
- India
- Japan
- South Korea
- Rest of Asia-Pacific
- LAMEA
- Latin America
- Middle East
- Africa
Key Market Players:
- Greif, Inc.
- C.L. Smith Company
- CJK Packaging Limited
- Fibrestar Drums Limited
- Sohner Kunststofftechnik GmbH
- MAUSER Corporate GmbH
- Berry Global Inc.
- Berlin Packaging LLC
- Peninsula Drums LLC
- Crateco Pack LLC
TABLE OF CONTENTS
CHAPTER 1: INTRODUCTION
- 1.1. Report description
- 1.2. Key market segments
- 1.3. Key benefits to the stakeholders
- 1.4. Research methodology
- 1.4.1. Primary research
- 1.4.2. Secondary research
- 1.4.3. Analyst tools and models
CHAPTER 2: EXECUTIVE SUMMARY
- 2.1. CXO perspective
CHAPTER 3: MARKET OVERVIEW
- 3.1. Market definition and scope
- 3.2. Key findings
- 3.2.1. Top impacting factors
- 3.2.2. Top investment pockets
- 3.3. Porter's five forces analysis
- 3.3.1. Low bargaining power of suppliers
- 3.3.2. Low threat of new entrants
- 3.3.3. Low threat of substitutes
- 3.3.4. Low intensity of rivalry
- 3.3.5. Low bargaining power of buyers
- 3.4. Market dynamics
- 3.4.1. Drivers
- 3.4.1.1. Growing regulatory compliance
- 3.4.1.2. Rise in awareness about safe transportation of hazardous goods
- 3.4.1.3. Industrial expansion in developing countries
- 3.4.2. Restraints
- 3.4.2.1. Hazardous particles released during manufacturing
- 3.4.3. Opportunities
- 3.4.3.1. Growing demand for innovative packaging technology
- 3.4.1. Drivers
CHAPTER 4: HAZMAT PLASTIC PACKAGING MARKET, BY PRODUCT TYPE
- 4.1. Overview
- 4.1.1. Market size and forecast
- 4.2. Drums
- 4.2.1. Key market trends, growth factors and opportunities
- 4.2.2. Market size and forecast, by region
- 4.2.3. Market share analysis by country
- 4.3. Intermediate bulk containers (IBCs)
- 4.3.1. Key market trends, growth factors and opportunities
- 4.3.2. Market size and forecast, by region
- 4.3.3. Market share analysis by country
- 4.4. Pails
- 4.4.1. Key market trends, growth factors and opportunities
- 4.4.2. Market size and forecast, by region
- 4.4.3. Market share analysis by country
- 4.5. Bottles
- 4.5.1. Key market trends, growth factors and opportunities
- 4.5.2. Market size and forecast, by region
- 4.5.3. Market share analysis by country
- 4.6. Jerrycan
- 4.6.1. Key market trends, growth factors and opportunities
- 4.6.2. Market size and forecast, by region
- 4.6.3. Market share analysis by country
CHAPTER 5: HAZMAT PLASTIC PACKAGING MARKET, BY END-USER INDUSTRY
- 5.1. Overview
- 5.1.1. Market size and forecast
- 5.2. Chemicals
- 5.2.1. Key market trends, growth factors and opportunities
- 5.2.2. Market size and forecast, by region
- 5.2.3. Market share analysis by country
- 5.3. Pharmaceuticals
- 5.3.1. Key market trends, growth factors and opportunities
- 5.3.2. Market size and forecast, by region
- 5.3.3. Market share analysis by country
- 5.4. Oil and Gas
- 5.4.1. Key market trends, growth factors and opportunities
- 5.4.2. Market size and forecast, by region
- 5.4.3. Market share analysis by country
- 5.5. Others
- 5.5.1. Key market trends, growth factors and opportunities
- 5.5.2. Market size and forecast, by region
- 5.5.3. Market share analysis by country
CHAPTER 6: HAZMAT PLASTIC PACKAGING MARKET, BY REGION
- 6.1. Overview
- 6.1.1. Market size and forecast By Region
- 6.2. North America
- 6.2.1. Key market trends, growth factors and opportunities
- 6.2.2. Market size and forecast, by Product Type
- 6.2.3. Market size and forecast, by End-user Industry
- 6.2.4. Market size and forecast, by country
- 6.2.4.1. U.S.
- 6.2.4.1.1. Market size and forecast, by Product Type
- 6.2.4.1.2. Market size and forecast, by End-user Industry
- 6.2.4.2. Canada
- 6.2.4.2.1. Market size and forecast, by Product Type
- 6.2.4.2.2. Market size and forecast, by End-user Industry
- 6.2.4.3. Mexico
- 6.2.4.3.1. Market size and forecast, by Product Type
- 6.2.4.3.2. Market size and forecast, by End-user Industry
- 6.3. Europe
- 6.3.1. Key market trends, growth factors and opportunities
- 6.3.2. Market size and forecast, by Product Type
- 6.3.3. Market size and forecast, by End-user Industry
- 6.3.4. Market size and forecast, by country
- 6.3.4.1. Germany
- 6.3.4.1.1. Market size and forecast, by Product Type
- 6.3.4.1.2. Market size and forecast, by End-user Industry
- 6.3.4.2. France
- 6.3.4.2.1. Market size and forecast, by Product Type
- 6.3.4.2.2. Market size and forecast, by End-user Industry
- 6.3.4.3. UK
- 6.3.4.3.1. Market size and forecast, by Product Type
- 6.3.4.3.2. Market size and forecast, by End-user Industry
- 6.3.4.4. Italy
- 6.3.4.4.1. Market size and forecast, by Product Type
- 6.3.4.4.2. Market size and forecast, by End-user Industry
- 6.3.4.5. Rest of Europe
- 6.3.4.5.1. Market size and forecast, by Product Type
- 6.3.4.5.2. Market size and forecast, by End-user Industry
- 6.4. Asia-Pacific
- 6.4.1. Key market trends, growth factors and opportunities
- 6.4.2. Market size and forecast, by Product Type
- 6.4.3. Market size and forecast, by End-user Industry
- 6.4.4. Market size and forecast, by country
- 6.4.4.1. China
- 6.4.4.1.1. Market size and forecast, by Product Type
- 6.4.4.1.2. Market size and forecast, by End-user Industry
- 6.4.4.2. India
- 6.4.4.2.1. Market size and forecast, by Product Type
- 6.4.4.2.2. Market size and forecast, by End-user Industry
- 6.4.4.3. Japan
- 6.4.4.3.1. Market size and forecast, by Product Type
- 6.4.4.3.2. Market size and forecast, by End-user Industry
- 6.4.4.4. South Korea
- 6.4.4.4.1. Market size and forecast, by Product Type
- 6.4.4.4.2. Market size and forecast, by End-user Industry
- 6.4.4.5. Rest of Asia-Pacific
- 6.4.4.5.1. Market size and forecast, by Product Type
- 6.4.4.5.2. Market size and forecast, by End-user Industry
- 6.5. LAMEA
- 6.5.1. Key market trends, growth factors and opportunities
- 6.5.2. Market size and forecast, by Product Type
- 6.5.3. Market size and forecast, by End-user Industry
- 6.5.4. Market size and forecast, by country
- 6.5.4.1. Latin America
- 6.5.4.1.1. Market size and forecast, by Product Type
- 6.5.4.1.2. Market size and forecast, by End-user Industry
- 6.5.4.2. Middle East
- 6.5.4.2.1. Market size and forecast, by Product Type
- 6.5.4.2.2. Market size and forecast, by End-user Industry
- 6.5.4.3. Africa
- 6.5.4.3.1. Market size and forecast, by Product Type
- 6.5.4.3.2. Market size and forecast, by End-user Industry
CHAPTER 7: COMPETITIVE LANDSCAPE
- 7.1. Introduction
- 7.2. Top winning strategies
- 7.3. Product mapping of top 10 player
- 7.4. Competitive dashboard
- 7.5. Competitive heatmap
- 7.6. Top player positioning, 2022
CHAPTER 8: COMPANY PROFILES
- 8.1. Berlin Packaging LLC
- 8.1.1. Company overview
- 8.1.2. Key executives
- 8.1.3. Company snapshot
- 8.1.4. Operating business segments
- 8.1.5. Product portfolio
- 8.1.6. Key strategic moves and developments
- 8.2. Berry Global Inc.
- 8.2.1. Company overview
- 8.2.2. Key executives
- 8.2.3. Company snapshot
- 8.2.4. Operating business segments
- 8.2.5. Product portfolio
- 8.2.6. Business performance
- 8.2.7. Key strategic moves and developments
- 8.3. CJK Packaging Limited
- 8.3.1. Company overview
- 8.3.2. Key executives
- 8.3.3. Company snapshot
- 8.3.4. Operating business segments
- 8.3.5. Product portfolio
- 8.4. Crateco Pack LLC
- 8.4.1. Company overview
- 8.4.2. Key executives
- 8.4.3. Company snapshot
- 8.4.4. Operating business segments
- 8.4.5. Product portfolio
- 8.5. Fibrestar Drums Limited
- 8.5.1. Company overview
- 8.5.2. Key executives
- 8.5.3. Company snapshot
- 8.5.4. Operating business segments
- 8.5.5. Product portfolio
- 8.6. Greif, Inc.
- 8.6.1. Company overview
- 8.6.2. Key executives
- 8.6.3. Company snapshot
- 8.6.4. Operating business segments
- 8.6.5. Product portfolio
- 8.6.6. Business performance
- 8.7. MAUSER Corporate GmbH
- 8.7.1. Company overview
- 8.7.2. Key executives
- 8.7.3. Company snapshot
- 8.7.4. Operating business segments
- 8.7.5. Product portfolio
- 8.8. Peninsula Drums LLC
- 8.8.1. Company overview
- 8.8.2. Key executives
- 8.8.3. Company snapshot
- 8.8.4. Operating business segments
- 8.8.5. Product portfolio
- 8.9. C.L. Smith Company
- 8.9.1. Company overview
- 8.9.2. Key executives
- 8.9.3. Company snapshot
- 8.9.4. Operating business segments
- 8.9.5. Product portfolio
- 8.9.6. Key strategic moves and developments
- 8.10. Sohner Kunststofftechnik GmbH
- 8.10.1. Company overview
- 8.10.2. Key executives
- 8.10.3. Company snapshot
- 8.10.4. Operating business segments
- 8.10.5. Product portfolio
LIST OF TABLES
- TABLE 01. GLOBAL HAZMAT PLASTIC PACKAGING MARKET, BY PRODUCT TYPE, 2022-2032 ($MILLION)
- TABLE 02. HAZMAT PLASTIC PACKAGING MARKET FOR DRUMS, BY REGION, 2022-2032 ($MILLION)
- TABLE 03. HAZMAT PLASTIC PACKAGING MARKET FOR INTERMEDIATE BULK CONTAINERS (IBCS), BY REGION, 2022-2032 ($MILLION)
- TABLE 04. HAZMAT PLASTIC PACKAGING MARKET FOR PAILS, BY REGION, 2022-2032 ($MILLION)
- TABLE 05. HAZMAT PLASTIC PACKAGING MARKET FOR BOTTLES, BY REGION, 2022-2032 ($MILLION)
- TABLE 06. HAZMAT PLASTIC PACKAGING MARKET FOR JERRYCAN, BY REGION, 2022-2032 ($MILLION)
- TABLE 07. GLOBAL HAZMAT PLASTIC PACKAGING MARKET, BY END-USER INDUSTRY, 2022-2032 ($MILLION)
- TABLE 08. HAZMAT PLASTIC PACKAGING MARKET FOR CHEMICALS, BY REGION, 2022-2032 ($MILLION)
- TABLE 09. HAZMAT PLASTIC PACKAGING MARKET FOR PHARMACEUTICALS, BY REGION, 2022-2032 ($MILLION)
- TABLE 10. HAZMAT PLASTIC PACKAGING MARKET FOR OIL AND GAS, BY REGION, 2022-2032 ($MILLION)
- TABLE 11. HAZMAT PLASTIC PACKAGING MARKET FOR OTHERS, BY REGION, 2022-2032 ($MILLION)
- TABLE 12. HAZMAT PLASTIC PACKAGING MARKET, BY REGION, 2022-2032 ($MILLION)
- TABLE 13. NORTH AMERICA HAZMAT PLASTIC PACKAGING MARKET, BY PRODUCT TYPE, 2022-2032 ($MILLION)
- TABLE 14. NORTH AMERICA HAZMAT PLASTIC PACKAGING MARKET, BY END-USER INDUSTRY, 2022-2032 ($MILLION)
- TABLE 15. NORTH AMERICA HAZMAT PLASTIC PACKAGING MARKET, BY COUNTRY, 2022-2032 ($MILLION)
- TABLE 16. U.S. HAZMAT PLASTIC PACKAGING MARKET, BY PRODUCT TYPE, 2022-2032 ($MILLION)
- TABLE 17. U.S. HAZMAT PLASTIC PACKAGING MARKET, BY END-USER INDUSTRY, 2022-2032 ($MILLION)
- TABLE 18. CANADA HAZMAT PLASTIC PACKAGING MARKET, BY PRODUCT TYPE, 2022-2032 ($MILLION)
- TABLE 19. CANADA HAZMAT PLASTIC PACKAGING MARKET, BY END-USER INDUSTRY, 2022-2032 ($MILLION)
- TABLE 20. MEXICO HAZMAT PLASTIC PACKAGING MARKET, BY PRODUCT TYPE, 2022-2032 ($MILLION)
- TABLE 21. MEXICO HAZMAT PLASTIC PACKAGING MARKET, BY END-USER INDUSTRY, 2022-2032 ($MILLION)
- TABLE 22. EUROPE HAZMAT PLASTIC PACKAGING MARKET, BY PRODUCT TYPE, 2022-2032 ($MILLION)
- TABLE 23. EUROPE HAZMAT PLASTIC PACKAGING MARKET, BY END-USER INDUSTRY, 2022-2032 ($MILLION)
- TABLE 24. EUROPE HAZMAT PLASTIC PACKAGING MARKET, BY COUNTRY, 2022-2032 ($MILLION)
- TABLE 25. GERMANY HAZMAT PLASTIC PACKAGING MARKET, BY PRODUCT TYPE, 2022-2032 ($MILLION)
- TABLE 26. GERMANY HAZMAT PLASTIC PACKAGING MARKET, BY END-USER INDUSTRY, 2022-2032 ($MILLION)
- TABLE 27. FRANCE HAZMAT PLASTIC PACKAGING MARKET, BY PRODUCT TYPE, 2022-2032 ($MILLION)
- TABLE 28. FRANCE HAZMAT PLASTIC PACKAGING MARKET, BY END-USER INDUSTRY, 2022-2032 ($MILLION)
- TABLE 29. UK HAZMAT PLASTIC PACKAGING MARKET, BY PRODUCT TYPE, 2022-2032 ($MILLION)
- TABLE 30. UK HAZMAT PLASTIC PACKAGING MARKET, BY END-USER INDUSTRY, 2022-2032 ($MILLION)
- TABLE 31. ITALY HAZMAT PLASTIC PACKAGING MARKET, BY PRODUCT TYPE, 2022-2032 ($MILLION)
- TABLE 32. ITALY HAZMAT PLASTIC PACKAGING MARKET, BY END-USER INDUSTRY, 2022-2032 ($MILLION)
- TABLE 33. REST OF EUROPE HAZMAT PLASTIC PACKAGING MARKET, BY PRODUCT TYPE, 2022-2032 ($MILLION)
- TABLE 34. REST OF EUROPE HAZMAT PLASTIC PACKAGING MARKET, BY END-USER INDUSTRY, 2022-2032 ($MILLION)
- TABLE 35. ASIA-PACIFIC HAZMAT PLASTIC PACKAGING MARKET, BY PRODUCT TYPE, 2022-2032 ($MILLION)
- TABLE 36. ASIA-PACIFIC HAZMAT PLASTIC PACKAGING MARKET, BY END-USER INDUSTRY, 2022-2032 ($MILLION)
- TABLE 37. ASIA-PACIFIC HAZMAT PLASTIC PACKAGING MARKET, BY COUNTRY, 2022-2032 ($MILLION)
- TABLE 38. CHINA HAZMAT PLASTIC PACKAGING MARKET, BY PRODUCT TYPE, 2022-2032 ($MILLION)
- TABLE 39. CHINA HAZMAT PLASTIC PACKAGING MARKET, BY END-USER INDUSTRY, 2022-2032 ($MILLION)
- TABLE 40. INDIA HAZMAT PLASTIC PACKAGING MARKET, BY PRODUCT TYPE, 2022-2032 ($MILLION)
- TABLE 41. INDIA HAZMAT PLASTIC PACKAGING MARKET, BY END-USER INDUSTRY, 2022-2032 ($MILLION)
- TABLE 42. JAPAN HAZMAT PLASTIC PACKAGING MARKET, BY PRODUCT TYPE, 2022-2032 ($MILLION)
- TABLE 43. JAPAN HAZMAT PLASTIC PACKAGING MARKET, BY END-USER INDUSTRY, 2022-2032 ($MILLION)
- TABLE 44. SOUTH KOREA HAZMAT PLASTIC PACKAGING MARKET, BY PRODUCT TYPE, 2022-2032 ($MILLION)
- TABLE 45. SOUTH KOREA HAZMAT PLASTIC PACKAGING MARKET, BY END-USER INDUSTRY, 2022-2032 ($MILLION)
- TABLE 46. REST OF ASIA-PACIFIC HAZMAT PLASTIC PACKAGING MARKET, BY PRODUCT TYPE, 2022-2032 ($MILLION)
- TABLE 47. REST OF ASIA-PACIFIC HAZMAT PLASTIC PACKAGING MARKET, BY END-USER INDUSTRY, 2022-2032 ($MILLION)
- TABLE 48. LAMEA HAZMAT PLASTIC PACKAGING MARKET, BY PRODUCT TYPE, 2022-2032 ($MILLION)
- TABLE 49. LAMEA HAZMAT PLASTIC PACKAGING MARKET, BY END-USER INDUSTRY, 2022-2032 ($MILLION)
- TABLE 50. LAMEA HAZMAT PLASTIC PACKAGING MARKET, BY COUNTRY, 2022-2032 ($MILLION)
- TABLE 51. LATIN AMERICA HAZMAT PLASTIC PACKAGING MARKET, BY PRODUCT TYPE, 2022-2032 ($MILLION)
- TABLE 52. LATIN AMERICA HAZMAT PLASTIC PACKAGING MARKET, BY END-USER INDUSTRY, 2022-2032 ($MILLION)
- TABLE 53. MIDDLE EAST HAZMAT PLASTIC PACKAGING MARKET, BY PRODUCT TYPE, 2022-2032 ($MILLION)
- TABLE 54. MIDDLE EAST HAZMAT PLASTIC PACKAGING MARKET, BY END-USER INDUSTRY, 2022-2032 ($MILLION)
- TABLE 55. AFRICA HAZMAT PLASTIC PACKAGING MARKET, BY PRODUCT TYPE, 2022-2032 ($MILLION)
- TABLE 56. AFRICA HAZMAT PLASTIC PACKAGING MARKET, BY END-USER INDUSTRY, 2022-2032 ($MILLION)
- TABLE 57. BERLIN PACKAGING LLC: KEY EXECUTIVES
- TABLE 58. BERLIN PACKAGING LLC: COMPANY SNAPSHOT
- TABLE 59. BERLIN PACKAGING LLC: PRODUCT SEGMENTS
- TABLE 60. BERLIN PACKAGING LLC: PRODUCT PORTFOLIO
- TABLE 61. BERLIN PACKAGING LLC: KEY STRATERGIES
- TABLE 62. BERRY GLOBAL INC.: KEY EXECUTIVES
- TABLE 63. BERRY GLOBAL INC.: COMPANY SNAPSHOT
- TABLE 64. BERRY GLOBAL INC.: PRODUCT SEGMENTS
- TABLE 65. BERRY GLOBAL INC.: PRODUCT PORTFOLIO
- TABLE 66. BERRY GLOBAL INC.: KEY STRATERGIES
- TABLE 67. CJK PACKAGING LIMITED: KEY EXECUTIVES
- TABLE 68. CJK PACKAGING LIMITED: COMPANY SNAPSHOT
- TABLE 69. CJK PACKAGING LIMITED: PRODUCT SEGMENTS
- TABLE 70. CJK PACKAGING LIMITED: PRODUCT PORTFOLIO
- TABLE 71. CRATECO PACK LLC: KEY EXECUTIVES
- TABLE 72. CRATECO PACK LLC: COMPANY SNAPSHOT
- TABLE 73. CRATECO PACK LLC: PRODUCT SEGMENTS
- TABLE 74. CRATECO PACK LLC: PRODUCT PORTFOLIO
- TABLE 75. FIBRESTAR DRUMS LIMITED: KEY EXECUTIVES
- TABLE 76. FIBRESTAR DRUMS LIMITED: COMPANY SNAPSHOT
- TABLE 77. FIBRESTAR DRUMS LIMITED: PRODUCT SEGMENTS
- TABLE 78. FIBRESTAR DRUMS LIMITED: PRODUCT PORTFOLIO
- TABLE 79. GREIF, INC.: KEY EXECUTIVES
- TABLE 80. GREIF, INC.: COMPANY SNAPSHOT
- TABLE 81. GREIF, INC.: PRODUCT SEGMENTS
- TABLE 82. GREIF, INC.: PRODUCT PORTFOLIO
- TABLE 83. MAUSER CORPORATE GMBH: KEY EXECUTIVES
- TABLE 84. MAUSER CORPORATE GMBH: COMPANY SNAPSHOT
- TABLE 85. MAUSER CORPORATE GMBH: PRODUCT SEGMENTS
- TABLE 86. MAUSER CORPORATE GMBH: SERVICE SEGMENTS
- TABLE 87. MAUSER CORPORATE GMBH: PRODUCT PORTFOLIO
- TABLE 88. PENINSULA DRUMS LLC: KEY EXECUTIVES
- TABLE 89. PENINSULA DRUMS LLC: COMPANY SNAPSHOT
- TABLE 90. PENINSULA DRUMS LLC: PRODUCT SEGMENTS
- TABLE 91. PENINSULA DRUMS LLC: PRODUCT PORTFOLIO
- TABLE 92. C.L. SMITH COMPANY: KEY EXECUTIVES
- TABLE 93. C.L. SMITH COMPANY: COMPANY SNAPSHOT
- TABLE 94. C.L. SMITH COMPANY: PRODUCT SEGMENTS
- TABLE 95. C.L. SMITH COMPANY: PRODUCT PORTFOLIO
- TABLE 96. C.L. SMITH COMPANY: KEY STRATERGIES
- TABLE 97. SOHNER KUNSTSTOFFTECHNIK GMBH: KEY EXECUTIVES
- TABLE 98. SOHNER KUNSTSTOFFTECHNIK GMBH: COMPANY SNAPSHOT
- TABLE 99. SOHNER KUNSTSTOFFTECHNIK GMBH: PRODUCT SEGMENTS
- TABLE 100. SOHNER KUNSTSTOFFTECHNIK GMBH: PRODUCT PORTFOLIO
LIST OF FIGURES
- FIGURE 01. HAZMAT PLASTIC PACKAGING MARKET, 2022-2032
- FIGURE 02. SEGMENTATION OF HAZMAT PLASTIC PACKAGING MARKET,2022-2032
- FIGURE 03. TOP IMPACTING FACTORS IN HAZMAT PLASTIC PACKAGING MARKET (2022 TO 2032)
- FIGURE 04. TOP INVESTMENT POCKETS IN HAZMAT PLASTIC PACKAGING MARKET (2023-2032)
- FIGURE 05. LOW BARGAINING POWER OF SUPPLIERS
- FIGURE 06. LOW THREAT OF NEW ENTRANTS
- FIGURE 07. LOW THREAT OF SUBSTITUTES
- FIGURE 08. LOW INTENSITY OF RIVALRY
- FIGURE 09. LOW BARGAINING POWER OF BUYERS
- FIGURE 10. GLOBAL HAZMAT PLASTIC PACKAGING MARKET:DRIVERS, RESTRAINTS AND OPPORTUNITIES
- FIGURE 11. HAZMAT PLASTIC PACKAGING MARKET, BY PRODUCT TYPE, 2022 AND 2032(%)
- FIGURE 12. COMPARATIVE SHARE ANALYSIS OF HAZMAT PLASTIC PACKAGING MARKET FOR DRUMS, BY COUNTRY 2022 AND 2032(%)
- FIGURE 13. COMPARATIVE SHARE ANALYSIS OF HAZMAT PLASTIC PACKAGING MARKET FOR INTERMEDIATE BULK CONTAINERS (IBCS), BY COUNTRY 2022 AND 2032(%)
- FIGURE 14. COMPARATIVE SHARE ANALYSIS OF HAZMAT PLASTIC PACKAGING MARKET FOR PAILS, BY COUNTRY 2022 AND 2032(%)
- FIGURE 15. COMPARATIVE SHARE ANALYSIS OF HAZMAT PLASTIC PACKAGING MARKET FOR BOTTLES, BY COUNTRY 2022 AND 2032(%)
- FIGURE 16. COMPARATIVE SHARE ANALYSIS OF HAZMAT PLASTIC PACKAGING MARKET FOR JERRYCAN, BY COUNTRY 2022 AND 2032(%)
- FIGURE 17. HAZMAT PLASTIC PACKAGING MARKET, BY END-USER INDUSTRY, 2022 AND 2032(%)
- FIGURE 18. COMPARATIVE SHARE ANALYSIS OF HAZMAT PLASTIC PACKAGING MARKET FOR CHEMICALS, BY COUNTRY 2022 AND 2032(%)
- FIGURE 19. COMPARATIVE SHARE ANALYSIS OF HAZMAT PLASTIC PACKAGING MARKET FOR PHARMACEUTICALS, BY COUNTRY 2022 AND 2032(%)
- FIGURE 20. COMPARATIVE SHARE ANALYSIS OF HAZMAT PLASTIC PACKAGING MARKET FOR OIL AND GAS, BY COUNTRY 2022 AND 2032(%)
- FIGURE 21. COMPARATIVE SHARE ANALYSIS OF HAZMAT PLASTIC PACKAGING MARKET FOR OTHERS, BY COUNTRY 2022 AND 2032(%)
- FIGURE 22. HAZMAT PLASTIC PACKAGING MARKET BY REGION, 2022 AND 2032(%)
- FIGURE 23. U.S. HAZMAT PLASTIC PACKAGING MARKET, 2022-2032 ($MILLION)
- FIGURE 24. CANADA HAZMAT PLASTIC PACKAGING MARKET, 2022-2032 ($MILLION)
- FIGURE 25. MEXICO HAZMAT PLASTIC PACKAGING MARKET, 2022-2032 ($MILLION)
- FIGURE 26. GERMANY HAZMAT PLASTIC PACKAGING MARKET, 2022-2032 ($MILLION)
- FIGURE 27. FRANCE HAZMAT PLASTIC PACKAGING MARKET, 2022-2032 ($MILLION)
- FIGURE 28. UK HAZMAT PLASTIC PACKAGING MARKET, 2022-2032 ($MILLION)
- FIGURE 29. ITALY HAZMAT PLASTIC PACKAGING MARKET, 2022-2032 ($MILLION)
- FIGURE 30. REST OF EUROPE HAZMAT PLASTIC PACKAGING MARKET, 2022-2032 ($MILLION)
- FIGURE 31. CHINA HAZMAT PLASTIC PACKAGING MARKET, 2022-2032 ($MILLION)
- FIGURE 32. INDIA HAZMAT PLASTIC PACKAGING MARKET, 2022-2032 ($MILLION)
- FIGURE 33. JAPAN HAZMAT PLASTIC PACKAGING MARKET, 2022-2032 ($MILLION)
- FIGURE 34. SOUTH KOREA HAZMAT PLASTIC PACKAGING MARKET, 2022-2032 ($MILLION)
- FIGURE 35. REST OF ASIA-PACIFIC HAZMAT PLASTIC PACKAGING MARKET, 2022-2032 ($MILLION)
- FIGURE 36. LATIN AMERICA HAZMAT PLASTIC PACKAGING MARKET, 2022-2032 ($MILLION)
- FIGURE 37. MIDDLE EAST HAZMAT PLASTIC PACKAGING MARKET, 2022-2032 ($MILLION)
- FIGURE 38. AFRICA HAZMAT PLASTIC PACKAGING MARKET, 2022-2032 ($MILLION)
- FIGURE 39. TOP WINNING STRATEGIES, BY YEAR (2022-2023)
- FIGURE 40. TOP WINNING STRATEGIES, BY DEVELOPMENT (2022-2023)
- FIGURE 41. TOP WINNING STRATEGIES, BY COMPANY (2022-2023)
- FIGURE 42. PRODUCT MAPPING OF TOP 10 PLAYERS
- FIGURE 43. COMPETITIVE DASHBOARD
- FIGURE 44. COMPETITIVE HEATMAP: HAZMAT PLASTIC PACKAGING MARKET
- FIGURE 45. TOP PLAYER POSITIONING, 2022
- FIGURE 46. BERRY GLOBAL INC.: NET SALES, 2021-2023 ($MILLION)
- FIGURE 47. BERRY GLOBAL INC.: RESEARCH & DEVELOPMENT EXPENDITURE, 2021-2023 ($MILLION)
- FIGURE 48. BERRY GLOBAL INC.: REVENUE SHARE BY SEGMENT, 2023 (%)
- FIGURE 49. BERRY GLOBAL INC.: REVENUE SHARE BY REGION, 2023 (%)
- FIGURE 50. GREIF, INC.: NET REVENUE, 2021-2023 ($MILLION)
- FIGURE 51. GREIF, INC.: REVENUE SHARE BY REGION, 2023 (%)
- FIGURE 52. GREIF, INC.: REVENUE SHARE BY SEGMENT, 2023 (%)

