
PUBLISHER: Allied Market Research | PRODUCT CODE: 1472304

PUBLISHER: Allied Market Research | PRODUCT CODE: 1472304
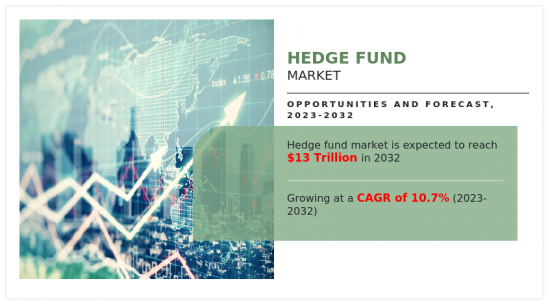
Hedge Fund Market By Strategy (Long/Short Equity, Event Driven, Currency Counterfeit Detector, Managed Futures/CTA, Others), By Type (Offshore, Fund of Funds, Domestic): Global Opportunity Analysis and Industry Forecast, 2023-2032
The hedge fund market represents a dynamic sector of the financial industry, characterized by its unique investment strategies, risk management techniques, and regulatory environment. Hedge funds are investment vehicles that pool capital from institutional and high-net-worth investors to pursue a variety of investment strategies with the goal of generating positive returns regardless of market conditions. Furthermore, hedge funds exhibit flexibility in their investment strategies. In contrast to conventional mutual funds, hedge funds utilize a diverse array of investment approaches such as long & short positions, derivatives trading, arbitrage, and leverage. This flexibility allows hedge fund managers to capitalize on market opportunities and mitigate risks in various market environments.
The increasing investments in digital assets and rise in advancements in technology boost the growth of the global hedge fund market. In addition, factors such as the evolving regulatory landscape have positively impacted the market growth. However, high fees charged by hedge funds and regulatory scrutiny & compliance costs are expected to hamper market growth. On the contrary, rise in demand for personalized health & wellness solutions is expected to offer remunerative opportunities for the expansion of the market during the forecast period. Each of these factors is projected to have a definite impact on the growth of the global hedge fund market.
Moreover, one notable trend is the increasing adoption of alternative investments, including hedge funds, by institutional investors such as pension funds, endowments, and sovereign wealth funds. These institutional investors seek to diversify their portfolios and achieve higher returns by allocating capital to hedge funds, which offer unique investment strategies and risk-return profiles.
Moreover, there's a growing emphasis on environmental, social, and governance (ESG) considerations within the hedge fund industry. Investors are increasingly focused on sustainability and ethical investment practices, prompting hedge fund managers to integrate ESG factors into their investment decision-making processes. This trend reflects broader societal shifts towards responsible investing and aligning financial objectives with environmental and social goals.
Another trend in the hedge fund market is the evolution of quantitative and algorithmic trading strategies. Advances in technology, data analytics, and machine learning have enabled hedge fund managers to develop sophisticated quantitative models that identify market trends, exploit arbitrage opportunities, and manage risk more effectively. As a result, quantitative hedge funds have gained prominence, attracting both institutional and retail investors seeking exposure to systematic trading strategies.
Furthermore, regulatory developments continue to shape the landscape of the hedge fund market. Regulatory changes aimed at enhancing transparency, reducing systemic risk, and promoting investor protection have compelled hedge fund managers to adopt more rigorous compliance and reporting standards. Increased regulatory scrutiny has also influenced fund structuring, risk management practices, and disclosure requirements within the hedge fund industry.
The global hedge fund market is segmented into strategy, type, and region. In terms of strategy, the market is fragmented into long/short equity, evenet driven, currency counterfeit detector, managed futures/CTA, and others. Depending on the type, it is divided into offshore, fund of funds, and domestic. Region-wise, the market is analyzed across North America, Europe, Asia-Pacific, and LAMEA.
Key players that operate in the global hedge fund market are Bridgewater Associates, Renaissance Technologies, Man Group, AQR Capital Management, Two Sigma Investments, Millennium Management, Citadel LLC, Elliott Management Corporation, Brevan Howard, and BlackRock. These players have adopted various strategies to increase their market penetration and strengthen their position in the industry.
Key Benefits For Stakeholders
- The study provides an in-depth analysis of the global usage-based insurance market forecast along with the current and future trends to explain the imminent investment pockets.
- Information about key drivers, restraints, and opportunities and their impact analysis on global usage-based insurance market trends is provided in the report.
- The Porter's five forces analysis illustrates the potency of the buyers and suppliers operating in the industry.
- A quantitative analysis of the market from 2023 to 2032 is provided to determine the market potential.
Additional benefits you will get with this purchase are:
- Quarterly Update and* (only available with a corporate license, on listed price)
- 5 additional Company Profile of client Choice pre- or Post-purchase, as a free update.
- Free Upcoming Version on the Purchase of Five and Enterprise User License.
- 16 analyst hours of support* (post-purchase, if you find additional data requirements upon review of the report, you may receive support amounting to 16 analyst hours to solve questions, and post-sale queries)
- 15% Free Customization* (in case the scope or segment of the report does not match your requirements, 15% is equivalent to 3 working days of free work, applicable once)
- Free data Pack on the Five and Enterprise User License. (Excel version of the report)
- Free Updated report if the report is 6-12 months old or older.
- 24-hour priority response*
- Free Industry updates and white papers.
Possible Customization with this report (with additional cost and timeline, please talk to the sales executive to know more)
- Upcoming/New Entrant by Regions
- Market share analysis of players by products/segments
- New Product Development/ Product Matrix of Key Players
- Strategic Recommendations
- Market share analysis of players at global/region/country level
- SWOT Analysis
- Volume Market Size and Forecast
Key Market Segments
By Strategy
- Long/Short Equity
- Event Driven
- Currency Counterfeit Detector
- Managed Futures/CTA
- Others
By Type
- Offshore
- Fund of Funds
- Domestic
By Region
- North America
- U.S.
- Canada
- Europe
- UK
- Germany
- France
- Italy
- Spain
- Rest of Europe
- Asia-Pacific
- China
- Japan
- India
- South Korea
- Australia
- Rest of Asia-Pacific
- Latin America
- Brazil
- Argentina
- Rest of Latin America
- Middle East
- Gcc Countries
- South Africa
- Rest of Middle East And Africa
Key Market Players:
- Citadel Enterprise Americas LLC
- ridgewater Associates LP
- Millennium Management LLC
- Davidson Kempner Capital Management LP
- Two Sigma Investments LP
- Renaissance Technologies LLC
- AQR Capital Management LLC
- Black Rock Inc
- Man Group Ltd
- Elliott Investment Management LP
TABLE OF CONTENTS
CHAPTER 1: INTRODUCTION
- 1.1. Report description
- 1.2. Key market segments
- 1.3. Key benefits to the stakeholders
- 1.4. Research methodology
- 1.4.1. Primary research
- 1.4.2. Secondary research
- 1.4.3. Analyst tools and models
CHAPTER 2: EXECUTIVE SUMMARY
- 2.1. CXO perspective
CHAPTER 3: MARKET OVERVIEW
- 3.1. Market definition and scope
- 3.2. Key findings
- 3.2.1. Top impacting factors
- 3.2.2. Top investment pockets
- 3.3. Porter's five forces analysis
- 3.4. Market dynamics
- 3.4.1. Drivers
- 3.4.2. Restraints
- 3.4.3. Opportunities
CHAPTER 4: HEDGE FUND MARKET, BY STRATEGY
- 4.1. Overview
- 4.1.1. Market size and forecast
- 4.2. Long/Short Equity
- 4.2.1. Key market trends, growth factors and opportunities
- 4.2.2. Market size and forecast, by region
- 4.2.3. Market share analysis by country
- 4.3. Event Driven
- 4.3.1. Key market trends, growth factors and opportunities
- 4.3.2. Market size and forecast, by region
- 4.3.3. Market share analysis by country
- 4.4. Currency Counterfeit Detector
- 4.4.1. Key market trends, growth factors and opportunities
- 4.4.2. Market size and forecast, by region
- 4.4.3. Market share analysis by country
- 4.5. Managed Futures/CTA
- 4.5.1. Key market trends, growth factors and opportunities
- 4.5.2. Market size and forecast, by region
- 4.5.3. Market share analysis by country
- 4.6. Others
- 4.6.1. Key market trends, growth factors and opportunities
- 4.6.2. Market size and forecast, by region
- 4.6.3. Market share analysis by country
CHAPTER 5: HEDGE FUND MARKET, BY TYPE
- 5.1. Overview
- 5.1.1. Market size and forecast
- 5.2. Offshore
- 5.2.1. Key market trends, growth factors and opportunities
- 5.2.2. Market size and forecast, by region
- 5.2.3. Market share analysis by country
- 5.3. Fund of Funds
- 5.3.1. Key market trends, growth factors and opportunities
- 5.3.2. Market size and forecast, by region
- 5.3.3. Market share analysis by country
- 5.4. Domestic
- 5.4.1. Key market trends, growth factors and opportunities
- 5.4.2. Market size and forecast, by region
- 5.4.3. Market share analysis by country
CHAPTER 6: HEDGE FUND MARKET, BY REGION
- 6.1. Overview
- 6.1.1. Market size and forecast By Region
- 6.2. North America
- 6.2.1. Key market trends, growth factors and opportunities
- 6.2.2. Market size and forecast, by Strategy
- 6.2.3. Market size and forecast, by Type
- 6.2.4. Market size and forecast, by country
- 6.2.4.1. U.S.
- 6.2.4.1.1. Market size and forecast, by Strategy
- 6.2.4.1.2. Market size and forecast, by Type
- 6.2.4.2. Canada
- 6.2.4.2.1. Market size and forecast, by Strategy
- 6.2.4.2.2. Market size and forecast, by Type
- 6.3. Europe
- 6.3.1. Key market trends, growth factors and opportunities
- 6.3.2. Market size and forecast, by Strategy
- 6.3.3. Market size and forecast, by Type
- 6.3.4. Market size and forecast, by country
- 6.3.4.1. UK
- 6.3.4.1.1. Market size and forecast, by Strategy
- 6.3.4.1.2. Market size and forecast, by Type
- 6.3.4.2. Germany
- 6.3.4.2.1. Market size and forecast, by Strategy
- 6.3.4.2.2. Market size and forecast, by Type
- 6.3.4.3. France
- 6.3.4.3.1. Market size and forecast, by Strategy
- 6.3.4.3.2. Market size and forecast, by Type
- 6.3.4.4. Italy
- 6.3.4.4.1. Market size and forecast, by Strategy
- 6.3.4.4.2. Market size and forecast, by Type
- 6.3.4.5. Spain
- 6.3.4.5.1. Market size and forecast, by Strategy
- 6.3.4.5.2. Market size and forecast, by Type
- 6.3.4.6. Rest of Europe
- 6.3.4.6.1. Market size and forecast, by Strategy
- 6.3.4.6.2. Market size and forecast, by Type
- 6.4. Asia-Pacific
- 6.4.1. Key market trends, growth factors and opportunities
- 6.4.2. Market size and forecast, by Strategy
- 6.4.3. Market size and forecast, by Type
- 6.4.4. Market size and forecast, by country
- 6.4.4.1. China
- 6.4.4.1.1. Market size and forecast, by Strategy
- 6.4.4.1.2. Market size and forecast, by Type
- 6.4.4.2. Japan
- 6.4.4.2.1. Market size and forecast, by Strategy
- 6.4.4.2.2. Market size and forecast, by Type
- 6.4.4.3. India
- 6.4.4.3.1. Market size and forecast, by Strategy
- 6.4.4.3.2. Market size and forecast, by Type
- 6.4.4.4. South Korea
- 6.4.4.4.1. Market size and forecast, by Strategy
- 6.4.4.4.2. Market size and forecast, by Type
- 6.4.4.5. Australia
- 6.4.4.5.1. Market size and forecast, by Strategy
- 6.4.4.5.2. Market size and forecast, by Type
- 6.4.4.6. Rest of Asia-Pacific
- 6.4.4.6.1. Market size and forecast, by Strategy
- 6.4.4.6.2. Market size and forecast, by Type
- 6.5. Latin America
- 6.5.1. Key market trends, growth factors and opportunities
- 6.5.2. Market size and forecast, by Strategy
- 6.5.3. Market size and forecast, by Type
- 6.5.4. Market size and forecast, by country
- 6.5.4.1. Brazil
- 6.5.4.1.1. Market size and forecast, by Strategy
- 6.5.4.1.2. Market size and forecast, by Type
- 6.5.4.2. Argentina
- 6.5.4.2.1. Market size and forecast, by Strategy
- 6.5.4.2.2. Market size and forecast, by Type
- 6.5.4.3. Rest of Latin America
- 6.5.4.3.1. Market size and forecast, by Strategy
- 6.5.4.3.2. Market size and forecast, by Type
- 6.6. Middle East
- 6.6.1. Key market trends, growth factors and opportunities
- 6.6.2. Market size and forecast, by Strategy
- 6.6.3. Market size and forecast, by Type
- 6.6.4. Market size and forecast, by country
- 6.6.4.1. Gcc Countries
- 6.6.4.1.1. Market size and forecast, by Strategy
- 6.6.4.1.2. Market size and forecast, by Type
- 6.6.4.2. South Africa
- 6.6.4.2.1. Market size and forecast, by Strategy
- 6.6.4.2.2. Market size and forecast, by Type
- 6.6.4.3. Rest of Middle East And Africa
- 6.6.4.3.1. Market size and forecast, by Strategy
- 6.6.4.3.2. Market size and forecast, by Type
CHAPTER 7: COMPETITIVE LANDSCAPE
- 7.1. Introduction
- 7.2. Top winning strategies
- 7.3. Product mapping of top 10 player
- 7.4. Competitive dashboard
- 7.5. Competitive heatmap
- 7.6. Top player positioning, 2022
CHAPTER 8: COMPANY PROFILES
- 8.1. Citadel Enterprise Americas LLC
- 8.1.1. Company overview
- 8.1.2. Key executives
- 8.1.3. Company snapshot
- 8.1.4. Operating business segments
- 8.1.5. Product portfolio
- 8.1.6. Business performance
- 8.1.7. Key strategic moves and developments
- 8.2. ridgewater Associates LP
- 8.2.1. Company overview
- 8.2.2. Key executives
- 8.2.3. Company snapshot
- 8.2.4. Operating business segments
- 8.2.5. Product portfolio
- 8.2.6. Business performance
- 8.2.7. Key strategic moves and developments
- 8.3. Millennium Management LLC
- 8.3.1. Company overview
- 8.3.2. Key executives
- 8.3.3. Company snapshot
- 8.3.4. Operating business segments
- 8.3.5. Product portfolio
- 8.3.6. Business performance
- 8.3.7. Key strategic moves and developments
- 8.4. Davidson Kempner Capital Management LP
- 8.4.1. Company overview
- 8.4.2. Key executives
- 8.4.3. Company snapshot
- 8.4.4. Operating business segments
- 8.4.5. Product portfolio
- 8.4.6. Business performance
- 8.4.7. Key strategic moves and developments
- 8.5. Two Sigma Investments LP
- 8.5.1. Company overview
- 8.5.2. Key executives
- 8.5.3. Company snapshot
- 8.5.4. Operating business segments
- 8.5.5. Product portfolio
- 8.5.6. Business performance
- 8.5.7. Key strategic moves and developments
- 8.6. Renaissance Technologies LLC
- 8.6.1. Company overview
- 8.6.2. Key executives
- 8.6.3. Company snapshot
- 8.6.4. Operating business segments
- 8.6.5. Product portfolio
- 8.6.6. Business performance
- 8.6.7. Key strategic moves and developments
- 8.7. AQR Capital Management LLC
- 8.7.1. Company overview
- 8.7.2. Key executives
- 8.7.3. Company snapshot
- 8.7.4. Operating business segments
- 8.7.5. Product portfolio
- 8.7.6. Business performance
- 8.7.7. Key strategic moves and developments
- 8.8. Black Rock Inc
- 8.8.1. Company overview
- 8.8.2. Key executives
- 8.8.3. Company snapshot
- 8.8.4. Operating business segments
- 8.8.5. Product portfolio
- 8.8.6. Business performance
- 8.8.7. Key strategic moves and developments
- 8.9. Man Group Ltd
- 8.9.1. Company overview
- 8.9.2. Key executives
- 8.9.3. Company snapshot
- 8.9.4. Operating business segments
- 8.9.5. Product portfolio
- 8.9.6. Business performance
- 8.9.7. Key strategic moves and developments
- 8.10. Elliott Investment Management LP
- 8.10.1. Company overview
- 8.10.2. Key executives
- 8.10.3. Company snapshot
- 8.10.4. Operating business segments
- 8.10.5. Product portfolio
- 8.10.6. Business performance
- 8.10.7. Key strategic moves and developments
LIST OF TABLES
- TABLE 01. GLOBAL HEDGE FUND MARKET, BY STRATEGY, 2022-2032 ($BILLION)
- TABLE 02. HEDGE FUND MARKET FOR LONG/SHORT EQUITY, BY REGION, 2022-2032 ($BILLION)
- TABLE 03. HEDGE FUND MARKET FOR EVENT DRIVEN, BY REGION, 2022-2032 ($BILLION)
- TABLE 04. HEDGE FUND MARKET FOR CURRENCY COUNTERFEIT DETECTOR, BY REGION, 2022-2032 ($BILLION)
- TABLE 05. HEDGE FUND MARKET FOR MANAGED FUTURES/CTA, BY REGION, 2022-2032 ($BILLION)
- TABLE 06. HEDGE FUND MARKET FOR OTHERS, BY REGION, 2022-2032 ($BILLION)
- TABLE 07. GLOBAL HEDGE FUND MARKET, BY TYPE, 2022-2032 ($BILLION)
- TABLE 08. HEDGE FUND MARKET FOR OFFSHORE, BY REGION, 2022-2032 ($BILLION)
- TABLE 09. HEDGE FUND MARKET FOR FUND OF FUNDS, BY REGION, 2022-2032 ($BILLION)
- TABLE 10. HEDGE FUND MARKET FOR DOMESTIC, BY REGION, 2022-2032 ($BILLION)
- TABLE 11. HEDGE FUND MARKET, BY REGION, 2022-2032 ($BILLION)
- TABLE 12. NORTH AMERICA HEDGE FUND MARKET, BY STRATEGY, 2022-2032 ($BILLION)
- TABLE 13. NORTH AMERICA HEDGE FUND MARKET, BY TYPE, 2022-2032 ($BILLION)
- TABLE 14. NORTH AMERICA HEDGE FUND MARKET, BY COUNTRY, 2022-2032 ($BILLION)
- TABLE 15. U.S. HEDGE FUND MARKET, BY STRATEGY, 2022-2032 ($BILLION)
- TABLE 16. U.S. HEDGE FUND MARKET, BY TYPE, 2022-2032 ($BILLION)
- TABLE 17. CANADA HEDGE FUND MARKET, BY STRATEGY, 2022-2032 ($BILLION)
- TABLE 18. CANADA HEDGE FUND MARKET, BY TYPE, 2022-2032 ($BILLION)
- TABLE 19. EUROPE HEDGE FUND MARKET, BY STRATEGY, 2022-2032 ($BILLION)
- TABLE 20. EUROPE HEDGE FUND MARKET, BY TYPE, 2022-2032 ($BILLION)
- TABLE 21. EUROPE HEDGE FUND MARKET, BY COUNTRY, 2022-2032 ($BILLION)
- TABLE 22. UK HEDGE FUND MARKET, BY STRATEGY, 2022-2032 ($BILLION)
- TABLE 23. UK HEDGE FUND MARKET, BY TYPE, 2022-2032 ($BILLION)
- TABLE 24. GERMANY HEDGE FUND MARKET, BY STRATEGY, 2022-2032 ($BILLION)
- TABLE 25. GERMANY HEDGE FUND MARKET, BY TYPE, 2022-2032 ($BILLION)
- TABLE 26. FRANCE HEDGE FUND MARKET, BY STRATEGY, 2022-2032 ($BILLION)
- TABLE 27. FRANCE HEDGE FUND MARKET, BY TYPE, 2022-2032 ($BILLION)
- TABLE 28. ITALY HEDGE FUND MARKET, BY STRATEGY, 2022-2032 ($BILLION)
- TABLE 29. ITALY HEDGE FUND MARKET, BY TYPE, 2022-2032 ($BILLION)
- TABLE 30. SPAIN HEDGE FUND MARKET, BY STRATEGY, 2022-2032 ($BILLION)
- TABLE 31. SPAIN HEDGE FUND MARKET, BY TYPE, 2022-2032 ($BILLION)
- TABLE 32. REST OF EUROPE HEDGE FUND MARKET, BY STRATEGY, 2022-2032 ($BILLION)
- TABLE 33. REST OF EUROPE HEDGE FUND MARKET, BY TYPE, 2022-2032 ($BILLION)
- TABLE 34. ASIA-PACIFIC HEDGE FUND MARKET, BY STRATEGY, 2022-2032 ($BILLION)
- TABLE 35. ASIA-PACIFIC HEDGE FUND MARKET, BY TYPE, 2022-2032 ($BILLION)
- TABLE 36. ASIA-PACIFIC HEDGE FUND MARKET, BY COUNTRY, 2022-2032 ($BILLION)
- TABLE 37. CHINA HEDGE FUND MARKET, BY STRATEGY, 2022-2032 ($BILLION)
- TABLE 38. CHINA HEDGE FUND MARKET, BY TYPE, 2022-2032 ($BILLION)
- TABLE 39. JAPAN HEDGE FUND MARKET, BY STRATEGY, 2022-2032 ($BILLION)
- TABLE 40. JAPAN HEDGE FUND MARKET, BY TYPE, 2022-2032 ($BILLION)
- TABLE 41. INDIA HEDGE FUND MARKET, BY STRATEGY, 2022-2032 ($BILLION)
- TABLE 42. INDIA HEDGE FUND MARKET, BY TYPE, 2022-2032 ($BILLION)
- TABLE 43. SOUTH KOREA HEDGE FUND MARKET, BY STRATEGY, 2022-2032 ($BILLION)
- TABLE 44. SOUTH KOREA HEDGE FUND MARKET, BY TYPE, 2022-2032 ($BILLION)
- TABLE 45. AUSTRALIA HEDGE FUND MARKET, BY STRATEGY, 2022-2032 ($BILLION)
- TABLE 46. AUSTRALIA HEDGE FUND MARKET, BY TYPE, 2022-2032 ($BILLION)
- TABLE 47. REST OF ASIA-PACIFIC HEDGE FUND MARKET, BY STRATEGY, 2022-2032 ($BILLION)
- TABLE 48. REST OF ASIA-PACIFIC HEDGE FUND MARKET, BY TYPE, 2022-2032 ($BILLION)
- TABLE 49. LATIN AMERICA HEDGE FUND MARKET, BY STRATEGY, 2022-2032 ($BILLION)
- TABLE 50. LATIN AMERICA HEDGE FUND MARKET, BY TYPE, 2022-2032 ($BILLION)
- TABLE 51. LATIN AMERICA HEDGE FUND MARKET, BY COUNTRY, 2022-2032 ($BILLION)
- TABLE 52. BRAZIL HEDGE FUND MARKET, BY STRATEGY, 2022-2032 ($BILLION)
- TABLE 53. BRAZIL HEDGE FUND MARKET, BY TYPE, 2022-2032 ($BILLION)
- TABLE 54. ARGENTINA HEDGE FUND MARKET, BY STRATEGY, 2022-2032 ($BILLION)
- TABLE 55. ARGENTINA HEDGE FUND MARKET, BY TYPE, 2022-2032 ($BILLION)
- TABLE 56. REST OF LATIN AMERICA HEDGE FUND MARKET, BY STRATEGY, 2022-2032 ($BILLION)
- TABLE 57. REST OF LATIN AMERICA HEDGE FUND MARKET, BY TYPE, 2022-2032 ($BILLION)
- TABLE 58. MIDDLE EAST HEDGE FUND MARKET, BY STRATEGY, 2022-2032 ($BILLION)
- TABLE 59. MIDDLE EAST HEDGE FUND MARKET, BY TYPE, 2022-2032 ($BILLION)
- TABLE 60. MIDDLE EAST HEDGE FUND MARKET, BY COUNTRY, 2022-2032 ($BILLION)
- TABLE 61. GCC COUNTRIES HEDGE FUND MARKET, BY STRATEGY, 2022-2032 ($BILLION)
- TABLE 62. GCC COUNTRIES HEDGE FUND MARKET, BY TYPE, 2022-2032 ($BILLION)
- TABLE 63. SOUTH AFRICA HEDGE FUND MARKET, BY STRATEGY, 2022-2032 ($BILLION)
- TABLE 64. SOUTH AFRICA HEDGE FUND MARKET, BY TYPE, 2022-2032 ($BILLION)
- TABLE 65. REST OF MIDDLE EAST AND AFRICA HEDGE FUND MARKET, BY STRATEGY, 2022-2032 ($BILLION)
- TABLE 66. REST OF MIDDLE EAST AND AFRICA HEDGE FUND MARKET, BY TYPE, 2022-2032 ($BILLION)
- TABLE 67. CITADEL ENTERPRISE AMERICAS LLC: KEY EXECUTIVES
- TABLE 68. CITADEL ENTERPRISE AMERICAS LLC: COMPANY SNAPSHOT
- TABLE 69. CITADEL ENTERPRISE AMERICAS LLC: PRODUCT SEGMENTS
- TABLE 70. CITADEL ENTERPRISE AMERICAS LLC: SERVICE SEGMENTS
- TABLE 71. CITADEL ENTERPRISE AMERICAS LLC: PRODUCT PORTFOLIO
- TABLE 72. CITADEL ENTERPRISE AMERICAS LLC: KEY STRATERGIES
- TABLE 73. RIDGEWATER ASSOCIATES LP: KEY EXECUTIVES
- TABLE 74. RIDGEWATER ASSOCIATES LP: COMPANY SNAPSHOT
- TABLE 75. RIDGEWATER ASSOCIATES LP: PRODUCT SEGMENTS
- TABLE 76. RIDGEWATER ASSOCIATES LP: SERVICE SEGMENTS
- TABLE 77. RIDGEWATER ASSOCIATES LP: PRODUCT PORTFOLIO
- TABLE 78. RIDGEWATER ASSOCIATES LP: KEY STRATERGIES
- TABLE 79. MILLENNIUM MANAGEMENT LLC: KEY EXECUTIVES
- TABLE 80. MILLENNIUM MANAGEMENT LLC: COMPANY SNAPSHOT
- TABLE 81. MILLENNIUM MANAGEMENT LLC: PRODUCT SEGMENTS
- TABLE 82. MILLENNIUM MANAGEMENT LLC: SERVICE SEGMENTS
- TABLE 83. MILLENNIUM MANAGEMENT LLC: PRODUCT PORTFOLIO
- TABLE 84. MILLENNIUM MANAGEMENT LLC: KEY STRATERGIES
- TABLE 85. DAVIDSON KEMPNER CAPITAL MANAGEMENT LP: KEY EXECUTIVES
- TABLE 86. DAVIDSON KEMPNER CAPITAL MANAGEMENT LP: COMPANY SNAPSHOT
- TABLE 87. DAVIDSON KEMPNER CAPITAL MANAGEMENT LP: PRODUCT SEGMENTS
- TABLE 88. DAVIDSON KEMPNER CAPITAL MANAGEMENT LP: SERVICE SEGMENTS
- TABLE 89. DAVIDSON KEMPNER CAPITAL MANAGEMENT LP: PRODUCT PORTFOLIO
- TABLE 90. DAVIDSON KEMPNER CAPITAL MANAGEMENT LP: KEY STRATERGIES
- TABLE 91. TWO SIGMA INVESTMENTS LP: KEY EXECUTIVES
- TABLE 92. TWO SIGMA INVESTMENTS LP: COMPANY SNAPSHOT
- TABLE 93. TWO SIGMA INVESTMENTS LP: PRODUCT SEGMENTS
- TABLE 94. TWO SIGMA INVESTMENTS LP: SERVICE SEGMENTS
- TABLE 95. TWO SIGMA INVESTMENTS LP: PRODUCT PORTFOLIO
- TABLE 96. TWO SIGMA INVESTMENTS LP: KEY STRATERGIES
- TABLE 97. RENAISSANCE TECHNOLOGIES LLC: KEY EXECUTIVES
- TABLE 98. RENAISSANCE TECHNOLOGIES LLC: COMPANY SNAPSHOT
- TABLE 99. RENAISSANCE TECHNOLOGIES LLC: PRODUCT SEGMENTS
- TABLE 100. RENAISSANCE TECHNOLOGIES LLC: SERVICE SEGMENTS
- TABLE 101. RENAISSANCE TECHNOLOGIES LLC: PRODUCT PORTFOLIO
- TABLE 102. RENAISSANCE TECHNOLOGIES LLC: KEY STRATERGIES
- TABLE 103. AQR CAPITAL MANAGEMENT LLC: KEY EXECUTIVES
- TABLE 104. AQR CAPITAL MANAGEMENT LLC: COMPANY SNAPSHOT
- TABLE 105. AQR CAPITAL MANAGEMENT LLC: PRODUCT SEGMENTS
- TABLE 106. AQR CAPITAL MANAGEMENT LLC: SERVICE SEGMENTS
- TABLE 107. AQR CAPITAL MANAGEMENT LLC: PRODUCT PORTFOLIO
- TABLE 108. AQR CAPITAL MANAGEMENT LLC: KEY STRATERGIES
- TABLE 109. BLACK ROCK INC: KEY EXECUTIVES
- TABLE 110. BLACK ROCK INC: COMPANY SNAPSHOT
- TABLE 111. BLACK ROCK INC: PRODUCT SEGMENTS
- TABLE 112. BLACK ROCK INC: SERVICE SEGMENTS
- TABLE 113. BLACK ROCK INC: PRODUCT PORTFOLIO
- TABLE 114. BLACK ROCK INC: KEY STRATERGIES
- TABLE 115. MAN GROUP LTD: KEY EXECUTIVES
- TABLE 116. MAN GROUP LTD: COMPANY SNAPSHOT
- TABLE 117. MAN GROUP LTD: PRODUCT SEGMENTS
- TABLE 118. MAN GROUP LTD: SERVICE SEGMENTS
- TABLE 119. MAN GROUP LTD: PRODUCT PORTFOLIO
- TABLE 120. MAN GROUP LTD: KEY STRATERGIES
- TABLE 121. ELLIOTT INVESTMENT MANAGEMENT LP: KEY EXECUTIVES
- TABLE 122. ELLIOTT INVESTMENT MANAGEMENT LP: COMPANY SNAPSHOT
- TABLE 123. ELLIOTT INVESTMENT MANAGEMENT LP: PRODUCT SEGMENTS
- TABLE 124. ELLIOTT INVESTMENT MANAGEMENT LP: SERVICE SEGMENTS
- TABLE 125. ELLIOTT INVESTMENT MANAGEMENT LP: PRODUCT PORTFOLIO
- TABLE 126. ELLIOTT INVESTMENT MANAGEMENT LP: KEY STRATERGIES
LIST OF FIGURES
- FIGURE 01. HEDGE FUND MARKET, 2022-2032
- FIGURE 02. SEGMENTATION OF HEDGE FUND MARKET,2022-2032
- FIGURE 03. TOP IMPACTING FACTORS IN HEDGE FUND MARKET
- FIGURE 04. TOP INVESTMENT POCKETS IN HEDGE FUND MARKET (2023-2032)
- FIGURE 05. BARGAINING POWER OF SUPPLIERS
- FIGURE 06. BARGAINING POWER OF BUYERS
- FIGURE 07. THREAT OF SUBSTITUTION
- FIGURE 08. THREAT OF SUBSTITUTION
- FIGURE 09. COMPETITIVE RIVALRY
- FIGURE 10. GLOBAL HEDGE FUND MARKET:DRIVERS, RESTRAINTS AND OPPORTUNITIES
- FIGURE 11. HEDGE FUND MARKET, BY STRATEGY, 2022 AND 2032(%)
- FIGURE 12. COMPARATIVE SHARE ANALYSIS OF HEDGE FUND MARKET FOR LONG/SHORT EQUITY, BY COUNTRY 2022 AND 2032(%)
- FIGURE 13. COMPARATIVE SHARE ANALYSIS OF HEDGE FUND MARKET FOR EVENT DRIVEN, BY COUNTRY 2022 AND 2032(%)
- FIGURE 14. COMPARATIVE SHARE ANALYSIS OF HEDGE FUND MARKET FOR CURRENCY COUNTERFEIT DETECTOR, BY COUNTRY 2022 AND 2032(%)
- FIGURE 15. COMPARATIVE SHARE ANALYSIS OF HEDGE FUND MARKET FOR MANAGED FUTURES/CTA, BY COUNTRY 2022 AND 2032(%)
- FIGURE 16. COMPARATIVE SHARE ANALYSIS OF HEDGE FUND MARKET FOR OTHERS, BY COUNTRY 2022 AND 2032(%)
- FIGURE 17. HEDGE FUND MARKET, BY TYPE, 2022 AND 2032(%)
- FIGURE 18. COMPARATIVE SHARE ANALYSIS OF HEDGE FUND MARKET FOR OFFSHORE, BY COUNTRY 2022 AND 2032(%)
- FIGURE 19. COMPARATIVE SHARE ANALYSIS OF HEDGE FUND MARKET FOR FUND OF FUNDS, BY COUNTRY 2022 AND 2032(%)
- FIGURE 20. COMPARATIVE SHARE ANALYSIS OF HEDGE FUND MARKET FOR DOMESTIC, BY COUNTRY 2022 AND 2032(%)
- FIGURE 21. HEDGE FUND MARKET BY REGION, 2022 AND 2032(%)
- FIGURE 22. U.S. HEDGE FUND MARKET, 2022-2032 ($BILLION)
- FIGURE 23. CANADA HEDGE FUND MARKET, 2022-2032 ($BILLION)
- FIGURE 24. UK HEDGE FUND MARKET, 2022-2032 ($BILLION)
- FIGURE 25. GERMANY HEDGE FUND MARKET, 2022-2032 ($BILLION)
- FIGURE 26. FRANCE HEDGE FUND MARKET, 2022-2032 ($BILLION)
- FIGURE 27. ITALY HEDGE FUND MARKET, 2022-2032 ($BILLION)
- FIGURE 28. SPAIN HEDGE FUND MARKET, 2022-2032 ($BILLION)
- FIGURE 29. REST OF EUROPE HEDGE FUND MARKET, 2022-2032 ($BILLION)
- FIGURE 30. CHINA HEDGE FUND MARKET, 2022-2032 ($BILLION)
- FIGURE 31. JAPAN HEDGE FUND MARKET, 2022-2032 ($BILLION)
- FIGURE 32. INDIA HEDGE FUND MARKET, 2022-2032 ($BILLION)
- FIGURE 33. SOUTH KOREA HEDGE FUND MARKET, 2022-2032 ($BILLION)
- FIGURE 34. AUSTRALIA HEDGE FUND MARKET, 2022-2032 ($BILLION)
- FIGURE 35. REST OF ASIA-PACIFIC HEDGE FUND MARKET, 2022-2032 ($BILLION)
- FIGURE 36. BRAZIL HEDGE FUND MARKET, 2022-2032 ($BILLION)
- FIGURE 37. ARGENTINA HEDGE FUND MARKET, 2022-2032 ($BILLION)
- FIGURE 38. REST OF LATIN AMERICA HEDGE FUND MARKET, 2022-2032 ($BILLION)
- FIGURE 39. GCC COUNTRIES HEDGE FUND MARKET, 2022-2032 ($BILLION)
- FIGURE 40. SOUTH AFRICA HEDGE FUND MARKET, 2022-2032 ($BILLION)
- FIGURE 41. REST OF MIDDLE EAST AND AFRICA HEDGE FUND MARKET, 2022-2032 ($BILLION)
- FIGURE 42. TOP WINNING STRATEGIES, BY YEAR
- FIGURE 43. TOP WINNING STRATEGIES, BY DEVELOPMENT
- FIGURE 44. TOP WINNING STRATEGIES, BY COMPANY
- FIGURE 45. PRODUCT MAPPING OF TOP 10 PLAYERS
- FIGURE 46. COMPETITIVE DASHBOARD
- FIGURE 47. COMPETITIVE HEATMAP: HEDGE FUND MARKET
- FIGURE 48. TOP PLAYER POSITIONING, 2022

