
PUBLISHER: Allied Market Research | PRODUCT CODE: 1472308

PUBLISHER: Allied Market Research | PRODUCT CODE: 1472308
Smart Signage Market By Type (OLED Technology, LCD Technology, LED Technology, Others), By End User (Retail, Education, Healthcare, Corporate, Stadiums, Government, Others): Global Opportunity Analysis and Industry Forecast, 2023-2032
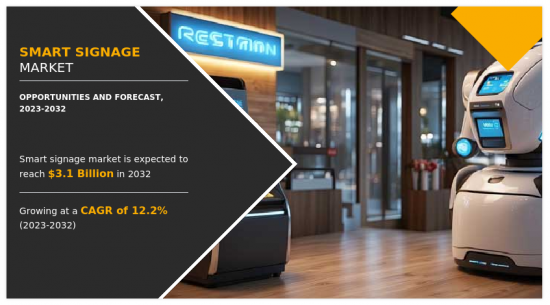
The global smart signage market was valued at $1 billion in 2022, and is projected to reach $3.1 billion by 2032, growing at a CAGR of 12.19% from 2023 to 2032..
Smart signage refers to digital signage systems that incorporate advanced technologies and software to optimize results, reduce the need for human supervision, and enhance customer engagement. These smart digital signage solutions offer features such as remote management, automation, interactivity, personalization of content, and dynamic content updates based on various data points and triggers. Smart signage goes beyond traditional digital displays by allowing for real-time customer engagement, personalized content distribution, and tailored messaging to specific audiences or locations.
Increase in demand for dynamic and interactive advertising platform represents a significant driving force for the smart signage market. With dynamic signage, businesses can present compelling content that grabs the attention of viewers more effectively as compared to static signage. In addition, interactive features such as touchscreens, gesture recognition, and mobile integration enable real-time engagement with audiences, fostering stronger connections and improving brand recall. This heightened level of interactivity enhances customer engagement as well as provides valuable insights into consumer behavior and preferences, allowing businesses to tailor their marketing strategies accordingly. Therefore, rise in demand for dynamic and interactive advertising platforms continues to propel the adoption of smart signage solutions across various industries such as retail, corporate, and healthcare, positioning them as essential tools for modern marketing approaches. However, high initial investment poses a restraint for the smart signage market. These costs include various aspects, including purchasing hardware components such as displays, media players, and sensors, as well as investing in software development, content creation, installation, and ongoing maintenance. Small and medium-sized businesses, constrained by limited financial resources, find it challenging to adopt smart signage technology due to the associated financial burden. However, adoption of smart signage in the healthcare sector represents a significant opportunity for the smart signage market. The integration of smart signage within the healthcare sector presents a notable opportunity for the smart signage market, offering the potential to transform patient communication, operational effectiveness, and overall healthcare experiences. Within hospitals, clinics, and other healthcare settings, smart signage solutions can deliver real-time updates on navigation, appointment schedules, and facility information, easing patient concerns and improving navigation. Interactive features like touchscreens and mobile connectivity empower patients to access personalized health data, educational materials, and appointment reminders, fostering deeper engagement. Additionally, smart signage streamlines administrative functions such as queue management and digital patient registration, enhancing staff productivity and resource allocation.
The smart signage market is segmented based on the basis of type, end user, and region. On the basis of type, the market is divided into OLED technology, LCD technology, LED technology, and others. On the basis of end user, the market is classified into retail, education, healthcare, corporate, stadiums, government, and other.
On the basis of region, it is analyzed across North America (the U.S., Canada, and Mexico), Europe (the UK, Germany, France, Italy, and the rest of Europe), Asia-Pacific (China, Japan, India, South Korea, and rest of Asia-Pacific), Latin America (Brazil, Argentina, and rest of Latin America), and Middle East and Africa (Saudi Arabia, Africa, and rest of Middle East & Africa).
The key players profiled in the report include, BenQ, Samsung, LG Electronics, VESTEL, ASUS Global, Tripleplay, NEC, Panasonic, Advantech, and Sony these key players have adopted strategies such as product portfolio expansion, mergers & acquisitions, agreements, geographical expansion, and collaborations to enhance their market penetration.
Key Benefits For Stakeholders
- This report provides a quantitative analysis of the market segments, current trends, estimations, and dynamics of the smart signage market analysis from 2022 to 2032 to identify the prevailing smart signage market opportunities.
- The market research is offered along with information related to key drivers, restraints, and opportunities.
- Porter's five forces analysis highlights the potency of buyers and suppliers to enable stakeholders make profit-oriented business decisions and strengthen their supplier-buyer network.
- In-depth analysis of the smart signage market segmentation assists to determine the prevailing market opportunities.
- Major countries in each region are mapped according to their revenue contribution to the global market.
- Market player positioning facilitates benchmarking and provides a clear understanding of the present position of the market players.
- The report includes the analysis of the regional as well as global smart signage market trends, key players, market segments, application areas, and market growth strategies.
Additional benefits you will get with this purchase are:
- Quarterly Update and* (only available with a corporate license, on listed price)
- 5 additional Company Profile of client Choice pre- or Post-purchase, as a free update.
- Free Upcoming Version on the Purchase of Five and Enterprise User License.
- 16 analyst hours of support* (post-purchase, if you find additional data requirements upon review of the report, you may receive support amounting to 16 analyst hours to solve questions, and post-sale queries)
- 15% Free Customization* (in case the scope or segment of the report does not match your requirements, 15% is equivalent to 3 working days of free work, applicable once)
- Free data Pack on the Five and Enterprise User License. (Excel version of the report)
- Free Updated report if the report is 6-12 months old or older.
- 24-hour priority response*
- Free Industry updates and white papers.
Possible Customization with this report (with additional cost and timeline, please talk to the sales executive to know more)
- Product Life Cycles
- New Product Development/ Product Matrix of Key Players
- Patient/epidemiology data at country, region, global level
- Additional company profiles with specific to client's interest
- Additional country or region analysis- market size and forecast
- Expanded list for Company Profiles
- Key player details (including location, contact details, supplier/vendor network etc. in excel format)
- SWOT Analysis
Key Market Segments
By Type
- OLED Technology
- LCD Technology
- LED Technology
- Others
By End User
- Retail
- Education
- Healthcare
- Corporate
- Stadiums
- Government
- Others
By Region
- North America
- U.S.
- Canada
- Mexico
- Europe
- UK
- Germany
- France
- Italy
- Rest of Europe
- Asia-Pacific
- Japan
- China
- India
- South Korea
- Rest of Asia-Pacific
- Latin America
- Brazil
- Argentina
- Rest of Latin America
- Middle East and Africa
- Saudi Arabia
- Africa
- Rest Of Middle East
Key Market Players:
- BenQ
- Samsung
- LG Electronics
- VESTEL
- Asus
- Tripleplay
- NEC Corporation
- Panasonic
- Advantech Co., Ltd.
- Sony Electronics Inc.
TABLE OF CONTENTS
CHAPTER 1: INTRODUCTION
- 1.1. Report description
- 1.2. Key market segments
- 1.3. Key benefits to the stakeholders
- 1.4. Research methodology
- 1.4.1. Primary research
- 1.4.2. Secondary research
- 1.4.3. Analyst tools and models
CHAPTER 2: EXECUTIVE SUMMARY
- 2.1. CXO perspective
CHAPTER 3: MARKET OVERVIEW
- 3.1. Market definition and scope
- 3.2. Key findings
- 3.2.1. Top impacting factors
- 3.2.2. Top investment pockets
- 3.3. Porter's five forces analysis
- 3.4. Market dynamics
- 3.4.1. Drivers
- 3.4.2. Restraints
- 3.4.3. Opportunities
CHAPTER 4: SMART SIGNAGE MARKET, BY TYPE
- 4.1. Overview
- 4.1.1. Market size and forecast
- 4.2. OLED Technology
- 4.2.1. Key market trends, growth factors and opportunities
- 4.2.2. Market size and forecast, by region
- 4.2.3. Market share analysis by country
- 4.3. LCD Technology
- 4.3.1. Key market trends, growth factors and opportunities
- 4.3.2. Market size and forecast, by region
- 4.3.3. Market share analysis by country
- 4.4. LED Technology
- 4.4.1. Key market trends, growth factors and opportunities
- 4.4.2. Market size and forecast, by region
- 4.4.3. Market share analysis by country
- 4.5. Others
- 4.5.1. Key market trends, growth factors and opportunities
- 4.5.2. Market size and forecast, by region
- 4.5.3. Market share analysis by country
CHAPTER 5: SMART SIGNAGE MARKET, BY END USER
- 5.1. Overview
- 5.1.1. Market size and forecast
- 5.2. Retail
- 5.2.1. Key market trends, growth factors and opportunities
- 5.2.2. Market size and forecast, by region
- 5.2.3. Market share analysis by country
- 5.3. Education
- 5.3.1. Key market trends, growth factors and opportunities
- 5.3.2. Market size and forecast, by region
- 5.3.3. Market share analysis by country
- 5.4. Healthcare
- 5.4.1. Key market trends, growth factors and opportunities
- 5.4.2. Market size and forecast, by region
- 5.4.3. Market share analysis by country
- 5.5. Corporate
- 5.5.1. Key market trends, growth factors and opportunities
- 5.5.2. Market size and forecast, by region
- 5.5.3. Market share analysis by country
- 5.6. Stadiums
- 5.6.1. Key market trends, growth factors and opportunities
- 5.6.2. Market size and forecast, by region
- 5.6.3. Market share analysis by country
- 5.7. Government
- 5.7.1. Key market trends, growth factors and opportunities
- 5.7.2. Market size and forecast, by region
- 5.7.3. Market share analysis by country
- 5.8. Others
- 5.8.1. Key market trends, growth factors and opportunities
- 5.8.2. Market size and forecast, by region
- 5.8.3. Market share analysis by country
CHAPTER 6: SMART SIGNAGE MARKET, BY REGION
- 6.1. Overview
- 6.1.1. Market size and forecast By Region
- 6.2. North America
- 6.2.1. Key market trends, growth factors and opportunities
- 6.2.2. Market size and forecast, by Type
- 6.2.3. Market size and forecast, by End User
- 6.2.4. Market size and forecast, by country
- 6.2.4.1. U.S.
- 6.2.4.1.1. Market size and forecast, by Type
- 6.2.4.1.2. Market size and forecast, by End User
- 6.2.4.2. Canada
- 6.2.4.2.1. Market size and forecast, by Type
- 6.2.4.2.2. Market size and forecast, by End User
- 6.2.4.3. Mexico
- 6.2.4.3.1. Market size and forecast, by Type
- 6.2.4.3.2. Market size and forecast, by End User
- 6.3. Europe
- 6.3.1. Key market trends, growth factors and opportunities
- 6.3.2. Market size and forecast, by Type
- 6.3.3. Market size and forecast, by End User
- 6.3.4. Market size and forecast, by country
- 6.3.4.1. UK
- 6.3.4.1.1. Market size and forecast, by Type
- 6.3.4.1.2. Market size and forecast, by End User
- 6.3.4.2. Germany
- 6.3.4.2.1. Market size and forecast, by Type
- 6.3.4.2.2. Market size and forecast, by End User
- 6.3.4.3. France
- 6.3.4.3.1. Market size and forecast, by Type
- 6.3.4.3.2. Market size and forecast, by End User
- 6.3.4.4. Italy
- 6.3.4.4.1. Market size and forecast, by Type
- 6.3.4.4.2. Market size and forecast, by End User
- 6.3.4.5. Rest of Europe
- 6.3.4.5.1. Market size and forecast, by Type
- 6.3.4.5.2. Market size and forecast, by End User
- 6.4. Asia-Pacific
- 6.4.1. Key market trends, growth factors and opportunities
- 6.4.2. Market size and forecast, by Type
- 6.4.3. Market size and forecast, by End User
- 6.4.4. Market size and forecast, by country
- 6.4.4.1. Japan
- 6.4.4.1.1. Market size and forecast, by Type
- 6.4.4.1.2. Market size and forecast, by End User
- 6.4.4.2. China
- 6.4.4.2.1. Market size and forecast, by Type
- 6.4.4.2.2. Market size and forecast, by End User
- 6.4.4.3. India
- 6.4.4.3.1. Market size and forecast, by Type
- 6.4.4.3.2. Market size and forecast, by End User
- 6.4.4.4. South Korea
- 6.4.4.4.1. Market size and forecast, by Type
- 6.4.4.4.2. Market size and forecast, by End User
- 6.4.4.5. Rest of Asia-Pacific
- 6.4.4.5.1. Market size and forecast, by Type
- 6.4.4.5.2. Market size and forecast, by End User
- 6.5. Latin America
- 6.5.1. Key market trends, growth factors and opportunities
- 6.5.2. Market size and forecast, by Type
- 6.5.3. Market size and forecast, by End User
- 6.5.4. Market size and forecast, by country
- 6.5.4.1. Brazil
- 6.5.4.1.1. Market size and forecast, by Type
- 6.5.4.1.2. Market size and forecast, by End User
- 6.5.4.2. Argentina
- 6.5.4.2.1. Market size and forecast, by Type
- 6.5.4.2.2. Market size and forecast, by End User
- 6.5.4.3. Rest of Latin America
- 6.5.4.3.1. Market size and forecast, by Type
- 6.5.4.3.2. Market size and forecast, by End User
- 6.6. Middle East and Africa
- 6.6.1. Key market trends, growth factors and opportunities
- 6.6.2. Market size and forecast, by Type
- 6.6.3. Market size and forecast, by End User
- 6.6.4. Market size and forecast, by country
- 6.6.4.1. Saudi Arabia
- 6.6.4.1.1. Market size and forecast, by Type
- 6.6.4.1.2. Market size and forecast, by End User
- 6.6.4.2. Africa
- 6.6.4.2.1. Market size and forecast, by Type
- 6.6.4.2.2. Market size and forecast, by End User
- 6.6.4.3. Rest Of Middle East
- 6.6.4.3.1. Market size and forecast, by Type
- 6.6.4.3.2. Market size and forecast, by End User
CHAPTER 7: COMPETITIVE LANDSCAPE
- 7.1. Introduction
- 7.2. Top winning strategies
- 7.3. Product mapping of top 10 player
- 7.4. Competitive dashboard
- 7.5. Competitive heatmap
- 7.6. Top player positioning, 2022
CHAPTER 8: COMPANY PROFILES
- 8.1. BenQ
- 8.1.1. Company overview
- 8.1.2. Key executives
- 8.1.3. Company snapshot
- 8.1.4. Operating business segments
- 8.1.5. Product portfolio
- 8.1.6. Business performance
- 8.1.7. Key strategic moves and developments
- 8.2. Samsung
- 8.2.1. Company overview
- 8.2.2. Key executives
- 8.2.3. Company snapshot
- 8.2.4. Operating business segments
- 8.2.5. Product portfolio
- 8.2.6. Business performance
- 8.2.7. Key strategic moves and developments
- 8.3. LG Electronics
- 8.3.1. Company overview
- 8.3.2. Key executives
- 8.3.3. Company snapshot
- 8.3.4. Operating business segments
- 8.3.5. Product portfolio
- 8.3.6. Business performance
- 8.3.7. Key strategic moves and developments
- 8.4. VESTEL
- 8.4.1. Company overview
- 8.4.2. Key executives
- 8.4.3. Company snapshot
- 8.4.4. Operating business segments
- 8.4.5. Product portfolio
- 8.4.6. Business performance
- 8.4.7. Key strategic moves and developments
- 8.5. Asus
- 8.5.1. Company overview
- 8.5.2. Key executives
- 8.5.3. Company snapshot
- 8.5.4. Operating business segments
- 8.5.5. Product portfolio
- 8.5.6. Business performance
- 8.5.7. Key strategic moves and developments
- 8.6. Tripleplay
- 8.6.1. Company overview
- 8.6.2. Key executives
- 8.6.3. Company snapshot
- 8.6.4. Operating business segments
- 8.6.5. Product portfolio
- 8.6.6. Business performance
- 8.6.7. Key strategic moves and developments
- 8.7. NEC Corporation
- 8.7.1. Company overview
- 8.7.2. Key executives
- 8.7.3. Company snapshot
- 8.7.4. Operating business segments
- 8.7.5. Product portfolio
- 8.7.6. Business performance
- 8.7.7. Key strategic moves and developments
- 8.8. Panasonic
- 8.8.1. Company overview
- 8.8.2. Key executives
- 8.8.3. Company snapshot
- 8.8.4. Operating business segments
- 8.8.5. Product portfolio
- 8.8.6. Business performance
- 8.8.7. Key strategic moves and developments
- 8.9. Advantech Co., Ltd.
- 8.9.1. Company overview
- 8.9.2. Key executives
- 8.9.3. Company snapshot
- 8.9.4. Operating business segments
- 8.9.5. Product portfolio
- 8.9.6. Business performance
- 8.9.7. Key strategic moves and developments
- 8.10. Sony Electronics Inc.
- 8.10.1. Company overview
- 8.10.2. Key executives
- 8.10.3. Company snapshot
- 8.10.4. Operating business segments
- 8.10.5. Product portfolio
- 8.10.6. Business performance
- 8.10.7. Key strategic moves and developments
LIST OF TABLES
- TABLE 01. GLOBAL SMART SIGNAGE MARKET, BY TYPE, 2022-2032 ($MILLION)
- TABLE 02. SMART SIGNAGE MARKET FOR OLED TECHNOLOGY, BY REGION, 2022-2032 ($MILLION)
- TABLE 03. SMART SIGNAGE MARKET FOR LCD TECHNOLOGY, BY REGION, 2022-2032 ($MILLION)
- TABLE 04. SMART SIGNAGE MARKET FOR LED TECHNOLOGY, BY REGION, 2022-2032 ($MILLION)
- TABLE 05. SMART SIGNAGE MARKET FOR OTHERS, BY REGION, 2022-2032 ($MILLION)
- TABLE 06. GLOBAL SMART SIGNAGE MARKET, BY END USER, 2022-2032 ($MILLION)
- TABLE 07. SMART SIGNAGE MARKET FOR RETAIL, BY REGION, 2022-2032 ($MILLION)
- TABLE 08. SMART SIGNAGE MARKET FOR EDUCATION, BY REGION, 2022-2032 ($MILLION)
- TABLE 09. SMART SIGNAGE MARKET FOR HEALTHCARE, BY REGION, 2022-2032 ($MILLION)
- TABLE 10. SMART SIGNAGE MARKET FOR CORPORATE, BY REGION, 2022-2032 ($MILLION)
- TABLE 11. SMART SIGNAGE MARKET FOR STADIUMS, BY REGION, 2022-2032 ($MILLION)
- TABLE 12. SMART SIGNAGE MARKET FOR GOVERNMENT, BY REGION, 2022-2032 ($MILLION)
- TABLE 13. SMART SIGNAGE MARKET FOR OTHERS, BY REGION, 2022-2032 ($MILLION)
- TABLE 14. SMART SIGNAGE MARKET, BY REGION, 2022-2032 ($MILLION)
- TABLE 15. NORTH AMERICA SMART SIGNAGE MARKET, BY TYPE, 2022-2032 ($MILLION)
- TABLE 16. NORTH AMERICA SMART SIGNAGE MARKET, BY END USER, 2022-2032 ($MILLION)
- TABLE 17. NORTH AMERICA SMART SIGNAGE MARKET, BY COUNTRY, 2022-2032 ($MILLION)
- TABLE 18. U.S. SMART SIGNAGE MARKET, BY TYPE, 2022-2032 ($MILLION)
- TABLE 19. U.S. SMART SIGNAGE MARKET, BY END USER, 2022-2032 ($MILLION)
- TABLE 20. CANADA SMART SIGNAGE MARKET, BY TYPE, 2022-2032 ($MILLION)
- TABLE 21. CANADA SMART SIGNAGE MARKET, BY END USER, 2022-2032 ($MILLION)
- TABLE 22. MEXICO SMART SIGNAGE MARKET, BY TYPE, 2022-2032 ($MILLION)
- TABLE 23. MEXICO SMART SIGNAGE MARKET, BY END USER, 2022-2032 ($MILLION)
- TABLE 24. EUROPE SMART SIGNAGE MARKET, BY TYPE, 2022-2032 ($MILLION)
- TABLE 25. EUROPE SMART SIGNAGE MARKET, BY END USER, 2022-2032 ($MILLION)
- TABLE 26. EUROPE SMART SIGNAGE MARKET, BY COUNTRY, 2022-2032 ($MILLION)
- TABLE 27. UK SMART SIGNAGE MARKET, BY TYPE, 2022-2032 ($MILLION)
- TABLE 28. UK SMART SIGNAGE MARKET, BY END USER, 2022-2032 ($MILLION)
- TABLE 29. GERMANY SMART SIGNAGE MARKET, BY TYPE, 2022-2032 ($MILLION)
- TABLE 30. GERMANY SMART SIGNAGE MARKET, BY END USER, 2022-2032 ($MILLION)
- TABLE 31. FRANCE SMART SIGNAGE MARKET, BY TYPE, 2022-2032 ($MILLION)
- TABLE 32. FRANCE SMART SIGNAGE MARKET, BY END USER, 2022-2032 ($MILLION)
- TABLE 33. ITALY SMART SIGNAGE MARKET, BY TYPE, 2022-2032 ($MILLION)
- TABLE 34. ITALY SMART SIGNAGE MARKET, BY END USER, 2022-2032 ($MILLION)
- TABLE 35. REST OF EUROPE SMART SIGNAGE MARKET, BY TYPE, 2022-2032 ($MILLION)
- TABLE 36. REST OF EUROPE SMART SIGNAGE MARKET, BY END USER, 2022-2032 ($MILLION)
- TABLE 37. ASIA-PACIFIC SMART SIGNAGE MARKET, BY TYPE, 2022-2032 ($MILLION)
- TABLE 38. ASIA-PACIFIC SMART SIGNAGE MARKET, BY END USER, 2022-2032 ($MILLION)
- TABLE 39. ASIA-PACIFIC SMART SIGNAGE MARKET, BY COUNTRY, 2022-2032 ($MILLION)
- TABLE 40. JAPAN SMART SIGNAGE MARKET, BY TYPE, 2022-2032 ($MILLION)
- TABLE 41. JAPAN SMART SIGNAGE MARKET, BY END USER, 2022-2032 ($MILLION)
- TABLE 42. CHINA SMART SIGNAGE MARKET, BY TYPE, 2022-2032 ($MILLION)
- TABLE 43. CHINA SMART SIGNAGE MARKET, BY END USER, 2022-2032 ($MILLION)
- TABLE 44. INDIA SMART SIGNAGE MARKET, BY TYPE, 2022-2032 ($MILLION)
- TABLE 45. INDIA SMART SIGNAGE MARKET, BY END USER, 2022-2032 ($MILLION)
- TABLE 46. SOUTH KOREA SMART SIGNAGE MARKET, BY TYPE, 2022-2032 ($MILLION)
- TABLE 47. SOUTH KOREA SMART SIGNAGE MARKET, BY END USER, 2022-2032 ($MILLION)
- TABLE 48. REST OF ASIA-PACIFIC SMART SIGNAGE MARKET, BY TYPE, 2022-2032 ($MILLION)
- TABLE 49. REST OF ASIA-PACIFIC SMART SIGNAGE MARKET, BY END USER, 2022-2032 ($MILLION)
- TABLE 50. LATIN AMERICA SMART SIGNAGE MARKET, BY TYPE, 2022-2032 ($MILLION)
- TABLE 51. LATIN AMERICA SMART SIGNAGE MARKET, BY END USER, 2022-2032 ($MILLION)
- TABLE 52. LATIN AMERICA SMART SIGNAGE MARKET, BY COUNTRY, 2022-2032 ($MILLION)
- TABLE 53. BRAZIL SMART SIGNAGE MARKET, BY TYPE, 2022-2032 ($MILLION)
- TABLE 54. BRAZIL SMART SIGNAGE MARKET, BY END USER, 2022-2032 ($MILLION)
- TABLE 55. ARGENTINA SMART SIGNAGE MARKET, BY TYPE, 2022-2032 ($MILLION)
- TABLE 56. ARGENTINA SMART SIGNAGE MARKET, BY END USER, 2022-2032 ($MILLION)
- TABLE 57. REST OF LATIN AMERICA SMART SIGNAGE MARKET, BY TYPE, 2022-2032 ($MILLION)
- TABLE 58. REST OF LATIN AMERICA SMART SIGNAGE MARKET, BY END USER, 2022-2032 ($MILLION)
- TABLE 59. MIDDLE EAST AND AFRICA SMART SIGNAGE MARKET, BY TYPE, 2022-2032 ($MILLION)
- TABLE 60. MIDDLE EAST AND AFRICA SMART SIGNAGE MARKET, BY END USER, 2022-2032 ($MILLION)
- TABLE 61. MIDDLE EAST AND AFRICA SMART SIGNAGE MARKET, BY COUNTRY, 2022-2032 ($MILLION)
- TABLE 62. SAUDI ARABIA SMART SIGNAGE MARKET, BY TYPE, 2022-2032 ($MILLION)
- TABLE 63. SAUDI ARABIA SMART SIGNAGE MARKET, BY END USER, 2022-2032 ($MILLION)
- TABLE 64. AFRICA SMART SIGNAGE MARKET, BY TYPE, 2022-2032 ($MILLION)
- TABLE 65. AFRICA SMART SIGNAGE MARKET, BY END USER, 2022-2032 ($MILLION)
- TABLE 66. REST OF MIDDLE EAST SMART SIGNAGE MARKET, BY TYPE, 2022-2032 ($MILLION)
- TABLE 67. REST OF MIDDLE EAST SMART SIGNAGE MARKET, BY END USER, 2022-2032 ($MILLION)
- TABLE 68. BENQ: KEY EXECUTIVES
- TABLE 69. BENQ: COMPANY SNAPSHOT
- TABLE 70. BENQ: PRODUCT SEGMENTS
- TABLE 71. BENQ: SERVICE SEGMENTS
- TABLE 72. BENQ: PRODUCT PORTFOLIO
- TABLE 73. BENQ: KEY STRATERGIES
- TABLE 74. SAMSUNG: KEY EXECUTIVES
- TABLE 75. SAMSUNG: COMPANY SNAPSHOT
- TABLE 76. SAMSUNG: PRODUCT SEGMENTS
- TABLE 77. SAMSUNG: SERVICE SEGMENTS
- TABLE 78. SAMSUNG: PRODUCT PORTFOLIO
- TABLE 79. SAMSUNG: KEY STRATERGIES
- TABLE 80. LG ELECTRONICS: KEY EXECUTIVES
- TABLE 81. LG ELECTRONICS: COMPANY SNAPSHOT
- TABLE 82. LG ELECTRONICS: PRODUCT SEGMENTS
- TABLE 83. LG ELECTRONICS: SERVICE SEGMENTS
- TABLE 84. LG ELECTRONICS: PRODUCT PORTFOLIO
- TABLE 85. LG ELECTRONICS: KEY STRATERGIES
- TABLE 86. VESTEL: KEY EXECUTIVES
- TABLE 87. VESTEL: COMPANY SNAPSHOT
- TABLE 88. VESTEL: PRODUCT SEGMENTS
- TABLE 89. VESTEL: SERVICE SEGMENTS
- TABLE 90. VESTEL: PRODUCT PORTFOLIO
- TABLE 91. VESTEL: KEY STRATERGIES
- TABLE 92. ASUS: KEY EXECUTIVES
- TABLE 93. ASUS: COMPANY SNAPSHOT
- TABLE 94. ASUS: PRODUCT SEGMENTS
- TABLE 95. ASUS: SERVICE SEGMENTS
- TABLE 96. ASUS: PRODUCT PORTFOLIO
- TABLE 97. ASUS: KEY STRATERGIES
- TABLE 98. TRIPLEPLAY: KEY EXECUTIVES
- TABLE 99. TRIPLEPLAY: COMPANY SNAPSHOT
- TABLE 100. TRIPLEPLAY: PRODUCT SEGMENTS
- TABLE 101. TRIPLEPLAY: SERVICE SEGMENTS
- TABLE 102. TRIPLEPLAY: PRODUCT PORTFOLIO
- TABLE 103. TRIPLEPLAY: KEY STRATERGIES
- TABLE 104. NEC CORPORATION: KEY EXECUTIVES
- TABLE 105. NEC CORPORATION: COMPANY SNAPSHOT
- TABLE 106. NEC CORPORATION: PRODUCT SEGMENTS
- TABLE 107. NEC CORPORATION: SERVICE SEGMENTS
- TABLE 108. NEC CORPORATION: PRODUCT PORTFOLIO
- TABLE 109. NEC CORPORATION: KEY STRATERGIES
- TABLE 110. PANASONIC: KEY EXECUTIVES
- TABLE 111. PANASONIC: COMPANY SNAPSHOT
- TABLE 112. PANASONIC: PRODUCT SEGMENTS
- TABLE 113. PANASONIC: SERVICE SEGMENTS
- TABLE 114. PANASONIC: PRODUCT PORTFOLIO
- TABLE 115. PANASONIC: KEY STRATERGIES
- TABLE 116. ADVANTECH CO., LTD.: KEY EXECUTIVES
- TABLE 117. ADVANTECH CO., LTD.: COMPANY SNAPSHOT
- TABLE 118. ADVANTECH CO., LTD.: PRODUCT SEGMENTS
- TABLE 119. ADVANTECH CO., LTD.: SERVICE SEGMENTS
- TABLE 120. ADVANTECH CO., LTD.: PRODUCT PORTFOLIO
- TABLE 121. ADVANTECH CO., LTD.: KEY STRATERGIES
- TABLE 122. SONY ELECTRONICS INC.: KEY EXECUTIVES
- TABLE 123. SONY ELECTRONICS INC.: COMPANY SNAPSHOT
- TABLE 124. SONY ELECTRONICS INC.: PRODUCT SEGMENTS
- TABLE 125. SONY ELECTRONICS INC.: SERVICE SEGMENTS
- TABLE 126. SONY ELECTRONICS INC.: PRODUCT PORTFOLIO
- TABLE 127. SONY ELECTRONICS INC.: KEY STRATERGIES
LIST OF FIGURES
- FIGURE 01. SMART SIGNAGE MARKET, 2022-2032
- FIGURE 02. SEGMENTATION OF SMART SIGNAGE MARKET,2022-2032
- FIGURE 03. TOP IMPACTING FACTORS IN SMART SIGNAGE MARKET
- FIGURE 04. TOP INVESTMENT POCKETS IN SMART SIGNAGE MARKET (2023-2032)
- FIGURE 05. BARGAINING POWER OF SUPPLIERS
- FIGURE 06. BARGAINING POWER OF BUYERS
- FIGURE 07. THREAT OF SUBSTITUTION
- FIGURE 08. THREAT OF SUBSTITUTION
- FIGURE 09. COMPETITIVE RIVALRY
- FIGURE 10. GLOBAL SMART SIGNAGE MARKET:DRIVERS, RESTRAINTS AND OPPORTUNITIES
- FIGURE 11. SMART SIGNAGE MARKET, BY TYPE, 2022 AND 2032(%)
- FIGURE 12. COMPARATIVE SHARE ANALYSIS OF SMART SIGNAGE MARKET FOR OLED TECHNOLOGY, BY COUNTRY 2022 AND 2032(%)
- FIGURE 13. COMPARATIVE SHARE ANALYSIS OF SMART SIGNAGE MARKET FOR LCD TECHNOLOGY, BY COUNTRY 2022 AND 2032(%)
- FIGURE 14. COMPARATIVE SHARE ANALYSIS OF SMART SIGNAGE MARKET FOR LED TECHNOLOGY, BY COUNTRY 2022 AND 2032(%)
- FIGURE 15. COMPARATIVE SHARE ANALYSIS OF SMART SIGNAGE MARKET FOR OTHERS, BY COUNTRY 2022 AND 2032(%)
- FIGURE 16. SMART SIGNAGE MARKET, BY END USER, 2022 AND 2032(%)
- FIGURE 17. COMPARATIVE SHARE ANALYSIS OF SMART SIGNAGE MARKET FOR RETAIL, BY COUNTRY 2022 AND 2032(%)
- FIGURE 18. COMPARATIVE SHARE ANALYSIS OF SMART SIGNAGE MARKET FOR EDUCATION, BY COUNTRY 2022 AND 2032(%)
- FIGURE 19. COMPARATIVE SHARE ANALYSIS OF SMART SIGNAGE MARKET FOR HEALTHCARE, BY COUNTRY 2022 AND 2032(%)
- FIGURE 20. COMPARATIVE SHARE ANALYSIS OF SMART SIGNAGE MARKET FOR CORPORATE, BY COUNTRY 2022 AND 2032(%)
- FIGURE 21. COMPARATIVE SHARE ANALYSIS OF SMART SIGNAGE MARKET FOR STADIUMS, BY COUNTRY 2022 AND 2032(%)
- FIGURE 22. COMPARATIVE SHARE ANALYSIS OF SMART SIGNAGE MARKET FOR GOVERNMENT, BY COUNTRY 2022 AND 2032(%)
- FIGURE 23. COMPARATIVE SHARE ANALYSIS OF SMART SIGNAGE MARKET FOR OTHERS, BY COUNTRY 2022 AND 2032(%)
- FIGURE 24. SMART SIGNAGE MARKET BY REGION, 2022 AND 2032(%)
- FIGURE 25. U.S. SMART SIGNAGE MARKET, 2022-2032 ($MILLION)
- FIGURE 26. CANADA SMART SIGNAGE MARKET, 2022-2032 ($MILLION)
- FIGURE 27. MEXICO SMART SIGNAGE MARKET, 2022-2032 ($MILLION)
- FIGURE 28. UK SMART SIGNAGE MARKET, 2022-2032 ($MILLION)
- FIGURE 29. GERMANY SMART SIGNAGE MARKET, 2022-2032 ($MILLION)
- FIGURE 30. FRANCE SMART SIGNAGE MARKET, 2022-2032 ($MILLION)
- FIGURE 31. ITALY SMART SIGNAGE MARKET, 2022-2032 ($MILLION)
- FIGURE 32. REST OF EUROPE SMART SIGNAGE MARKET, 2022-2032 ($MILLION)
- FIGURE 33. JAPAN SMART SIGNAGE MARKET, 2022-2032 ($MILLION)
- FIGURE 34. CHINA SMART SIGNAGE MARKET, 2022-2032 ($MILLION)
- FIGURE 35. INDIA SMART SIGNAGE MARKET, 2022-2032 ($MILLION)
- FIGURE 36. SOUTH KOREA SMART SIGNAGE MARKET, 2022-2032 ($MILLION)
- FIGURE 37. REST OF ASIA-PACIFIC SMART SIGNAGE MARKET, 2022-2032 ($MILLION)
- FIGURE 38. BRAZIL SMART SIGNAGE MARKET, 2022-2032 ($MILLION)
- FIGURE 39. ARGENTINA SMART SIGNAGE MARKET, 2022-2032 ($MILLION)
- FIGURE 40. REST OF LATIN AMERICA SMART SIGNAGE MARKET, 2022-2032 ($MILLION)
- FIGURE 41. SAUDI ARABIA SMART SIGNAGE MARKET, 2022-2032 ($MILLION)
- FIGURE 42. AFRICA SMART SIGNAGE MARKET, 2022-2032 ($MILLION)
- FIGURE 43. REST OF MIDDLE EAST SMART SIGNAGE MARKET, 2022-2032 ($MILLION)
- FIGURE 44. TOP WINNING STRATEGIES, BY YEAR
- FIGURE 45. TOP WINNING STRATEGIES, BY DEVELOPMENT
- FIGURE 46. TOP WINNING STRATEGIES, BY COMPANY
- FIGURE 47. PRODUCT MAPPING OF TOP 10 PLAYERS
- FIGURE 48. COMPETITIVE DASHBOARD
- FIGURE 49. COMPETITIVE HEATMAP: SMART SIGNAGE MARKET
- FIGURE 50. TOP PLAYER POSITIONING, 2022

