
PUBLISHER: Allied Market Research | PRODUCT CODE: 1472311

PUBLISHER: Allied Market Research | PRODUCT CODE: 1472311
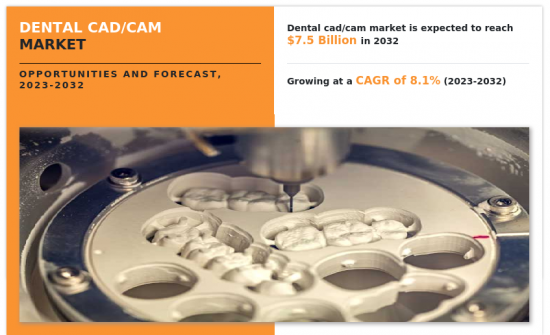
Dental CAD/CAM Market By Product Type, By Component, By End User : Global Opportunity Analysis and Industry Forecast, 2023-2032
The dental CAD/CAM market was valued at $3.4 billion in 2022 and is estimated to reach $7.5 billion by 2032, exhibiting a CAGR of 8.1% from 2023 to 2032. The dental CAD/CAM (Computer-Aided Design/Computer-Aided Manufacturing) is a technology which allows digital fabrication and is used for designing dental prostheses such as bridges crowning and veneers. This technology includes a full workflow which begins with digital impressions or scans of the patient's mouth being taken using intraoral or extraoral scanners and then after receiving digital models dental professionals such as dentists and dental technicians use specialized computer aided design software to create the desired dental restorations.
Once the design is finalized, the CAM component takes over to manufacture the restoration. This involves either milling the restoration from a solid block of material (such as ceramic or composite resin) using a computer-controlled milling machine or utilizing 3D printing technology to build the restoration layer by layer from digital files. Some dental restorations may require special furnace processing such as sintering or firing depending on the material and the desired strength. The restoration is ready after the fabrication process to be placed in the mouth of the patient.
The major factors that drive the dental CAD/CAM market are rise in prevalence of dental disorders, coupled with an aging population, and increase in demand for aesthetic dentistry, which fuels the demand for CAD/CAM technology. Patients seek natural-looking and durable dental solutions, driving the adoption of CAD/CAM products for producing high-quality restorations, crowns, bridges, and veneers.
In addition, the shift towards digital dentistry and integrated workflows accelerates market growth. CAD/CAM technology seamlessly integrates with other digital dental technologies such as intraoral scanners and 3D printers, streamlining the treatment process, enhancing efficiency, and improving communication between dental professionals and patients which boost the market growth. CAD/CAM technology offers several advantages over traditional dental techniques, including digital impressions, streamlined workflows, and same-day restorations.
Dental practice benefits from CAD/CAM products include improved patient satisfaction, reduced chairside time, and improved efficiency. This is driven by an increase in demand for dental CAD/CAM products and a rise in demand for chairside CAD/CAM products. For instance, in March 2023, Planmeca, an international leader in healthcare technology, introduced Planmill 35, a new chairside milling unit with wet and dry mills. The entire workflow from intraoral scanning to treatment design and milling can be combined with the integrated Planmeca Fit CAD/CAM System. Thus, a rise in the number of product launches propels the growth of the market.
Moreover, the CAD/CAM industry is experiencing steady advancements in software algorithms, faster milling machines and material selection techniques, which is boosting market growth. Several advancements led to improved dental restorations and prostheses that are more precise, efficient, and more visually pleasing. For instance, in January 2022, Dentsply Sirona introduced Cerec Tesrera advanced lithium disilicate CAD/CAM blocks which are suitable for fabricated restorations in anterior and posterior areas using specialized materials. This advanced lithium disilicate (ALD) ceramic is characterized primarily by its robust strength and high esthetics. Thus, the availability of such products and rise in advancements contribute towards market growth.
However, the high initial investment required for CAD/CAM systems and ongoing maintenance costs may hinder adoption and restrain market growth. In contrast, the rise in technological advancement in the dental industry and growth potential in emerging markets are expected to create immense opportunities for dental CAD/CAM market during the forecast period. Furthermore, orthodontic treatment with aligners has increased demand for CAD/CAM and the dental industry is using a similar technology. CAD/CAM technology is integral to the design and production of aligners, allowing for the precise fabrication of custom-fitted aligner trays tailored to the patient's dental anatomy which supports the market growth.
The dental CAD/CAM market is segmented into product type, component, end user, and region. By product type, the market is classified into chairside product and laboratory product. By component, the market is bifurcated into dental CAD and CAM materials and dental CAD and CAM systems. As per end user, the market is segregated into dental clinics, hospitals, and others. Region wise, the market is analyzed across North America (U.S., Canada, and Mexico), Europe (Germany, France, UK, Italy, Spain, and rest of Europe), Asia-Pacific (Japan, China, India, Australia, South Korea, and rest of Asia-Pacific), and LAMEA (Brazil, South Africa, Saudi Arabia, and rest of LAMEA).
Major key players that operate in the global dental CAD/CAM market are Dentsply Sirona, Institut Straumann AG, 3M, Ivoclar Vivadent, BioHorizons, Inc., ZimVie Inc., Roland DGA Corporation, Planmeca OY, Zirkonzahn GmbH, and Amann Girrbach AG. Key players operating in the market have adopted expansion, product launch, acquisition, and partnership as their key strategy to expand their product portfolio.
Key Benefits for Stakeholders
- This report provides a quantitative analysis of the market segments, current trends, estimations, and dynamics of the dental cad/cam market analysis from 2022 to 2032 to identify the prevailing dental cad/cam market opportunities.
- The market research is offered along with information related to key drivers, restraints, and opportunities.
- Porter's five forces analysis highlights the potency of buyers and suppliers to enable stakeholders make profit-oriented business decisions and strengthen their supplier-buyer network.
- In-depth analysis of the dental cad/cam market segmentation assists to determine the prevailing market opportunities.
- Major countries in each region are mapped according to their revenue contribution to the global market.
- Market player positioning facilitates benchmarking and provides a clear understanding of the present position of the market players.
- The report includes the analysis of the regional as well as global dental cad/cam market trends, key players, market segments, application areas, and market growth strategies.
Additional benefits you will get with this purchase are:
- Quarterly Update and* (only available with a corporate license, on listed price)
- 5 additional Company Profile of client Choice pre- or Post-purchase, as a free update.
- Free Upcoming Version on the Purchase of Five and Enterprise User License.
- 16 analyst hours of support* (post-purchase, if you find additional data requirements upon review of the report, you may receive support amounting to 16 analyst hours to solve questions, and post-sale queries)
- 15% Free Customization* (in case the scope or segment of the report does not match your requirements, 15% is equivalent to 3 working days of free work, applicable once)
- Free data Pack on the Five and Enterprise User License. (Excel version of the report)
- Free Updated report if the report is 6-12 months old or older.
- 24-hour priority response*
- Free Industry updates and white papers.
Possible Customization with this report (with additional cost and timeline, please talk to the sales executive to know more)
- Regulatory Guidelines
- Additional company profiles with specific to client's interest
- Historic market data
- Key player details (including location, contact details, supplier/vendor network etc. in excel format)
- Reimbursement Scenario
Key Market Segments
By Product Type
- Chairside Product
- Laboratory Product
By Component
- Dental CAD and CAM Materials
- Dental CAD and CAM Systems
By End User
- Dental Clinics
- Hospitals
- Others
By Region
- North America
- U.S.
- Canada
- Mexico
- Europe
- Germany
- France
- UK
- Italy
- Spain
- Rest of Europe
- Asia-Pacific
- Japan
- China
- India
- Australia
- South Korea
- Rest of Asia-Pacific
- LAMEA
- Brazil
- Saudi Arabia
- South Africa
- Rest of LAMEA
Key Market Players:
- Institut Straumann AG
- 3M Company
- Ivoclar Vivadent AG.
- Biohorizons
- Roland DGA Corporation
- Planmeca Oy
- Dentsply Sirona
- ZimVie Inc.
- Zirkonzahn GmbH.
- Amann Girrbach AG
TABLE OF CONTENTS
CHAPTER 1: INTRODUCTION
- 1.1. Report description
- 1.2. Key market segments
- 1.3. Key benefits to the stakeholders
- 1.4. Research methodology
- 1.4.1. Primary research
- 1.4.2. Secondary research
- 1.4.3. Analyst tools and models
CHAPTER 2: EXECUTIVE SUMMARY
- 2.1. CXO perspective
CHAPTER 3: MARKET OVERVIEW
- 3.1. Market definition and scope
- 3.2. Key findings
- 3.2.1. Top impacting factors
- 3.2.2. Top investment pockets
- 3.3. Porter's five forces analysis
- 3.3.1. Moderate bargaining power of suppliers
- 3.3.2. Moderate threat of new entrants
- 3.3.3. Moderate threat of substitutes
- 3.3.4. Moderate intensity of rivalry
- 3.3.5. Moderate bargaining power of buyers
- 3.4. Market dynamics
- 3.4.1. Drivers
- 3.4.1.1. Rise in prevalence of oral diseases
- 3.4.1.2. Increase in demand for aesthetic dentistry
- 3.4.1.3. Rise in technological advancements in dental industry
- 3.4.2. Restraints
- 3.4.2.1. High cost associated with dental CAD/CAM systems
- 3.4.3. Opportunities
- 3.4.3.1. Growth opportunities in emerging markets
- 3.4.1. Drivers
CHAPTER 4: DENTAL CAD/CAM MARKET, BY PRODUCT TYPE
- 4.1. Overview
- 4.1.1. Market size and forecast
- 4.2. Chairside Product
- 4.2.1. Key market trends, growth factors and opportunities
- 4.2.2. Market size and forecast, by region
- 4.2.3. Market share analysis by country
- 4.3. Laboratory Product
- 4.3.1. Key market trends, growth factors and opportunities
- 4.3.2. Market size and forecast, by region
- 4.3.3. Market share analysis by country
CHAPTER 5: DENTAL CAD/CAM MARKET, BY COMPONENT
- 5.1. Overview
- 5.1.1. Market size and forecast
- 5.2. Dental CAD and CAM Materials
- 5.2.1. Key market trends, growth factors and opportunities
- 5.2.2. Market size and forecast, by region
- 5.2.3. Market share analysis by country
- 5.3. Dental CAD and CAM Systems
- 5.3.1. Key market trends, growth factors and opportunities
- 5.3.2. Market size and forecast, by region
- 5.3.3. Market share analysis by country
CHAPTER 6: DENTAL CAD/CAM MARKET, BY END USER
- 6.1. Overview
- 6.1.1. Market size and forecast
- 6.2. Dental Clinics
- 6.2.1. Key market trends, growth factors and opportunities
- 6.2.2. Market size and forecast, by region
- 6.2.3. Market share analysis by country
- 6.3. Hospitals
- 6.3.1. Key market trends, growth factors and opportunities
- 6.3.2. Market size and forecast, by region
- 6.3.3. Market share analysis by country
- 6.4. Others
- 6.4.1. Key market trends, growth factors and opportunities
- 6.4.2. Market size and forecast, by region
- 6.4.3. Market share analysis by country
CHAPTER 7: DENTAL CAD/CAM MARKET, BY REGION
- 7.1. Overview
- 7.1.1. Market size and forecast By Region
- 7.2. North America
- 7.2.1. Key market trends, growth factors and opportunities
- 7.2.2. Market size and forecast, by Product Type
- 7.2.3. Market size and forecast, by Component
- 7.2.4. Market size and forecast, by End User
- 7.2.5. Market size and forecast, by country
- 7.2.5.1. U.S.
- 7.2.5.1.1. Market size and forecast, by Product Type
- 7.2.5.1.2. Market size and forecast, by Component
- 7.2.5.1.3. Market size and forecast, by End User
- 7.2.5.2. Canada
- 7.2.5.2.1. Market size and forecast, by Product Type
- 7.2.5.2.2. Market size and forecast, by Component
- 7.2.5.2.3. Market size and forecast, by End User
- 7.2.5.3. Mexico
- 7.2.5.3.1. Market size and forecast, by Product Type
- 7.2.5.3.2. Market size and forecast, by Component
- 7.2.5.3.3. Market size and forecast, by End User
- 7.3. Europe
- 7.3.1. Key market trends, growth factors and opportunities
- 7.3.2. Market size and forecast, by Product Type
- 7.3.3. Market size and forecast, by Component
- 7.3.4. Market size and forecast, by End User
- 7.3.5. Market size and forecast, by country
- 7.3.5.1. Germany
- 7.3.5.1.1. Market size and forecast, by Product Type
- 7.3.5.1.2. Market size and forecast, by Component
- 7.3.5.1.3. Market size and forecast, by End User
- 7.3.5.2. France
- 7.3.5.2.1. Market size and forecast, by Product Type
- 7.3.5.2.2. Market size and forecast, by Component
- 7.3.5.2.3. Market size and forecast, by End User
- 7.3.5.3. UK
- 7.3.5.3.1. Market size and forecast, by Product Type
- 7.3.5.3.2. Market size and forecast, by Component
- 7.3.5.3.3. Market size and forecast, by End User
- 7.3.5.4. Italy
- 7.3.5.4.1. Market size and forecast, by Product Type
- 7.3.5.4.2. Market size and forecast, by Component
- 7.3.5.4.3. Market size and forecast, by End User
- 7.3.5.5. Spain
- 7.3.5.5.1. Market size and forecast, by Product Type
- 7.3.5.5.2. Market size and forecast, by Component
- 7.3.5.5.3. Market size and forecast, by End User
- 7.3.5.6. Rest of Europe
- 7.3.5.6.1. Market size and forecast, by Product Type
- 7.3.5.6.2. Market size and forecast, by Component
- 7.3.5.6.3. Market size and forecast, by End User
- 7.4. Asia-Pacific
- 7.4.1. Key market trends, growth factors and opportunities
- 7.4.2. Market size and forecast, by Product Type
- 7.4.3. Market size and forecast, by Component
- 7.4.4. Market size and forecast, by End User
- 7.4.5. Market size and forecast, by country
- 7.4.5.1. Japan
- 7.4.5.1.1. Market size and forecast, by Product Type
- 7.4.5.1.2. Market size and forecast, by Component
- 7.4.5.1.3. Market size and forecast, by End User
- 7.4.5.2. China
- 7.4.5.2.1. Market size and forecast, by Product Type
- 7.4.5.2.2. Market size and forecast, by Component
- 7.4.5.2.3. Market size and forecast, by End User
- 7.4.5.3. India
- 7.4.5.3.1. Market size and forecast, by Product Type
- 7.4.5.3.2. Market size and forecast, by Component
- 7.4.5.3.3. Market size and forecast, by End User
- 7.4.5.4. Australia
- 7.4.5.4.1. Market size and forecast, by Product Type
- 7.4.5.4.2. Market size and forecast, by Component
- 7.4.5.4.3. Market size and forecast, by End User
- 7.4.5.5. South Korea
- 7.4.5.5.1. Market size and forecast, by Product Type
- 7.4.5.5.2. Market size and forecast, by Component
- 7.4.5.5.3. Market size and forecast, by End User
- 7.4.5.6. Rest of Asia-Pacific
- 7.4.5.6.1. Market size and forecast, by Product Type
- 7.4.5.6.2. Market size and forecast, by Component
- 7.4.5.6.3. Market size and forecast, by End User
- 7.5. LAMEA
- 7.5.1. Key market trends, growth factors and opportunities
- 7.5.2. Market size and forecast, by Product Type
- 7.5.3. Market size and forecast, by Component
- 7.5.4. Market size and forecast, by End User
- 7.5.5. Market size and forecast, by country
- 7.5.5.1. Brazil
- 7.5.5.1.1. Market size and forecast, by Product Type
- 7.5.5.1.2. Market size and forecast, by Component
- 7.5.5.1.3. Market size and forecast, by End User
- 7.5.5.2. Saudi Arabia
- 7.5.5.2.1. Market size and forecast, by Product Type
- 7.5.5.2.2. Market size and forecast, by Component
- 7.5.5.2.3. Market size and forecast, by End User
- 7.5.5.3. South Africa
- 7.5.5.3.1. Market size and forecast, by Product Type
- 7.5.5.3.2. Market size and forecast, by Component
- 7.5.5.3.3. Market size and forecast, by End User
- 7.5.5.4. Rest of LAMEA
- 7.5.5.4.1. Market size and forecast, by Product Type
- 7.5.5.4.2. Market size and forecast, by Component
- 7.5.5.4.3. Market size and forecast, by End User
CHAPTER 8: COMPETITIVE LANDSCAPE
- 8.1. Introduction
- 8.2. Top winning strategies
- 8.3. Product mapping of top 10 player
- 8.4. Competitive dashboard
- 8.5. Competitive heatmap
- 8.6. Top player positioning, 2022
CHAPTER 9: COMPANY PROFILES
- 9.1. Dentsply Sirona
- 9.1.1. Company overview
- 9.1.2. Key executives
- 9.1.3. Company snapshot
- 9.1.4. Operating business segments
- 9.1.5. Product portfolio
- 9.1.6. Business performance
- 9.1.7. Key strategic moves and developments
- 9.2. Institut Straumann AG
- 9.2.1. Company overview
- 9.2.2. Key executives
- 9.2.3. Company snapshot
- 9.2.4. Operating business segments
- 9.2.5. Product portfolio
- 9.2.6. Business performance
- 9.2.7. Key strategic moves and developments
- 9.3. 3M Company
- 9.3.1. Company overview
- 9.3.2. Key executives
- 9.3.3. Company snapshot
- 9.3.4. Operating business segments
- 9.3.5. Product portfolio
- 9.3.6. Business performance
- 9.4. Ivoclar Vivadent AG.
- 9.4.1. Company overview
- 9.4.2. Key executives
- 9.4.3. Company snapshot
- 9.4.4. Operating business segments
- 9.4.5. Product portfolio
- 9.4.6. Key strategic moves and developments
- 9.5. Biohorizons
- 9.5.1. Company overview
- 9.5.2. Key executives
- 9.5.3. Company snapshot
- 9.5.4. Operating business segments
- 9.5.5. Product portfolio
- 9.6. ZimVie Inc.
- 9.6.1. Company overview
- 9.6.2. Key executives
- 9.6.3. Company snapshot
- 9.6.4. Operating business segments
- 9.6.5. Product portfolio
- 9.6.6. Business performance
- 9.6.7. Key strategic moves and developments
- 9.7. Roland DGA Corporation
- 9.7.1. Company overview
- 9.7.2. Key executives
- 9.7.3. Company snapshot
- 9.7.4. Operating business segments
- 9.7.5. Product portfolio
- 9.7.6. Business performance
- 9.7.7. Key strategic moves and developments
- 9.8. Planmeca Oy
- 9.8.1. Company overview
- 9.8.2. Key executives
- 9.8.3. Company snapshot
- 9.8.4. Operating business segments
- 9.8.5. Product portfolio
- 9.8.6. Key strategic moves and developments
- 9.9. Zirkonzahn GmbH.
- 9.9.1. Company overview
- 9.9.2. Key executives
- 9.9.3. Company snapshot
- 9.9.4. Operating business segments
- 9.9.5. Product portfolio
- 9.10. Amann Girrbach AG
- 9.10.1. Company overview
- 9.10.2. Key executives
- 9.10.3. Company snapshot
- 9.10.4. Operating business segments
- 9.10.5. Product portfolio
- 9.10.6. Key strategic moves and developments
LIST OF TABLES
- TABLE 01. GLOBAL DENTAL CAD/CAM MARKET, BY PRODUCT TYPE, 2022-2032 ($MILLION)
- TABLE 02. DENTAL CAD/CAM MARKET FOR CHAIRSIDE PRODUCT, BY REGION, 2022-2032 ($MILLION)
- TABLE 03. DENTAL CAD/CAM MARKET FOR LABORATORY PRODUCT, BY REGION, 2022-2032 ($MILLION)
- TABLE 04. GLOBAL DENTAL CAD/CAM MARKET, BY COMPONENT, 2022-2032 ($MILLION)
- TABLE 05. DENTAL CAD/CAM MARKET FOR DENTAL CAD AND CAM MATERIALS, BY REGION, 2022-2032 ($MILLION)
- TABLE 06. DENTAL CAD/CAM MARKET FOR DENTAL CAD AND CAM SYSTEMS, BY REGION, 2022-2032 ($MILLION)
- TABLE 07. GLOBAL DENTAL CAD/CAM MARKET, BY END USER, 2022-2032 ($MILLION)
- TABLE 08. DENTAL CAD/CAM MARKET FOR DENTAL CLINICS, BY REGION, 2022-2032 ($MILLION)
- TABLE 09. DENTAL CAD/CAM MARKET FOR HOSPITALS, BY REGION, 2022-2032 ($MILLION)
- TABLE 10. DENTAL CAD/CAM MARKET FOR OTHERS, BY REGION, 2022-2032 ($MILLION)
- TABLE 11. DENTAL CAD/CAM MARKET, BY REGION, 2022-2032 ($MILLION)
- TABLE 12. NORTH AMERICA DENTAL CAD/CAM MARKET, BY PRODUCT TYPE, 2022-2032 ($MILLION)
- TABLE 13. NORTH AMERICA DENTAL CAD/CAM MARKET, BY COMPONENT, 2022-2032 ($MILLION)
- TABLE 14. NORTH AMERICA DENTAL CAD/CAM MARKET, BY END USER, 2022-2032 ($MILLION)
- TABLE 15. NORTH AMERICA DENTAL CAD/CAM MARKET, BY COUNTRY, 2022-2032 ($MILLION)
- TABLE 16. U.S. DENTAL CAD/CAM MARKET, BY PRODUCT TYPE, 2022-2032 ($MILLION)
- TABLE 17. U.S. DENTAL CAD/CAM MARKET, BY COMPONENT, 2022-2032 ($MILLION)
- TABLE 18. U.S. DENTAL CAD/CAM MARKET, BY END USER, 2022-2032 ($MILLION)
- TABLE 19. CANADA DENTAL CAD/CAM MARKET, BY PRODUCT TYPE, 2022-2032 ($MILLION)
- TABLE 20. CANADA DENTAL CAD/CAM MARKET, BY COMPONENT, 2022-2032 ($MILLION)
- TABLE 21. CANADA DENTAL CAD/CAM MARKET, BY END USER, 2022-2032 ($MILLION)
- TABLE 22. MEXICO DENTAL CAD/CAM MARKET, BY PRODUCT TYPE, 2022-2032 ($MILLION)
- TABLE 23. MEXICO DENTAL CAD/CAM MARKET, BY COMPONENT, 2022-2032 ($MILLION)
- TABLE 24. MEXICO DENTAL CAD/CAM MARKET, BY END USER, 2022-2032 ($MILLION)
- TABLE 25. EUROPE DENTAL CAD/CAM MARKET, BY PRODUCT TYPE, 2022-2032 ($MILLION)
- TABLE 26. EUROPE DENTAL CAD/CAM MARKET, BY COMPONENT, 2022-2032 ($MILLION)
- TABLE 27. EUROPE DENTAL CAD/CAM MARKET, BY END USER, 2022-2032 ($MILLION)
- TABLE 28. EUROPE DENTAL CAD/CAM MARKET, BY COUNTRY, 2022-2032 ($MILLION)
- TABLE 29. GERMANY DENTAL CAD/CAM MARKET, BY PRODUCT TYPE, 2022-2032 ($MILLION)
- TABLE 30. GERMANY DENTAL CAD/CAM MARKET, BY COMPONENT, 2022-2032 ($MILLION)
- TABLE 31. GERMANY DENTAL CAD/CAM MARKET, BY END USER, 2022-2032 ($MILLION)
- TABLE 32. FRANCE DENTAL CAD/CAM MARKET, BY PRODUCT TYPE, 2022-2032 ($MILLION)
- TABLE 33. FRANCE DENTAL CAD/CAM MARKET, BY COMPONENT, 2022-2032 ($MILLION)
- TABLE 34. FRANCE DENTAL CAD/CAM MARKET, BY END USER, 2022-2032 ($MILLION)
- TABLE 35. UK DENTAL CAD/CAM MARKET, BY PRODUCT TYPE, 2022-2032 ($MILLION)
- TABLE 36. UK DENTAL CAD/CAM MARKET, BY COMPONENT, 2022-2032 ($MILLION)
- TABLE 37. UK DENTAL CAD/CAM MARKET, BY END USER, 2022-2032 ($MILLION)
- TABLE 38. ITALY DENTAL CAD/CAM MARKET, BY PRODUCT TYPE, 2022-2032 ($MILLION)
- TABLE 39. ITALY DENTAL CAD/CAM MARKET, BY COMPONENT, 2022-2032 ($MILLION)
- TABLE 40. ITALY DENTAL CAD/CAM MARKET, BY END USER, 2022-2032 ($MILLION)
- TABLE 41. SPAIN DENTAL CAD/CAM MARKET, BY PRODUCT TYPE, 2022-2032 ($MILLION)
- TABLE 42. SPAIN DENTAL CAD/CAM MARKET, BY COMPONENT, 2022-2032 ($MILLION)
- TABLE 43. SPAIN DENTAL CAD/CAM MARKET, BY END USER, 2022-2032 ($MILLION)
- TABLE 44. REST OF EUROPE DENTAL CAD/CAM MARKET, BY PRODUCT TYPE, 2022-2032 ($MILLION)
- TABLE 45. REST OF EUROPE DENTAL CAD/CAM MARKET, BY COMPONENT, 2022-2032 ($MILLION)
- TABLE 46. REST OF EUROPE DENTAL CAD/CAM MARKET, BY END USER, 2022-2032 ($MILLION)
- TABLE 47. ASIA-PACIFIC DENTAL CAD/CAM MARKET, BY PRODUCT TYPE, 2022-2032 ($MILLION)
- TABLE 48. ASIA-PACIFIC DENTAL CAD/CAM MARKET, BY COMPONENT, 2022-2032 ($MILLION)
- TABLE 49. ASIA-PACIFIC DENTAL CAD/CAM MARKET, BY END USER, 2022-2032 ($MILLION)
- TABLE 50. ASIA-PACIFIC DENTAL CAD/CAM MARKET, BY COUNTRY, 2022-2032 ($MILLION)
- TABLE 51. JAPAN DENTAL CAD/CAM MARKET, BY PRODUCT TYPE, 2022-2032 ($MILLION)
- TABLE 52. JAPAN DENTAL CAD/CAM MARKET, BY COMPONENT, 2022-2032 ($MILLION)
- TABLE 53. JAPAN DENTAL CAD/CAM MARKET, BY END USER, 2022-2032 ($MILLION)
- TABLE 54. CHINA DENTAL CAD/CAM MARKET, BY PRODUCT TYPE, 2022-2032 ($MILLION)
- TABLE 55. CHINA DENTAL CAD/CAM MARKET, BY COMPONENT, 2022-2032 ($MILLION)
- TABLE 56. CHINA DENTAL CAD/CAM MARKET, BY END USER, 2022-2032 ($MILLION)
- TABLE 57. INDIA DENTAL CAD/CAM MARKET, BY PRODUCT TYPE, 2022-2032 ($MILLION)
- TABLE 58. INDIA DENTAL CAD/CAM MARKET, BY COMPONENT, 2022-2032 ($MILLION)
- TABLE 59. INDIA DENTAL CAD/CAM MARKET, BY END USER, 2022-2032 ($MILLION)
- TABLE 60. AUSTRALIA DENTAL CAD/CAM MARKET, BY PRODUCT TYPE, 2022-2032 ($MILLION)
- TABLE 61. AUSTRALIA DENTAL CAD/CAM MARKET, BY COMPONENT, 2022-2032 ($MILLION)
- TABLE 62. AUSTRALIA DENTAL CAD/CAM MARKET, BY END USER, 2022-2032 ($MILLION)
- TABLE 63. SOUTH KOREA DENTAL CAD/CAM MARKET, BY PRODUCT TYPE, 2022-2032 ($MILLION)
- TABLE 64. SOUTH KOREA DENTAL CAD/CAM MARKET, BY COMPONENT, 2022-2032 ($MILLION)
- TABLE 65. SOUTH KOREA DENTAL CAD/CAM MARKET, BY END USER, 2022-2032 ($MILLION)
- TABLE 66. REST OF ASIA-PACIFIC DENTAL CAD/CAM MARKET, BY PRODUCT TYPE, 2022-2032 ($MILLION)
- TABLE 67. REST OF ASIA-PACIFIC DENTAL CAD/CAM MARKET, BY COMPONENT, 2022-2032 ($MILLION)
- TABLE 68. REST OF ASIA-PACIFIC DENTAL CAD/CAM MARKET, BY END USER, 2022-2032 ($MILLION)
- TABLE 69. LAMEA DENTAL CAD/CAM MARKET, BY PRODUCT TYPE, 2022-2032 ($MILLION)
- TABLE 70. LAMEA DENTAL CAD/CAM MARKET, BY COMPONENT, 2022-2032 ($MILLION)
- TABLE 71. LAMEA DENTAL CAD/CAM MARKET, BY END USER, 2022-2032 ($MILLION)
- TABLE 72. LAMEA DENTAL CAD/CAM MARKET, BY COUNTRY, 2022-2032 ($MILLION)
- TABLE 73. BRAZIL DENTAL CAD/CAM MARKET, BY PRODUCT TYPE, 2022-2032 ($MILLION)
- TABLE 74. BRAZIL DENTAL CAD/CAM MARKET, BY COMPONENT, 2022-2032 ($MILLION)
- TABLE 75. BRAZIL DENTAL CAD/CAM MARKET, BY END USER, 2022-2032 ($MILLION)
- TABLE 76. SAUDI ARABIA DENTAL CAD/CAM MARKET, BY PRODUCT TYPE, 2022-2032 ($MILLION)
- TABLE 77. SAUDI ARABIA DENTAL CAD/CAM MARKET, BY COMPONENT, 2022-2032 ($MILLION)
- TABLE 78. SAUDI ARABIA DENTAL CAD/CAM MARKET, BY END USER, 2022-2032 ($MILLION)
- TABLE 79. SOUTH AFRICA DENTAL CAD/CAM MARKET, BY PRODUCT TYPE, 2022-2032 ($MILLION)
- TABLE 80. SOUTH AFRICA DENTAL CAD/CAM MARKET, BY COMPONENT, 2022-2032 ($MILLION)
- TABLE 81. SOUTH AFRICA DENTAL CAD/CAM MARKET, BY END USER, 2022-2032 ($MILLION)
- TABLE 82. REST OF LAMEA DENTAL CAD/CAM MARKET, BY PRODUCT TYPE, 2022-2032 ($MILLION)
- TABLE 83. REST OF LAMEA DENTAL CAD/CAM MARKET, BY COMPONENT, 2022-2032 ($MILLION)
- TABLE 84. REST OF LAMEA DENTAL CAD/CAM MARKET, BY END USER, 2022-2032 ($MILLION)
- TABLE 85. DENTSPLY SIRONA: KEY EXECUTIVES
- TABLE 86. DENTSPLY SIRONA: COMPANY SNAPSHOT
- TABLE 87. DENTSPLY SIRONA: PRODUCT SEGMENTS
- TABLE 88. DENTSPLY SIRONA: PRODUCT PORTFOLIO
- TABLE 89. DENTSPLY SIRONA: KEY STRATERGIES
- TABLE 90. INSTITUT STRAUMANN AG: KEY EXECUTIVES
- TABLE 91. INSTITUT STRAUMANN AG: COMPANY SNAPSHOT
- TABLE 92. INSTITUT STRAUMANN AG: PRODUCT SEGMENTS
- TABLE 93. INSTITUT STRAUMANN AG: PRODUCT PORTFOLIO
- TABLE 94. INSTITUT STRAUMANN AG: KEY STRATERGIES
- TABLE 95. 3M COMPANY: KEY EXECUTIVES
- TABLE 96. 3M COMPANY: COMPANY SNAPSHOT
- TABLE 97. 3M COMPANY: PRODUCT SEGMENTS
- TABLE 98. 3M COMPANY: PRODUCT PORTFOLIO
- TABLE 99. IVOCLAR VIVADENT AG.: KEY EXECUTIVES
- TABLE 100. IVOCLAR VIVADENT AG.: COMPANY SNAPSHOT
- TABLE 101. IVOCLAR VIVADENT AG.: PRODUCT SEGMENTS
- TABLE 102. IVOCLAR VIVADENT AG.: PRODUCT PORTFOLIO
- TABLE 103. IVOCLAR VIVADENT AG.: KEY STRATERGIES
- TABLE 104. BIOHORIZONS: KEY EXECUTIVES
- TABLE 105. BIOHORIZONS: COMPANY SNAPSHOT
- TABLE 106. BIOHORIZONS: PRODUCT SEGMENTS
- TABLE 107. BIOHORIZONS: PRODUCT PORTFOLIO
- TABLE 108. ZIMVIE INC.: KEY EXECUTIVES
- TABLE 109. ZIMVIE INC.: COMPANY SNAPSHOT
- TABLE 110. ZIMVIE INC.: PRODUCT SEGMENTS
- TABLE 111. ZIMVIE INC.: PRODUCT PORTFOLIO
- TABLE 112. ZIMVIE INC.: KEY STRATERGIES
- TABLE 113. ROLAND DGA CORPORATION: KEY EXECUTIVES
- TABLE 114. ROLAND DGA CORPORATION: COMPANY SNAPSHOT
- TABLE 115. ROLAND DGA CORPORATION: PRODUCT SEGMENTS
- TABLE 116. ROLAND DGA CORPORATION: PRODUCT PORTFOLIO
- TABLE 117. ROLAND DGA CORPORATION: KEY STRATERGIES
- TABLE 118. PLANMECA OY: KEY EXECUTIVES
- TABLE 119. PLANMECA OY: COMPANY SNAPSHOT
- TABLE 120. PLANMECA OY: PRODUCT SEGMENTS
- TABLE 121. PLANMECA OY: PRODUCT PORTFOLIO
- TABLE 122. PLANMECA OY: KEY STRATERGIES
- TABLE 123. ZIRKONZAHN GMBH.: KEY EXECUTIVES
- TABLE 124. ZIRKONZAHN GMBH.: COMPANY SNAPSHOT
- TABLE 125. ZIRKONZAHN GMBH.: PRODUCT SEGMENTS
- TABLE 126. ZIRKONZAHN GMBH.: PRODUCT PORTFOLIO
- TABLE 127. AMANN GIRRBACH AG: KEY EXECUTIVES
- TABLE 128. AMANN GIRRBACH AG: COMPANY SNAPSHOT
- TABLE 129. AMANN GIRRBACH AG: PRODUCT SEGMENTS
- TABLE 130. AMANN GIRRBACH AG: PRODUCT PORTFOLIO
- TABLE 131. AMANN GIRRBACH AG: KEY STRATERGIES
LIST OF FIGURES
- FIGURE 01. DENTAL CAD/CAM MARKET, 2022-2032
- FIGURE 02. SEGMENTATION OF DENTAL CAD/CAM MARKET,2022-2032
- FIGURE 03. TOP IMPACTING FACTORS IN DENTAL CAD/CAM MARKET (2022 TO 2032)
- FIGURE 04. TOP INVESTMENT POCKETS IN DENTAL CAD/CAM MARKET (2023-2032)
- FIGURE 05. MODERATE BARGAINING POWER OF SUPPLIERS
- FIGURE 06. MODERATE THREAT OF NEW ENTRANTS
- FIGURE 07. MODERATE THREAT OF SUBSTITUTES
- FIGURE 08. MODERATE INTENSITY OF RIVALRY
- FIGURE 09. MODERATE BARGAINING POWER OF BUYERS
- FIGURE 10. GLOBAL DENTAL CAD/CAM MARKET:DRIVERS, RESTRAINTS AND OPPORTUNITIES
- FIGURE 11. DENTAL CAD/CAM MARKET, BY PRODUCT TYPE, 2022 AND 2032(%)
- FIGURE 12. COMPARATIVE SHARE ANALYSIS OF DENTAL CAD/CAM MARKET FOR CHAIRSIDE PRODUCT, BY COUNTRY 2022 AND 2032(%)
- FIGURE 13. COMPARATIVE SHARE ANALYSIS OF DENTAL CAD/CAM MARKET FOR LABORATORY PRODUCT, BY COUNTRY 2022 AND 2032(%)
- FIGURE 14. DENTAL CAD/CAM MARKET, BY COMPONENT, 2022 AND 2032(%)
- FIGURE 15. COMPARATIVE SHARE ANALYSIS OF DENTAL CAD/CAM MARKET FOR DENTAL CAD AND CAM MATERIALS, BY COUNTRY 2022 AND 2032(%)
- FIGURE 16. COMPARATIVE SHARE ANALYSIS OF DENTAL CAD/CAM MARKET FOR DENTAL CAD AND CAM SYSTEMS, BY COUNTRY 2022 AND 2032(%)
- FIGURE 17. DENTAL CAD/CAM MARKET, BY END USER, 2022 AND 2032(%)
- FIGURE 18. COMPARATIVE SHARE ANALYSIS OF DENTAL CAD/CAM MARKET FOR DENTAL CLINICS, BY COUNTRY 2022 AND 2032(%)
- FIGURE 19. COMPARATIVE SHARE ANALYSIS OF DENTAL CAD/CAM MARKET FOR HOSPITALS, BY COUNTRY 2022 AND 2032(%)
- FIGURE 20. COMPARATIVE SHARE ANALYSIS OF DENTAL CAD/CAM MARKET FOR OTHERS, BY COUNTRY 2022 AND 2032(%)
- FIGURE 21. DENTAL CAD/CAM MARKET BY REGION, 2022 AND 2032(%)
- FIGURE 22. U.S. DENTAL CAD/CAM MARKET, 2022-2032 ($MILLION)
- FIGURE 23. CANADA DENTAL CAD/CAM MARKET, 2022-2032 ($MILLION)
- FIGURE 24. MEXICO DENTAL CAD/CAM MARKET, 2022-2032 ($MILLION)
- FIGURE 25. GERMANY DENTAL CAD/CAM MARKET, 2022-2032 ($MILLION)
- FIGURE 26. FRANCE DENTAL CAD/CAM MARKET, 2022-2032 ($MILLION)
- FIGURE 27. UK DENTAL CAD/CAM MARKET, 2022-2032 ($MILLION)
- FIGURE 28. ITALY DENTAL CAD/CAM MARKET, 2022-2032 ($MILLION)
- FIGURE 29. SPAIN DENTAL CAD/CAM MARKET, 2022-2032 ($MILLION)
- FIGURE 30. REST OF EUROPE DENTAL CAD/CAM MARKET, 2022-2032 ($MILLION)
- FIGURE 31. JAPAN DENTAL CAD/CAM MARKET, 2022-2032 ($MILLION)
- FIGURE 32. CHINA DENTAL CAD/CAM MARKET, 2022-2032 ($MILLION)
- FIGURE 33. INDIA DENTAL CAD/CAM MARKET, 2022-2032 ($MILLION)
- FIGURE 34. AUSTRALIA DENTAL CAD/CAM MARKET, 2022-2032 ($MILLION)
- FIGURE 35. SOUTH KOREA DENTAL CAD/CAM MARKET, 2022-2032 ($MILLION)
- FIGURE 36. REST OF ASIA-PACIFIC DENTAL CAD/CAM MARKET, 2022-2032 ($MILLION)
- FIGURE 37. BRAZIL DENTAL CAD/CAM MARKET, 2022-2032 ($MILLION)
- FIGURE 38. SAUDI ARABIA DENTAL CAD/CAM MARKET, 2022-2032 ($MILLION)
- FIGURE 39. SOUTH AFRICA DENTAL CAD/CAM MARKET, 2022-2032 ($MILLION)
- FIGURE 40. REST OF LAMEA DENTAL CAD/CAM MARKET, 2022-2032 ($MILLION)
- FIGURE 41. TOP WINNING STRATEGIES, BY YEAR (2021-2024)
- FIGURE 42. TOP WINNING STRATEGIES, BY DEVELOPMENT (2021-2024)
- FIGURE 43. TOP WINNING STRATEGIES, BY COMPANY (2021-2024)
- FIGURE 44. PRODUCT MAPPING OF TOP 10 PLAYERS
- FIGURE 45. COMPETITIVE DASHBOARD
- FIGURE 46. COMPETITIVE HEATMAP: DENTAL CAD/CAM MARKET
- FIGURE 47. TOP PLAYER POSITIONING, 2022
- FIGURE 48. DENTSPLY SIRONA: NET SALES, 2020-2022 ($MILLION)
- FIGURE 49. DENTSPLY SIRONA: REVENUE SHARE BY SEGMENT, 2022 (%)
- FIGURE 50. DENTSPLY SIRONA: REVENUE SHARE BY REGION, 2022 (%)
- FIGURE 51. INSTITUT STRAUMANN AG: NET REVENUE, 2021-2023 ($MILLION)
- FIGURE 52. INSTITUT STRAUMANN AG: REVENUE SHARE BY SEGMENT, 2023 (%)
- FIGURE 53. INSTITUT STRAUMANN AG: REVENUE SHARE BY REGION, 2023 (%)
- FIGURE 54. 3M COMPANY: NET REVENUE, 2020-2022 ($MILLION)
- FIGURE 55. 3M COMPANY: RESEARCH & DEVELOPMENT EXPENDITURE, 2020-2022 ($MILLION)
- FIGURE 56. 3M COMPANY: REVENUE SHARE BY SEGMENT, 2022 (%)
- FIGURE 57. 3M COMPANY: REVENUE SHARE BY REGION, 2022 (%)
- FIGURE 58. ZIMVIE INC.: NET SALES, 2020-2022 ($MILLION)
- FIGURE 59. ZIMVIE INC.: REVENUE SHARE BY SEGMENT, 2022 (%)
- FIGURE 60. ZIMVIE INC.: REVENUE SHARE BY REGION, 2022 (%)
- FIGURE 61. ROLAND DGA CORPORATION: NET SALES, 2020-2022 ($MILLION)
- FIGURE 62. ROLAND DGA CORPORATION: REVENUE SHARE BY REGION, 2022 (%)

