
PUBLISHER: Allied Market Research | PRODUCT CODE: 1472333

PUBLISHER: Allied Market Research | PRODUCT CODE: 1472333
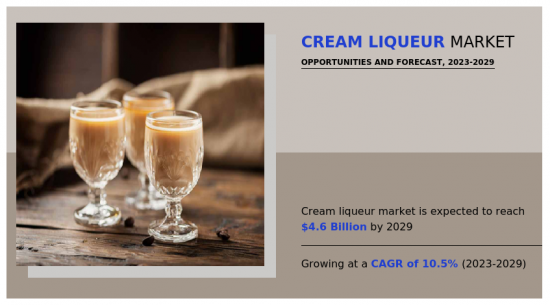
Cream Liqueur Market By Source (Milk, Coconut, Almond, Oat, Others), By Flavor (Chocolate, Caramel, Vanilla, Strawberry, Others), By Distribution Channel (On Trade, Off Trade): Global Opportunity Analysis and Industry Forecast, 2023-2029
The global cream liqueur market was valued at $2,248.8 million in 2019, and is projected to reach $4,596.7 million by 2029, registering a CAGR of 10.5% from 2023 to 2029.
The market for cream liqueurs has grown and diversified significantly in recent years due to shifting consumer tastes, a rise in the number of products available, and a rise in the demand for upscale, decadent alcoholic beverages. Cream liqueurs have made a name for themselves in the wider alcohol market thanks to their rich flavors, velvety texture, and adaptability.
Cream, liquors (usually rum or whiskey), sweeteners, and flavorings are the usual ingredients of cream liqueurs. This blend produces a rich, creamy drink that is great on its own, with ice, or as a main ingredient in drinks and desserts. Even though classic cream liqueurs like Irish cream have been around for a while, producers have added a lot of creative flavors and variants to suit a variety of consumer preferences.
The market for cream liqueurs is expanding due in large part to the growing desire for upscale, handcrafted goods. Customers are prepared to spend more for products with superior ingredients, distinctive flavors, and well-thought-out recipes. Because of this, a lot of producers have concentrated on creating artisanal cream liqueurs in small batches with ingredients that are sourced locally and conventional production techniques. The market has grown as a result of this premiumization trend, as customers look for fresh and unique products.
The market for cream liqueurs is expanding due to the growing demand for cocktails and mixology. Cream liqueurs are perfect for crafting rich, savory cocktails because they give them a creamy, decadent touch. Cream liqueurs are becoming more and more popular as mixologists and bartenders experiment with them in inventive cocktail mixes, raising consumer knowledge and demand for these goods. Furthermore, cream liqueurs' adaptability makes them a popular option for cocktails with a dessert theme, which increases their consumer appeal.
Additionally, cream liqueurs have become a popular after-dinner drink due to the increased desire in luxurious and immersive dining experiences. For many customers, cream liqueurs are an opulent delicacy best enjoyed on special occasions or as a sumptuous substitute for dessert. Producers have benefited from this trend by marketing cream liqueurs as upscale, decadent drinks that are ideal for entertaining and giving as gifts.
In terms of market segmentation, there are many different goods in the cream liqueur market that appeal to various consumer preferences and occasions. Older varieties like Irish cream are still well-liked, especially around the holidays, but younger customers are drawn to more creative taste combinations in more recent releases like salted caramel, chocolate mint, and espresso cream. Furthermore, in response to the increasing consumer desire for plant-based substitutes, producers have started offering vegan and dairy-free products.
With significant demand in North America, Europe, and the Asia-Pacific region, the cream liqueur market is geographically widespread. Growing economies in Asia-Pacific, especially China and India, provide tremendous development potential as a result of changing consumer habits and increased disposable incomes, even though traditional markets like the US and Ireland still govern consumption.
Therefore, premiumization, trends in mixology, and changing consumer tastes are driving the market for cream liqueurs, which is expanding rapidly. Cream liqueurs are expected to maintain their appeal to consumers across the globe due to their vast variety of flavors, forms, and occasions of consumption.
The cream liqueur market is analyzed on the basis of source, flavor, distribution channel, and region. By source, it is divided into milk, coconut, almond, oats, and others. By flavor, it is categorized into chocolate, caramel, vanilla, strawberry, and others. By distribution channel, it is bifurcated into on trade and off trade. By region, it is divided into North America, Europe, Asia-Pacific, and LAMEA.
The key players operating in the Cream liqueur market have adopted product launch and business expansion as their key strategies to expand their market share, increase profitability, and remain competitive in the market. The major players operating in the Cream liqueur market are Diageo, E. And J. Gallo Winery, Heaven Hill, McCormick, Grupo Zamora, DeKuyper Royal Distillers, BEHN, Buzzballz, Sazerac, Lucas Bols, Pernod Ricard, Terra. and DISTELL.
Key Benefits for Stakeholders
- This report provides a quantitative analysis of the market segments, current trends, estimations, and dynamics of the cream liqueur market analysis from 2019 to 2029 to identify the prevailing cream liqueur market opportunities.
- The market research is offered along with information related to key drivers, restraints, and opportunities.
- Porter's five forces analysis highlights the potency of buyers and suppliers to enable stakeholders make profit-oriented business decisions and strengthen their supplier-buyer network.
- In-depth analysis of the cream liqueur market segmentation assists to determine the prevailing market opportunities.
- Major countries in each region are mapped according to their revenue contribution to the global market.
- Market player positioning facilitates benchmarking and provides a clear understanding of the present position of the market players.
- The report includes the analysis of the regional as well as global cream liqueur market trends, key players, market segments, application areas, and market growth strategies.
Additional benefits you will get with this purchase are:
- Quarterly Update and* (only available with a corporate license, on listed price)
- 5 additional Company Profile of client Choice pre- or Post-purchase, as a free update.
- Free Upcoming Version on the Purchase of Five and Enterprise User License.
- 16 analyst hours of support* (post-purchase, if you find additional data requirements upon review of the report, you may receive support amounting to 16 analyst hours to solve questions, and post-sale queries)
- 15% Free Customization* (in case the scope or segment of the report does not match your requirements, 15% is equivalent to 3 working days of free work, applicable once)
- Free data Pack on the Five and Enterprise User License. (Excel version of the report)
- Free Updated report if the report is 6-12 months old or older.
- 24-hour priority response*
- Free Industry updates and white papers.
Possible Customization with this report (with additional cost and timeline, please talk to the sales executive to know more)
- Product Benchmarking / Product specification and applications
- Market share analysis of players by products/segments
- New Product Development/ Product Matrix of Key Players
- Additional company profiles with specific to client's interest
- Additional country or region analysis- market size and forecast
- Average Selling Price Analysis / Price Point Analysis
- Brands Share Analysis
- Criss-cross segment analysis- market size and forecast
Key Market Segments
By Source
- Milk
- Coconut
- Almond
- Oat
- Others
By Flavor
- Chocolate
- Caramel
- Vanilla
- Strawberry
- Others
By Distribution Channel
- On Trade
- Off Trade
- sub type
- Supermarkets and Hypermarkets
- Specialty Stores
- Convenience Stores
- Online Channels
By Region
- North America
- U.S.
- Canada
- Mexico
- Europe
- France
- Germany
- Italy
- Spain
- UK
- Russia
- Rest of Europe
- Asia-Pacific
- China
- Japan
- India
- South Korea
- Australia
- Thailand
- Malaysia
- Indonesia
- Rest of Asia-Pacific
- LAMEA
- Brazil
- South Africa
- Saudi Arabia
- United Arab Emirates
- Argentina
- Rest of LAMEA
Key Market Players:
- Heaven Hill Distilleries, Inc.
- Sazerac Company, Inc
- Distell Group Limited
- Pernod Ricard
- Grupo Zamora
- E. & J. Gallo Winery
- Buzzballz
- Terra Spirits & Liqueurs
- Diageo plc.
- Lucas Bols B.V
- McCormick
- DeKuyper Royal Distillers
- BEHN
TABLE OF CONTENTS
CHAPTER 1: INTRODUCTION
- 1.1. Report description
- 1.2. Key market segments
- 1.3. Key benefits to the stakeholders
- 1.4. Research methodology
- 1.4.1. Primary research
- 1.4.2. Secondary research
- 1.4.3. Analyst tools and models
CHAPTER 2: EXECUTIVE SUMMARY
- 2.1. CXO perspective
CHAPTER 3: MARKET OVERVIEW
- 3.1. Market definition and scope
- 3.2. Key findings
- 3.2.1. Top impacting factors
- 3.2.2. Top investment pockets
- 3.3. Porter's five forces analysis
- 3.3.1. Moderate bargaining power of suppliers
- 3.3.2. Moderate threat of new entrants
- 3.3.3. Moderate threat of substitutes
- 3.3.4. Moderate intensity of rivalry
- 3.3.5. Low bargaining power of buyers
- 3.4. Market dynamics
- 3.4.1. Drivers
- 3.4.1.1. Increased change in consumer preferences and lifestyle
- 3.4.1.2. Innovative Product Development and Marketing Strategies
- 3.4.1.3. Rise in globalization and international expansion
- 3.4.2. Restraints
- 3.4.2.1. Growth in health and dietary trends
- 3.4.2.2. Rise in Regulatory and Compliance Challenges
- 3.4.3. Opportunities
- 3.4.3.1. Innovative Product Diversification and Premiumization
- 3.4.1. Drivers
- 3.5. Market Share Analysis
- 3.6. Value Chain Analysis
CHAPTER 4: CREAM LIQUEUR MARKET, BY SOURCE
- 4.1. Overview
- 4.1.1. Market size and forecast
- 4.2. Milk
- 4.2.1. Key market trends, growth factors and opportunities
- 4.2.2. Market size and forecast, by region
- 4.2.3. Market share analysis by country
- 4.3. Coconut
- 4.3.1. Key market trends, growth factors and opportunities
- 4.3.2. Market size and forecast, by region
- 4.3.3. Market share analysis by country
- 4.4. Almond
- 4.4.1. Key market trends, growth factors and opportunities
- 4.4.2. Market size and forecast, by region
- 4.4.3. Market share analysis by country
- 4.5. Oat
- 4.5.1. Key market trends, growth factors and opportunities
- 4.5.2. Market size and forecast, by region
- 4.5.3. Market share analysis by country
- 4.6. Others
- 4.6.1. Key market trends, growth factors and opportunities
- 4.6.2. Market size and forecast, by region
- 4.6.3. Market share analysis by country
CHAPTER 5: CREAM LIQUEUR MARKET, BY FLAVOR
- 5.1. Overview
- 5.1.1. Market size and forecast
- 5.2. Chocolate
- 5.2.1. Key market trends, growth factors and opportunities
- 5.2.2. Market size and forecast, by region
- 5.2.3. Market share analysis by country
- 5.3. Caramel
- 5.3.1. Key market trends, growth factors and opportunities
- 5.3.2. Market size and forecast, by region
- 5.3.3. Market share analysis by country
- 5.4. Vanilla
- 5.4.1. Key market trends, growth factors and opportunities
- 5.4.2. Market size and forecast, by region
- 5.4.3. Market share analysis by country
- 5.5. Strawberry
- 5.5.1. Key market trends, growth factors and opportunities
- 5.5.2. Market size and forecast, by region
- 5.5.3. Market share analysis by country
- 5.6. Others
- 5.6.1. Key market trends, growth factors and opportunities
- 5.6.2. Market size and forecast, by region
- 5.6.3. Market share analysis by country
CHAPTER 6: CREAM LIQUEUR MARKET, BY DISTRIBUTION CHANNEL
- 6.1. Overview
- 6.1.1. Market size and forecast
- 6.2. On Trade
- 6.2.1. Key market trends, growth factors and opportunities
- 6.2.2. Market size and forecast, by region
- 6.2.3. Market share analysis by country
- 6.3. Off Trade
- 6.3.1. Key market trends, growth factors and opportunities
- 6.3.2. Market size and forecast, by region
- 6.3.3. Market share analysis by country
- 6.3.4. Off Trade Cream Liqueur Market by sub type
- 6.3.4.1. Supermarkets and Hypermarkets Market size and forecast, by region
- 6.3.4.2. Supermarkets and Hypermarkets Market size and forecast, by country
- 6.3.4.3. Specialty Stores Market size and forecast, by region
- 6.3.4.4. Specialty Stores Market size and forecast, by country
- 6.3.4.5. Convenience Stores Market size and forecast, by region
- 6.3.4.6. Convenience Stores Market size and forecast, by country
- 6.3.4.7. Online Channels Market size and forecast, by region
- 6.3.4.8. Online Channels Market size and forecast, by country
CHAPTER 7: CREAM LIQUEUR MARKET, BY REGION
- 7.1. Overview
- 7.1.1. Market size and forecast By Region
- 7.2. North America
- 7.2.1. Key market trends, growth factors and opportunities
- 7.2.2. Market size and forecast, by Source
- 7.2.3. Market size and forecast, by Flavor
- 7.2.4. Market size and forecast, by Distribution Channel
- 7.2.4.1. North America Off Trade Cream Liqueur Market by sub type
- 7.2.5. Market size and forecast, by country
- 7.2.5.1. U.S.
- 7.2.5.1.1. Market size and forecast, by Source
- 7.2.5.1.2. Market size and forecast, by Flavor
- 7.2.5.1.3. Market size and forecast, by Distribution Channel
- 7.2.5.1.3.1. U.S. Off Trade Cream Liqueur Market by sub type
- 7.2.5.2. Canada
- 7.2.5.2.1. Market size and forecast, by Source
- 7.2.5.2.2. Market size and forecast, by Flavor
- 7.2.5.2.3. Market size and forecast, by Distribution Channel
- 7.2.5.2.3.1. Canada Off Trade Cream Liqueur Market by sub type
- 7.2.5.3. Mexico
- 7.2.5.3.1. Market size and forecast, by Source
- 7.2.5.3.2. Market size and forecast, by Flavor
- 7.2.5.3.3. Market size and forecast, by Distribution Channel
- 7.2.5.3.3.1. Mexico Off Trade Cream Liqueur Market by sub type
- 7.3. Europe
- 7.3.1. Key market trends, growth factors and opportunities
- 7.3.2. Market size and forecast, by Source
- 7.3.3. Market size and forecast, by Flavor
- 7.3.4. Market size and forecast, by Distribution Channel
- 7.3.4.1. Europe Off Trade Cream Liqueur Market by sub type
- 7.3.5. Market size and forecast, by country
- 7.3.5.1. France
- 7.3.5.1.1. Market size and forecast, by Source
- 7.3.5.1.2. Market size and forecast, by Flavor
- 7.3.5.1.3. Market size and forecast, by Distribution Channel
- 7.3.5.1.3.1. France Off Trade Cream Liqueur Market by sub type
- 7.3.5.2. Germany
- 7.3.5.2.1. Market size and forecast, by Source
- 7.3.5.2.2. Market size and forecast, by Flavor
- 7.3.5.2.3. Market size and forecast, by Distribution Channel
- 7.3.5.2.3.1. Germany Off Trade Cream Liqueur Market by sub type
- 7.3.5.3. Italy
- 7.3.5.3.1. Market size and forecast, by Source
- 7.3.5.3.2. Market size and forecast, by Flavor
- 7.3.5.3.3. Market size and forecast, by Distribution Channel
- 7.3.5.3.3.1. Italy Off Trade Cream Liqueur Market by sub type
- 7.3.5.4. Spain
- 7.3.5.4.1. Market size and forecast, by Source
- 7.3.5.4.2. Market size and forecast, by Flavor
- 7.3.5.4.3. Market size and forecast, by Distribution Channel
- 7.3.5.4.3.1. Spain Off Trade Cream Liqueur Market by sub type
- 7.3.5.5. UK
- 7.3.5.5.1. Market size and forecast, by Source
- 7.3.5.5.2. Market size and forecast, by Flavor
- 7.3.5.5.3. Market size and forecast, by Distribution Channel
- 7.3.5.5.3.1. UK Off Trade Cream Liqueur Market by sub type
- 7.3.5.6. Russia
- 7.3.5.6.1. Market size and forecast, by Source
- 7.3.5.6.2. Market size and forecast, by Flavor
- 7.3.5.6.3. Market size and forecast, by Distribution Channel
- 7.3.5.6.3.1. Russia Off Trade Cream Liqueur Market by sub type
- 7.3.5.7. Rest of Europe
- 7.3.5.7.1. Market size and forecast, by Source
- 7.3.5.7.2. Market size and forecast, by Flavor
- 7.3.5.7.3. Market size and forecast, by Distribution Channel
- 7.3.5.7.3.1. Rest of Europe Off Trade Cream Liqueur Market by sub type
- 7.4. Asia-Pacific
- 7.4.1. Key market trends, growth factors and opportunities
- 7.4.2. Market size and forecast, by Source
- 7.4.3. Market size and forecast, by Flavor
- 7.4.4. Market size and forecast, by Distribution Channel
- 7.4.4.1. Asia-Pacific Off Trade Cream Liqueur Market by sub type
- 7.4.5. Market size and forecast, by country
- 7.4.5.1. China
- 7.4.5.1.1. Market size and forecast, by Source
- 7.4.5.1.2. Market size and forecast, by Flavor
- 7.4.5.1.3. Market size and forecast, by Distribution Channel
- 7.4.5.1.3.1. China Off Trade Cream Liqueur Market by sub type
- 7.4.5.2. Japan
- 7.4.5.2.1. Market size and forecast, by Source
- 7.4.5.2.2. Market size and forecast, by Flavor
- 7.4.5.2.3. Market size and forecast, by Distribution Channel
- 7.4.5.2.3.1. Japan Off Trade Cream Liqueur Market by sub type
- 7.4.5.3. India
- 7.4.5.3.1. Market size and forecast, by Source
- 7.4.5.3.2. Market size and forecast, by Flavor
- 7.4.5.3.3. Market size and forecast, by Distribution Channel
- 7.4.5.3.3.1. India Off Trade Cream Liqueur Market by sub type
- 7.4.5.4. South Korea
- 7.4.5.4.1. Market size and forecast, by Source
- 7.4.5.4.2. Market size and forecast, by Flavor
- 7.4.5.4.3. Market size and forecast, by Distribution Channel
- 7.4.5.4.3.1. South Korea Off Trade Cream Liqueur Market by sub type
- 7.4.5.5. Australia
- 7.4.5.5.1. Market size and forecast, by Source
- 7.4.5.5.2. Market size and forecast, by Flavor
- 7.4.5.5.3. Market size and forecast, by Distribution Channel
- 7.4.5.5.3.1. Australia Off Trade Cream Liqueur Market by sub type
- 7.4.5.6. Thailand
- 7.4.5.6.1. Market size and forecast, by Source
- 7.4.5.6.2. Market size and forecast, by Flavor
- 7.4.5.6.3. Market size and forecast, by Distribution Channel
- 7.4.5.6.3.1. Thailand Off Trade Cream Liqueur Market by sub type
- 7.4.5.7. Malaysia
- 7.4.5.7.1. Market size and forecast, by Source
- 7.4.5.7.2. Market size and forecast, by Flavor
- 7.4.5.7.3. Market size and forecast, by Distribution Channel
- 7.4.5.7.3.1. Malaysia Off Trade Cream Liqueur Market by sub type
- 7.4.5.8. Indonesia
- 7.4.5.8.1. Market size and forecast, by Source
- 7.4.5.8.2. Market size and forecast, by Flavor
- 7.4.5.8.3. Market size and forecast, by Distribution Channel
- 7.4.5.8.3.1. Indonesia Off Trade Cream Liqueur Market by sub type
- 7.4.5.9. Rest of Asia-Pacific
- 7.4.5.9.1. Market size and forecast, by Source
- 7.4.5.9.2. Market size and forecast, by Flavor
- 7.4.5.9.3. Market size and forecast, by Distribution Channel
- 7.4.5.9.3.1. Rest of Asia-Pacific Off Trade Cream Liqueur Market by sub type
- 7.5. LAMEA
- 7.5.1. Key market trends, growth factors and opportunities
- 7.5.2. Market size and forecast, by Source
- 7.5.3. Market size and forecast, by Flavor
- 7.5.4. Market size and forecast, by Distribution Channel
- 7.5.4.1. LAMEA Off Trade Cream Liqueur Market by sub type
- 7.5.5. Market size and forecast, by country
- 7.5.5.1. Brazil
- 7.5.5.1.1. Market size and forecast, by Source
- 7.5.5.1.2. Market size and forecast, by Flavor
- 7.5.5.1.3. Market size and forecast, by Distribution Channel
- 7.5.5.1.3.1. Brazil Off Trade Cream Liqueur Market by sub type
- 7.5.5.2. South Africa
- 7.5.5.2.1. Market size and forecast, by Source
- 7.5.5.2.2. Market size and forecast, by Flavor
- 7.5.5.2.3. Market size and forecast, by Distribution Channel
- 7.5.5.2.3.1. South Africa Off Trade Cream Liqueur Market by sub type
- 7.5.5.3. Saudi Arabia
- 7.5.5.3.1. Market size and forecast, by Source
- 7.5.5.3.2. Market size and forecast, by Flavor
- 7.5.5.3.3. Market size and forecast, by Distribution Channel
- 7.5.5.3.3.1. Saudi Arabia Off Trade Cream Liqueur Market by sub type
- 7.5.5.4. United Arab Emirates
- 7.5.5.4.1. Market size and forecast, by Source
- 7.5.5.4.2. Market size and forecast, by Flavor
- 7.5.5.4.3. Market size and forecast, by Distribution Channel
- 7.5.5.4.3.1. United Arab Emirates Off Trade Cream Liqueur Market by sub type
- 7.5.5.5. Argentina
- 7.5.5.5.1. Market size and forecast, by Source
- 7.5.5.5.2. Market size and forecast, by Flavor
- 7.5.5.5.3. Market size and forecast, by Distribution Channel
- 7.5.5.5.3.1. Argentina Off Trade Cream Liqueur Market by sub type
- 7.5.5.6. Rest of LAMEA
- 7.5.5.6.1. Market size and forecast, by Source
- 7.5.5.6.2. Market size and forecast, by Flavor
- 7.5.5.6.3. Market size and forecast, by Distribution Channel
- 7.5.5.6.3.1. Rest of LAMEA Off Trade Cream Liqueur Market by sub type
CHAPTER 8: COMPETITIVE LANDSCAPE
- 8.1. Introduction
- 8.2. Top winning strategies
- 8.3. Product mapping of top 10 player
- 8.4. Competitive dashboard
- 8.5. Competitive heatmap
- 8.6. Top player positioning, 2019
CHAPTER 9: COMPANY PROFILES
- 9.1. Diageo plc.
- 9.1.1. Company overview
- 9.1.2. Key executives
- 9.1.3. Company snapshot
- 9.1.4. Operating business segments
- 9.1.5. Product portfolio
- 9.1.6. Business performance
- 9.1.7. Key strategic moves and developments
- 9.2. E. & J. Gallo Winery
- 9.2.1. Company overview
- 9.2.2. Key executives
- 9.2.3. Company snapshot
- 9.2.4. Operating business segments
- 9.2.5. Product portfolio
- 9.2.6. Business performance
- 9.2.7. Key strategic moves and developments
- 9.3. Heaven Hill Distilleries, Inc.
- 9.3.1. Company overview
- 9.3.2. Key executives
- 9.3.3. Company snapshot
- 9.3.4. Operating business segments
- 9.3.5. Product portfolio
- 9.3.6. Business performance
- 9.3.7. Key strategic moves and developments
- 9.4. McCormick
- 9.4.1. Company overview
- 9.4.2. Key executives
- 9.4.3. Company snapshot
- 9.4.4. Operating business segments
- 9.4.5. Product portfolio
- 9.4.6. Business performance
- 9.4.7. Key strategic moves and developments
- 9.5. Grupo Zamora
- 9.5.1. Company overview
- 9.5.2. Key executives
- 9.5.3. Company snapshot
- 9.5.4. Operating business segments
- 9.5.5. Product portfolio
- 9.5.6. Business performance
- 9.5.7. Key strategic moves and developments
- 9.6. DeKuyper Royal Distillers
- 9.6.1. Company overview
- 9.6.2. Key executives
- 9.6.3. Company snapshot
- 9.6.4. Operating business segments
- 9.6.5. Product portfolio
- 9.6.6. Business performance
- 9.6.7. Key strategic moves and developments
- 9.7. BEHN
- 9.7.1. Company overview
- 9.7.2. Key executives
- 9.7.3. Company snapshot
- 9.7.4. Operating business segments
- 9.7.5. Product portfolio
- 9.7.6. Business performance
- 9.7.7. Key strategic moves and developments
- 9.8. Buzzballz
- 9.8.1. Company overview
- 9.8.2. Key executives
- 9.8.3. Company snapshot
- 9.8.4. Operating business segments
- 9.8.5. Product portfolio
- 9.8.6. Business performance
- 9.8.7. Key strategic moves and developments
- 9.9. Sazerac Company, Inc
- 9.9.1. Company overview
- 9.9.2. Key executives
- 9.9.3. Company snapshot
- 9.9.4. Operating business segments
- 9.9.5. Product portfolio
- 9.9.6. Business performance
- 9.9.7. Key strategic moves and developments
- 9.10. Lucas Bols B.V
- 9.10.1. Company overview
- 9.10.2. Key executives
- 9.10.3. Company snapshot
- 9.10.4. Operating business segments
- 9.10.5. Product portfolio
- 9.10.6. Business performance
- 9.10.7. Key strategic moves and developments
- 9.11. Pernod Ricard
- 9.11.1. Company overview
- 9.11.2. Key executives
- 9.11.3. Company snapshot
- 9.11.4. Operating business segments
- 9.11.5. Product portfolio
- 9.11.6. Business performance
- 9.11.7. Key strategic moves and developments
- 9.12. Terra Spirits & Liqueurs
- 9.12.1. Company overview
- 9.12.2. Key executives
- 9.12.3. Company snapshot
- 9.12.4. Operating business segments
- 9.12.5. Product portfolio
- 9.12.6. Business performance
- 9.12.7. Key strategic moves and developments
- 9.13. Distell Group Limited
- 9.13.1. Company overview
- 9.13.2. Key executives
- 9.13.3. Company snapshot
- 9.13.4. Operating business segments
- 9.13.5. Product portfolio
- 9.13.6. Business performance
- 9.13.7. Key strategic moves and developments
LIST OF TABLES
- TABLE 01. GLOBAL CREAM LIQUEUR MARKET, BY SOURCE, 2019-2029 ($MILLION)
- TABLE 02. CREAM LIQUEUR MARKET FOR MILK, BY REGION, 2019-2029 ($MILLION)
- TABLE 03. CREAM LIQUEUR MARKET FOR COCONUT, BY REGION, 2019-2029 ($MILLION)
- TABLE 04. CREAM LIQUEUR MARKET FOR ALMOND, BY REGION, 2019-2029 ($MILLION)
- TABLE 05. CREAM LIQUEUR MARKET FOR OAT, BY REGION, 2019-2029 ($MILLION)
- TABLE 06. CREAM LIQUEUR MARKET FOR OTHERS, BY REGION, 2019-2029 ($MILLION)
- TABLE 07. GLOBAL CREAM LIQUEUR MARKET, BY FLAVOR, 2019-2029 ($MILLION)
- TABLE 08. CREAM LIQUEUR MARKET FOR CHOCOLATE, BY REGION, 2019-2029 ($MILLION)
- TABLE 09. CREAM LIQUEUR MARKET FOR CARAMEL, BY REGION, 2019-2029 ($MILLION)
- TABLE 10. CREAM LIQUEUR MARKET FOR VANILLA, BY REGION, 2019-2029 ($MILLION)
- TABLE 11. CREAM LIQUEUR MARKET FOR STRAWBERRY, BY REGION, 2019-2029 ($MILLION)
- TABLE 12. CREAM LIQUEUR MARKET FOR OTHERS, BY REGION, 2019-2029 ($MILLION)
- TABLE 13. GLOBAL CREAM LIQUEUR MARKET, BY DISTRIBUTION CHANNEL, 2019-2029 ($MILLION)
- TABLE 14. CREAM LIQUEUR MARKET FOR ON TRADE, BY REGION, 2019-2029 ($MILLION)
- TABLE 15. CREAM LIQUEUR MARKET FOR OFF TRADE, BY REGION, 2019-2029 ($MILLION)
- TABLE 16. GLOBAL OFF TRADE CREAM LIQUEUR MARKET, BY SUB TYPE, 2019-2029 ($MILLION)
- TABLE 17. CREAM LIQUEUR MARKET FOR SUPERMARKETS AND HYPERMARKETS, BY REGION, 2019-2029 ($MILLION)
- TABLE 18. CREAM LIQUEUR MARKET FOR SPECIALTY STORES, BY REGION, 2019-2029 ($MILLION)
- TABLE 19. CREAM LIQUEUR MARKET FOR CONVENIENCE STORES, BY REGION, 2019-2029 ($MILLION)
- TABLE 20. CREAM LIQUEUR MARKET FOR ONLINE CHANNELS, BY REGION, 2019-2029 ($MILLION)
- TABLE 21. CREAM LIQUEUR MARKET, BY REGION, 2019-2029 ($MILLION)
- TABLE 22. NORTH AMERICA CREAM LIQUEUR MARKET, BY SOURCE, 2019-2029 ($MILLION)
- TABLE 23. NORTH AMERICA CREAM LIQUEUR MARKET, BY FLAVOR, 2019-2029 ($MILLION)
- TABLE 24. NORTH AMERICA CREAM LIQUEUR MARKET, BY DISTRIBUTION CHANNEL, 2019-2029 ($MILLION)
- TABLE 25. NORTH AMERICA OFF TRADE CREAM LIQUEUR MARKET, BY SUB TYPE, 2019-2029 ($MILLION)
- TABLE 26. NORTH AMERICA CREAM LIQUEUR MARKET, BY COUNTRY, 2019-2029 ($MILLION)
- TABLE 27. U.S. CREAM LIQUEUR MARKET, BY SOURCE, 2019-2029 ($MILLION)
- TABLE 28. U.S. CREAM LIQUEUR MARKET, BY FLAVOR, 2019-2029 ($MILLION)
- TABLE 29. U.S. CREAM LIQUEUR MARKET, BY DISTRIBUTION CHANNEL, 2019-2029 ($MILLION)
- TABLE 30. U.S. OFF TRADE CREAM LIQUEUR MARKET, BY SUB TYPE, 2019-2029 ($MILLION)
- TABLE 31. CANADA CREAM LIQUEUR MARKET, BY SOURCE, 2019-2029 ($MILLION)
- TABLE 32. CANADA CREAM LIQUEUR MARKET, BY FLAVOR, 2019-2029 ($MILLION)
- TABLE 33. CANADA CREAM LIQUEUR MARKET, BY DISTRIBUTION CHANNEL, 2019-2029 ($MILLION)
- TABLE 34. CANADA OFF TRADE CREAM LIQUEUR MARKET, BY SUB TYPE, 2019-2029 ($MILLION)
- TABLE 35. MEXICO CREAM LIQUEUR MARKET, BY SOURCE, 2019-2029 ($MILLION)
- TABLE 36. MEXICO CREAM LIQUEUR MARKET, BY FLAVOR, 2019-2029 ($MILLION)
- TABLE 37. MEXICO CREAM LIQUEUR MARKET, BY DISTRIBUTION CHANNEL, 2019-2029 ($MILLION)
- TABLE 38. MEXICO OFF TRADE CREAM LIQUEUR MARKET, BY SUB TYPE, 2019-2029 ($MILLION)
- TABLE 39. EUROPE CREAM LIQUEUR MARKET, BY SOURCE, 2019-2029 ($MILLION)
- TABLE 40. EUROPE CREAM LIQUEUR MARKET, BY FLAVOR, 2019-2029 ($MILLION)
- TABLE 41. EUROPE CREAM LIQUEUR MARKET, BY DISTRIBUTION CHANNEL, 2019-2029 ($MILLION)
- TABLE 42. EUROPE OFF TRADE CREAM LIQUEUR MARKET, BY SUB TYPE, 2019-2029 ($MILLION)
- TABLE 43. EUROPE CREAM LIQUEUR MARKET, BY COUNTRY, 2019-2029 ($MILLION)
- TABLE 44. FRANCE CREAM LIQUEUR MARKET, BY SOURCE, 2019-2029 ($MILLION)
- TABLE 45. FRANCE CREAM LIQUEUR MARKET, BY FLAVOR, 2019-2029 ($MILLION)
- TABLE 46. FRANCE CREAM LIQUEUR MARKET, BY DISTRIBUTION CHANNEL, 2019-2029 ($MILLION)
- TABLE 47. FRANCE OFF TRADE CREAM LIQUEUR MARKET, BY SUB TYPE, 2019-2029 ($MILLION)
- TABLE 48. GERMANY CREAM LIQUEUR MARKET, BY SOURCE, 2019-2029 ($MILLION)
- TABLE 49. GERMANY CREAM LIQUEUR MARKET, BY FLAVOR, 2019-2029 ($MILLION)
- TABLE 50. GERMANY CREAM LIQUEUR MARKET, BY DISTRIBUTION CHANNEL, 2019-2029 ($MILLION)
- TABLE 51. GERMANY OFF TRADE CREAM LIQUEUR MARKET, BY SUB TYPE, 2019-2029 ($MILLION)
- TABLE 52. ITALY CREAM LIQUEUR MARKET, BY SOURCE, 2019-2029 ($MILLION)
- TABLE 53. ITALY CREAM LIQUEUR MARKET, BY FLAVOR, 2019-2029 ($MILLION)
- TABLE 54. ITALY CREAM LIQUEUR MARKET, BY DISTRIBUTION CHANNEL, 2019-2029 ($MILLION)
- TABLE 55. ITALY OFF TRADE CREAM LIQUEUR MARKET, BY SUB TYPE, 2019-2029 ($MILLION)
- TABLE 56. SPAIN CREAM LIQUEUR MARKET, BY SOURCE, 2019-2029 ($MILLION)
- TABLE 57. SPAIN CREAM LIQUEUR MARKET, BY FLAVOR, 2019-2029 ($MILLION)
- TABLE 58. SPAIN CREAM LIQUEUR MARKET, BY DISTRIBUTION CHANNEL, 2019-2029 ($MILLION)
- TABLE 59. SPAIN OFF TRADE CREAM LIQUEUR MARKET, BY SUB TYPE, 2019-2029 ($MILLION)
- TABLE 60. UK CREAM LIQUEUR MARKET, BY SOURCE, 2019-2029 ($MILLION)
- TABLE 61. UK CREAM LIQUEUR MARKET, BY FLAVOR, 2019-2029 ($MILLION)
- TABLE 62. UK CREAM LIQUEUR MARKET, BY DISTRIBUTION CHANNEL, 2019-2029 ($MILLION)
- TABLE 63. UK OFF TRADE CREAM LIQUEUR MARKET, BY SUB TYPE, 2019-2029 ($MILLION)
- TABLE 64. RUSSIA CREAM LIQUEUR MARKET, BY SOURCE, 2019-2029 ($MILLION)
- TABLE 65. RUSSIA CREAM LIQUEUR MARKET, BY FLAVOR, 2019-2029 ($MILLION)
- TABLE 66. RUSSIA CREAM LIQUEUR MARKET, BY DISTRIBUTION CHANNEL, 2019-2029 ($MILLION)
- TABLE 67. RUSSIA OFF TRADE CREAM LIQUEUR MARKET, BY SUB TYPE, 2019-2029 ($MILLION)
- TABLE 68. REST OF EUROPE CREAM LIQUEUR MARKET, BY SOURCE, 2019-2029 ($MILLION)
- TABLE 69. REST OF EUROPE CREAM LIQUEUR MARKET, BY FLAVOR, 2019-2029 ($MILLION)
- TABLE 70. REST OF EUROPE CREAM LIQUEUR MARKET, BY DISTRIBUTION CHANNEL, 2019-2029 ($MILLION)
- TABLE 71. REST OF EUROPE OFF TRADE CREAM LIQUEUR MARKET, BY SUB TYPE, 2019-2029 ($MILLION)
- TABLE 72. ASIA-PACIFIC CREAM LIQUEUR MARKET, BY SOURCE, 2019-2029 ($MILLION)
- TABLE 73. ASIA-PACIFIC CREAM LIQUEUR MARKET, BY FLAVOR, 2019-2029 ($MILLION)
- TABLE 74. ASIA-PACIFIC CREAM LIQUEUR MARKET, BY DISTRIBUTION CHANNEL, 2019-2029 ($MILLION)
- TABLE 75. ASIA-PACIFIC OFF TRADE CREAM LIQUEUR MARKET, BY SUB TYPE, 2019-2029 ($MILLION)
- TABLE 76. ASIA-PACIFIC CREAM LIQUEUR MARKET, BY COUNTRY, 2019-2029 ($MILLION)
- TABLE 77. CHINA CREAM LIQUEUR MARKET, BY SOURCE, 2019-2029 ($MILLION)
- TABLE 78. CHINA CREAM LIQUEUR MARKET, BY FLAVOR, 2019-2029 ($MILLION)
- TABLE 79. CHINA CREAM LIQUEUR MARKET, BY DISTRIBUTION CHANNEL, 2019-2029 ($MILLION)
- TABLE 80. CHINA OFF TRADE CREAM LIQUEUR MARKET, BY SUB TYPE, 2019-2029 ($MILLION)
- TABLE 81. JAPAN CREAM LIQUEUR MARKET, BY SOURCE, 2019-2029 ($MILLION)
- TABLE 82. JAPAN CREAM LIQUEUR MARKET, BY FLAVOR, 2019-2029 ($MILLION)
- TABLE 83. JAPAN CREAM LIQUEUR MARKET, BY DISTRIBUTION CHANNEL, 2019-2029 ($MILLION)
- TABLE 84. JAPAN OFF TRADE CREAM LIQUEUR MARKET, BY SUB TYPE, 2019-2029 ($MILLION)
- TABLE 85. INDIA CREAM LIQUEUR MARKET, BY SOURCE, 2019-2029 ($MILLION)
- TABLE 86. INDIA CREAM LIQUEUR MARKET, BY FLAVOR, 2019-2029 ($MILLION)
- TABLE 87. INDIA CREAM LIQUEUR MARKET, BY DISTRIBUTION CHANNEL, 2019-2029 ($MILLION)
- TABLE 88. INDIA OFF TRADE CREAM LIQUEUR MARKET, BY SUB TYPE, 2019-2029 ($MILLION)
- TABLE 89. SOUTH KOREA CREAM LIQUEUR MARKET, BY SOURCE, 2019-2029 ($MILLION)
- TABLE 90. SOUTH KOREA CREAM LIQUEUR MARKET, BY FLAVOR, 2019-2029 ($MILLION)
- TABLE 91. SOUTH KOREA CREAM LIQUEUR MARKET, BY DISTRIBUTION CHANNEL, 2019-2029 ($MILLION)
- TABLE 92. SOUTH KOREA OFF TRADE CREAM LIQUEUR MARKET, BY SUB TYPE, 2019-2029 ($MILLION)
- TABLE 93. AUSTRALIA CREAM LIQUEUR MARKET, BY SOURCE, 2019-2029 ($MILLION)
- TABLE 94. AUSTRALIA CREAM LIQUEUR MARKET, BY FLAVOR, 2019-2029 ($MILLION)
- TABLE 95. AUSTRALIA CREAM LIQUEUR MARKET, BY DISTRIBUTION CHANNEL, 2019-2029 ($MILLION)
- TABLE 96. AUSTRALIA OFF TRADE CREAM LIQUEUR MARKET, BY SUB TYPE, 2019-2029 ($MILLION)
- TABLE 97. THAILAND CREAM LIQUEUR MARKET, BY SOURCE, 2019-2029 ($MILLION)
- TABLE 98. THAILAND CREAM LIQUEUR MARKET, BY FLAVOR, 2019-2029 ($MILLION)
- TABLE 99. THAILAND CREAM LIQUEUR MARKET, BY DISTRIBUTION CHANNEL, 2019-2029 ($MILLION)
- TABLE 100. THAILAND OFF TRADE CREAM LIQUEUR MARKET, BY SUB TYPE, 2019-2029 ($MILLION)
- TABLE 101. MALAYSIA CREAM LIQUEUR MARKET, BY SOURCE, 2019-2029 ($MILLION)
- TABLE 102. MALAYSIA CREAM LIQUEUR MARKET, BY FLAVOR, 2019-2029 ($MILLION)
- TABLE 103. MALAYSIA CREAM LIQUEUR MARKET, BY DISTRIBUTION CHANNEL, 2019-2029 ($MILLION)
- TABLE 104. MALAYSIA OFF TRADE CREAM LIQUEUR MARKET, BY SUB TYPE, 2019-2029 ($MILLION)
- TABLE 105. INDONESIA CREAM LIQUEUR MARKET, BY SOURCE, 2019-2029 ($MILLION)
- TABLE 106. INDONESIA CREAM LIQUEUR MARKET, BY FLAVOR, 2019-2029 ($MILLION)
- TABLE 107. INDONESIA CREAM LIQUEUR MARKET, BY DISTRIBUTION CHANNEL, 2019-2029 ($MILLION)
- TABLE 108. INDONESIA OFF TRADE CREAM LIQUEUR MARKET, BY SUB TYPE, 2019-2029 ($MILLION)
- TABLE 109. REST OF ASIA-PACIFIC CREAM LIQUEUR MARKET, BY SOURCE, 2019-2029 ($MILLION)
- TABLE 110. REST OF ASIA-PACIFIC CREAM LIQUEUR MARKET, BY FLAVOR, 2019-2029 ($MILLION)
- TABLE 111. REST OF ASIA-PACIFIC CREAM LIQUEUR MARKET, BY DISTRIBUTION CHANNEL, 2019-2029 ($MILLION)
- TABLE 112. REST OF ASIA-PACIFIC OFF TRADE CREAM LIQUEUR MARKET, BY SUB TYPE, 2019-2029 ($MILLION)
- TABLE 113. LAMEA CREAM LIQUEUR MARKET, BY SOURCE, 2019-2029 ($MILLION)
- TABLE 114. LAMEA CREAM LIQUEUR MARKET, BY FLAVOR, 2019-2029 ($MILLION)
- TABLE 115. LAMEA CREAM LIQUEUR MARKET, BY DISTRIBUTION CHANNEL, 2019-2029 ($MILLION)
- TABLE 116. LAMEA OFF TRADE CREAM LIQUEUR MARKET, BY SUB TYPE, 2019-2029 ($MILLION)
- TABLE 117. LAMEA CREAM LIQUEUR MARKET, BY COUNTRY, 2019-2029 ($MILLION)
- TABLE 118. BRAZIL CREAM LIQUEUR MARKET, BY SOURCE, 2019-2029 ($MILLION)
- TABLE 119. BRAZIL CREAM LIQUEUR MARKET, BY FLAVOR, 2019-2029 ($MILLION)
- TABLE 120. BRAZIL CREAM LIQUEUR MARKET, BY DISTRIBUTION CHANNEL, 2019-2029 ($MILLION)
- TABLE 121. BRAZIL OFF TRADE CREAM LIQUEUR MARKET, BY SUB TYPE, 2019-2029 ($MILLION)
- TABLE 122. SOUTH AFRICA CREAM LIQUEUR MARKET, BY SOURCE, 2019-2029 ($MILLION)
- TABLE 123. SOUTH AFRICA CREAM LIQUEUR MARKET, BY FLAVOR, 2019-2029 ($MILLION)
- TABLE 124. SOUTH AFRICA CREAM LIQUEUR MARKET, BY DISTRIBUTION CHANNEL, 2019-2029 ($MILLION)
- TABLE 125. SOUTH AFRICA OFF TRADE CREAM LIQUEUR MARKET, BY SUB TYPE, 2019-2029 ($MILLION)
- TABLE 126. SAUDI ARABIA CREAM LIQUEUR MARKET, BY SOURCE, 2019-2029 ($MILLION)
- TABLE 127. SAUDI ARABIA CREAM LIQUEUR MARKET, BY FLAVOR, 2019-2029 ($MILLION)
- TABLE 128. SAUDI ARABIA CREAM LIQUEUR MARKET, BY DISTRIBUTION CHANNEL, 2019-2029 ($MILLION)
- TABLE 129. SAUDI ARABIA OFF TRADE CREAM LIQUEUR MARKET, BY SUB TYPE, 2019-2029 ($MILLION)
- TABLE 130. UNITED ARAB EMIRATES CREAM LIQUEUR MARKET, BY SOURCE, 2019-2029 ($MILLION)
- TABLE 131. UNITED ARAB EMIRATES CREAM LIQUEUR MARKET, BY FLAVOR, 2019-2029 ($MILLION)
- TABLE 132. UNITED ARAB EMIRATES CREAM LIQUEUR MARKET, BY DISTRIBUTION CHANNEL, 2019-2029 ($MILLION)
- TABLE 133. UNITED ARAB EMIRATES OFF TRADE CREAM LIQUEUR MARKET, BY SUB TYPE, 2019-2029 ($MILLION)
- TABLE 134. ARGENTINA CREAM LIQUEUR MARKET, BY SOURCE, 2019-2029 ($MILLION)
- TABLE 135. ARGENTINA CREAM LIQUEUR MARKET, BY FLAVOR, 2019-2029 ($MILLION)
- TABLE 136. ARGENTINA CREAM LIQUEUR MARKET, BY DISTRIBUTION CHANNEL, 2019-2029 ($MILLION)
- TABLE 137. ARGENTINA OFF TRADE CREAM LIQUEUR MARKET, BY SUB TYPE, 2019-2029 ($MILLION)
- TABLE 138. REST OF LAMEA CREAM LIQUEUR MARKET, BY SOURCE, 2019-2029 ($MILLION)
- TABLE 139. REST OF LAMEA CREAM LIQUEUR MARKET, BY FLAVOR, 2019-2029 ($MILLION)
- TABLE 140. REST OF LAMEA CREAM LIQUEUR MARKET, BY DISTRIBUTION CHANNEL, 2019-2029 ($MILLION)
- TABLE 141. REST OF LAMEA OFF TRADE CREAM LIQUEUR MARKET, BY SUB TYPE, 2019-2029 ($MILLION)
- TABLE 142. DIAGEO PLC.: KEY EXECUTIVES
- TABLE 143. DIAGEO PLC.: COMPANY SNAPSHOT
- TABLE 144. DIAGEO PLC.: PRODUCT SEGMENTS
- TABLE 145. DIAGEO PLC.: SERVICE SEGMENTS
- TABLE 146. DIAGEO PLC.: PRODUCT PORTFOLIO
- TABLE 147. DIAGEO PLC.: KEY STRATERGIES
- TABLE 148. E. & J. GALLO WINERY: KEY EXECUTIVES
- TABLE 149. E. & J. GALLO WINERY: COMPANY SNAPSHOT
- TABLE 150. E. & J. GALLO WINERY: PRODUCT SEGMENTS
- TABLE 151. E. & J. GALLO WINERY: SERVICE SEGMENTS
- TABLE 152. E. & J. GALLO WINERY: PRODUCT PORTFOLIO
- TABLE 153. E. & J. GALLO WINERY: KEY STRATERGIES
- TABLE 154. HEAVEN HILL DISTILLERIES, INC.: KEY EXECUTIVES
- TABLE 155. HEAVEN HILL DISTILLERIES, INC.: COMPANY SNAPSHOT
- TABLE 156. HEAVEN HILL DISTILLERIES, INC.: PRODUCT SEGMENTS
- TABLE 157. HEAVEN HILL DISTILLERIES, INC.: SERVICE SEGMENTS
- TABLE 158. HEAVEN HILL DISTILLERIES, INC.: PRODUCT PORTFOLIO
- TABLE 159. HEAVEN HILL DISTILLERIES, INC.: KEY STRATERGIES
- TABLE 160. MCCORMICK: KEY EXECUTIVES
- TABLE 161. MCCORMICK: COMPANY SNAPSHOT
- TABLE 162. MCCORMICK: PRODUCT SEGMENTS
- TABLE 163. MCCORMICK: SERVICE SEGMENTS
- TABLE 164. MCCORMICK: PRODUCT PORTFOLIO
- TABLE 165. MCCORMICK: KEY STRATERGIES
- TABLE 166. GRUPO ZAMORA: KEY EXECUTIVES
- TABLE 167. GRUPO ZAMORA: COMPANY SNAPSHOT
- TABLE 168. GRUPO ZAMORA: PRODUCT SEGMENTS
- TABLE 169. GRUPO ZAMORA: SERVICE SEGMENTS
- TABLE 170. GRUPO ZAMORA: PRODUCT PORTFOLIO
- TABLE 171. GRUPO ZAMORA: KEY STRATERGIES
- TABLE 172. DEKUYPER ROYAL DISTILLERS: KEY EXECUTIVES
- TABLE 173. DEKUYPER ROYAL DISTILLERS: COMPANY SNAPSHOT
- TABLE 174. DEKUYPER ROYAL DISTILLERS: PRODUCT SEGMENTS
- TABLE 175. DEKUYPER ROYAL DISTILLERS: SERVICE SEGMENTS
- TABLE 176. DEKUYPER ROYAL DISTILLERS: PRODUCT PORTFOLIO
- TABLE 177. DEKUYPER ROYAL DISTILLERS: KEY STRATERGIES
- TABLE 178. BEHN: KEY EXECUTIVES
- TABLE 179. BEHN: COMPANY SNAPSHOT
- TABLE 180. BEHN: PRODUCT SEGMENTS
- TABLE 181. BEHN: SERVICE SEGMENTS
- TABLE 182. BEHN: PRODUCT PORTFOLIO
- TABLE 183. BEHN: KEY STRATERGIES
- TABLE 184. BUZZBALLZ: KEY EXECUTIVES
- TABLE 185. BUZZBALLZ: COMPANY SNAPSHOT
- TABLE 186. BUZZBALLZ: PRODUCT SEGMENTS
- TABLE 187. BUZZBALLZ: SERVICE SEGMENTS
- TABLE 188. BUZZBALLZ: PRODUCT PORTFOLIO
- TABLE 189. BUZZBALLZ: KEY STRATERGIES
- TABLE 190. SAZERAC COMPANY, INC: KEY EXECUTIVES
- TABLE 191. SAZERAC COMPANY, INC: COMPANY SNAPSHOT
- TABLE 192. SAZERAC COMPANY, INC: PRODUCT SEGMENTS
- TABLE 193. SAZERAC COMPANY, INC: SERVICE SEGMENTS
- TABLE 194. SAZERAC COMPANY, INC: PRODUCT PORTFOLIO
- TABLE 195. SAZERAC COMPANY, INC: KEY STRATERGIES
- TABLE 196. LUCAS BOLS B.V: KEY EXECUTIVES
- TABLE 197. LUCAS BOLS B.V: COMPANY SNAPSHOT
- TABLE 198. LUCAS BOLS B.V: PRODUCT SEGMENTS
- TABLE 199. LUCAS BOLS B.V: SERVICE SEGMENTS
- TABLE 200. LUCAS BOLS B.V: PRODUCT PORTFOLIO
- TABLE 201. LUCAS BOLS B.V: KEY STRATERGIES
- TABLE 202. PERNOD RICARD: KEY EXECUTIVES
- TABLE 203. PERNOD RICARD: COMPANY SNAPSHOT
- TABLE 204. PERNOD RICARD: PRODUCT SEGMENTS
- TABLE 205. PERNOD RICARD: SERVICE SEGMENTS
- TABLE 206. PERNOD RICARD: PRODUCT PORTFOLIO
- TABLE 207. PERNOD RICARD: KEY STRATERGIES
- TABLE 208. TERRA SPIRITS & LIQUEURS: KEY EXECUTIVES
- TABLE 209. TERRA SPIRITS & LIQUEURS: COMPANY SNAPSHOT
- TABLE 210. TERRA SPIRITS & LIQUEURS: PRODUCT SEGMENTS
- TABLE 211. TERRA SPIRITS & LIQUEURS: SERVICE SEGMENTS
- TABLE 212. TERRA SPIRITS & LIQUEURS: PRODUCT PORTFOLIO
- TABLE 213. TERRA SPIRITS & LIQUEURS: KEY STRATERGIES
- TABLE 214. DISTELL GROUP LIMITED: KEY EXECUTIVES
- TABLE 215. DISTELL GROUP LIMITED: COMPANY SNAPSHOT
- TABLE 216. DISTELL GROUP LIMITED: PRODUCT SEGMENTS
- TABLE 217. DISTELL GROUP LIMITED: SERVICE SEGMENTS
- TABLE 218. DISTELL GROUP LIMITED: PRODUCT PORTFOLIO
- TABLE 219. DISTELL GROUP LIMITED: KEY STRATERGIES
LIST OF FIGURES
- FIGURE 01. CREAM LIQUEUR MARKET, 2019-2029
- FIGURE 02. SEGMENTATION OF CREAM LIQUEUR MARKET,2019-2029
- FIGURE 03. TOP IMPACTING FACTORS IN CREAM LIQUEUR MARKET (2022 TO 2029)
- FIGURE 04. TOP INVESTMENT POCKETS IN CREAM LIQUEUR MARKET (2023-2029)
- FIGURE 05. MODERATE BARGAINING POWER OF SUPPLIERS
- FIGURE 06. MODERATE THREAT OF NEW ENTRANTS
- FIGURE 07. MODERATE THREAT OF SUBSTITUTES
- FIGURE 08. MODERATE INTENSITY OF RIVALRY
- FIGURE 09. LOW BARGAINING POWER OF BUYERS
- FIGURE 10. GLOBAL CREAM LIQUEUR MARKET:DRIVERS, RESTRAINTS AND OPPORTUNITIES
- FIGURE 11. CREAM LIQUEUR MARKET, BY SOURCE, 2019 AND 2029(%)
- FIGURE 12. COMPARATIVE SHARE ANALYSIS OF CREAM LIQUEUR MARKET FOR MILK, BY COUNTRY 2019 AND 2029(%)
- FIGURE 13. COMPARATIVE SHARE ANALYSIS OF CREAM LIQUEUR MARKET FOR COCONUT, BY COUNTRY 2019 AND 2029(%)
- FIGURE 14. COMPARATIVE SHARE ANALYSIS OF CREAM LIQUEUR MARKET FOR ALMOND, BY COUNTRY 2019 AND 2029(%)
- FIGURE 15. COMPARATIVE SHARE ANALYSIS OF CREAM LIQUEUR MARKET FOR OAT, BY COUNTRY 2019 AND 2029(%)
- FIGURE 16. COMPARATIVE SHARE ANALYSIS OF CREAM LIQUEUR MARKET FOR OTHERS, BY COUNTRY 2019 AND 2029(%)
- FIGURE 17. CREAM LIQUEUR MARKET, BY FLAVOR, 2019 AND 2029(%)
- FIGURE 18. COMPARATIVE SHARE ANALYSIS OF CREAM LIQUEUR MARKET FOR CHOCOLATE, BY COUNTRY 2019 AND 2029(%)
- FIGURE 19. COMPARATIVE SHARE ANALYSIS OF CREAM LIQUEUR MARKET FOR CARAMEL, BY COUNTRY 2019 AND 2029(%)
- FIGURE 20. COMPARATIVE SHARE ANALYSIS OF CREAM LIQUEUR MARKET FOR VANILLA, BY COUNTRY 2019 AND 2029(%)
- FIGURE 21. COMPARATIVE SHARE ANALYSIS OF CREAM LIQUEUR MARKET FOR STRAWBERRY, BY COUNTRY 2019 AND 2029(%)
- FIGURE 22. COMPARATIVE SHARE ANALYSIS OF CREAM LIQUEUR MARKET FOR OTHERS, BY COUNTRY 2019 AND 2029(%)
- FIGURE 23. CREAM LIQUEUR MARKET, BY DISTRIBUTION CHANNEL, 2019 AND 2029(%)
- FIGURE 24. COMPARATIVE SHARE ANALYSIS OF CREAM LIQUEUR MARKET FOR ON TRADE, BY COUNTRY 2019 AND 2029(%)
- FIGURE 25. COMPARATIVE SHARE ANALYSIS OF CREAM LIQUEUR MARKET FOR OFF TRADE, BY COUNTRY 2019 AND 2029(%)
- FIGURE 26. CREAM LIQUEUR MARKET BY REGION, 2019 AND 2029(%)
- FIGURE 27. U.S. CREAM LIQUEUR MARKET, 2019-2029 ($MILLION)
- FIGURE 28. CANADA CREAM LIQUEUR MARKET, 2019-2029 ($MILLION)
- FIGURE 29. MEXICO CREAM LIQUEUR MARKET, 2019-2029 ($MILLION)
- FIGURE 30. FRANCE CREAM LIQUEUR MARKET, 2019-2029 ($MILLION)
- FIGURE 31. GERMANY CREAM LIQUEUR MARKET, 2019-2029 ($MILLION)
- FIGURE 32. ITALY CREAM LIQUEUR MARKET, 2019-2029 ($MILLION)
- FIGURE 33. SPAIN CREAM LIQUEUR MARKET, 2019-2029 ($MILLION)
- FIGURE 34. UK CREAM LIQUEUR MARKET, 2019-2029 ($MILLION)
- FIGURE 35. RUSSIA CREAM LIQUEUR MARKET, 2019-2029 ($MILLION)
- FIGURE 36. REST OF EUROPE CREAM LIQUEUR MARKET, 2019-2029 ($MILLION)
- FIGURE 37. CHINA CREAM LIQUEUR MARKET, 2019-2029 ($MILLION)
- FIGURE 38. JAPAN CREAM LIQUEUR MARKET, 2019-2029 ($MILLION)
- FIGURE 39. INDIA CREAM LIQUEUR MARKET, 2019-2029 ($MILLION)
- FIGURE 40. SOUTH KOREA CREAM LIQUEUR MARKET, 2019-2029 ($MILLION)
- FIGURE 41. AUSTRALIA CREAM LIQUEUR MARKET, 2019-2029 ($MILLION)
- FIGURE 42. THAILAND CREAM LIQUEUR MARKET, 2019-2029 ($MILLION)
- FIGURE 43. MALAYSIA CREAM LIQUEUR MARKET, 2019-2029 ($MILLION)
- FIGURE 44. INDONESIA CREAM LIQUEUR MARKET, 2019-2029 ($MILLION)
- FIGURE 45. REST OF ASIA-PACIFIC CREAM LIQUEUR MARKET, 2019-2029 ($MILLION)
- FIGURE 46. BRAZIL CREAM LIQUEUR MARKET, 2019-2029 ($MILLION)
- FIGURE 47. SOUTH AFRICA CREAM LIQUEUR MARKET, 2019-2029 ($MILLION)
- FIGURE 48. SAUDI ARABIA CREAM LIQUEUR MARKET, 2019-2029 ($MILLION)
- FIGURE 49. UNITED ARAB EMIRATES CREAM LIQUEUR MARKET, 2019-2029 ($MILLION)
- FIGURE 50. ARGENTINA CREAM LIQUEUR MARKET, 2019-2029 ($MILLION)
- FIGURE 51. REST OF LAMEA CREAM LIQUEUR MARKET, 2019-2029 ($MILLION)
- FIGURE 52. TOP WINNING STRATEGIES, BY YEAR (2019-2024)
- FIGURE 53. TOP WINNING STRATEGIES, BY DEVELOPMENT (2019-2024)
- FIGURE 54. TOP WINNING STRATEGIES, BY COMPANY (2019-2024)
- FIGURE 55. PRODUCT MAPPING OF TOP 10 PLAYERS
- FIGURE 56. COMPETITIVE DASHBOARD
- FIGURE 57. COMPETITIVE HEATMAP: CREAM LIQUEUR MARKET
- FIGURE 58. TOP PLAYER POSITIONING, 2019

