
PUBLISHER: Allied Market Research | PRODUCT CODE: 1472349

PUBLISHER: Allied Market Research | PRODUCT CODE: 1472349
Home Audio Components Market By Product Type (Speakers, Soundbars, Home Theater System, Amplifiers, Others), By Distribution Channel (Online, Offline): Global Opportunity Analysis and Industry Forecast, 2023-2032
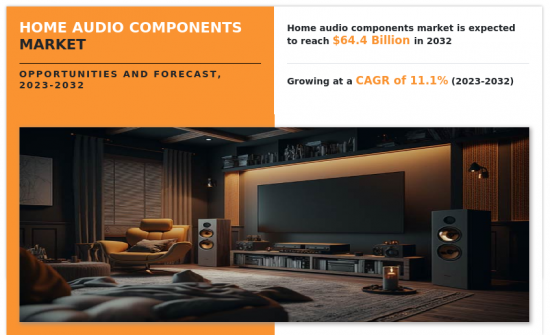
The Home Audio Components market was valued for $22.5 billion in 2022 and is estimated to reach $64.4 billion by 2032, exhibiting a CAGR of 11.13% from 2023 to 2032.
Home Audio Components equipment refers to electronic devices designed to reproduce high-quality sound within residential environments. These systems encompass a variety of components, including speakers, amplifiers, receivers, subwoofers, soundbars, and audio accessories. Home Audio Components equipment serves various purposes, such as listening to music, enhancing movie and gaming experiences, and creating immersive soundscapes. These systems can range from simple stereo setups to sophisticated multi-channel configurations. With advancements in technology, Home Audio Components equipment now often includes features like wireless connectivity, voice control, and compatibility with streaming services. Ultimately, Home Audio Components equipment aims to provide users with an immersive and enjoyable audio experience within the comfort of their homes.
Home Audio Components equipment is commonly crafted from a range of materials to ensure excellent performance and durability. These may include plastic, metal alloys like aluminum or steel, wood, and various composite materials. Speaker cones and enclosures are usually fashioned from lightweight yet sturdy materials to deliver clear and precise sound. Moreover, cables and connectors are often composed of copper or other conductive metals to facilitate effective signal transmission and connectivity.
The main users of Home Audio Components equipment comprise a broad spectrum of individuals and households aiming to elevate their audio experiences within their homes. This encompasses audiophiles, music aficionados, cinema enthusiasts, gamers, and everyday consumers seeking quality sound for entertainment. Moreover, establishments like restaurants, cafes, and retail stores may employ Home Audio Components systems to foster welcoming environments for patrons. Additionally, as smart home adoption rises, homeowners integrating audio setups into their automated environments represent a notable segment of end users.
The demand for wireless audio solutions in the Home Audio Components market is strongly influenced by convenience and aesthetics. Wireless systems offer the advantage of eliminating cables, providing greater flexibility in placement and reducing visual clutter in homes. This flexibility allows users to easily relocate speakers or create multi-room setups without the constraints of wiring. Moreover, wireless speakers and soundbars often boast modern, sleek designs that seamlessly complement contemporary home decor, enhancing overall aesthetics. The straightforward setup and operation, combined with the visually appealing aspects of wireless audio devices, resonate with consumers seeking both practicality and style in their home entertainment setups, thus fueling the growing demand for wireless audio solutions.
However, technological fragmentation poses a hurdle for the Home Audio Components market, stemming from the fast-paced evolution of diverse standards and formats. This variation leads to compatibility challenges among different audio devices, impeding smooth integration and interoperability. Consumers may encounter confusion in selecting compatible products, which can deter them from investing in new systems. Moreover, manufacturers are tasked with managing the complexities of supporting various standards and ensuring backward compatibility, which can inflate development costs and delay product launches. Addressing technological fragmentation necessitates industry cooperation to establish shared standards and interoperability protocols, fostering a more unified and user-friendly ecosystem.
The primary aim of the home audio components market is to furnish consumers with top-notch audio solutions tailored for their residential spaces. This entails providing a diverse array of audio equipment and systems that offer immersive sound experiences for various entertainment activities like music, movies, and gaming. Manufacturers continuously innovate with cutting-edge technologies such as wireless connectivity, voice control, and personalized sound profiles to cater to changing consumer preferences. Moreover, the market endeavors to enhance user convenience through straightforward installation, user-friendly interfaces, and seamless integration with smart home setups. Ultimately, the objective is to elevate the home entertainment experience by delivering exceptional audio performance and adaptability to global consumers.
The Home Audio Components market is segmented on the basis of product type, distribution channel and region. By product type, the market is segmented into speakers, soundbars, home theater system, amplifiers and others. As per distribution channel, the market is classified into online and offline.
By region, it is analyzed across North America (the U.S., Canada, and Mexico), Europe (UK, Germany, France, Italy, and rest of Europe), Asia-Pacific (China, Japan, India, Australia, South Korea, and rest of Asia-Pacific), and Latin America (Brazil, Argentina, and rest of Latin America) and Middle East and Africa (UAE, Saudi Arabia, South Africa and Rest of MEA).
Competitive analysis and profiles of the major Home Audio Components market players, such as Bose Corporation, Sony Corporation, Samsung Electronics Co., Ltd., LG Electronics Inc., Apple Inc., Panasonic Corporation, Yamaha Corporation, Sonos Inc., Amazon.com Inc., and Google LLC, are provided in this report. Business strategies such as product launch, product development, acquisition and partnership were adopted by the major market players in 2022.
Additional benefits you will get with this purchase are:
- Quarterly Update and* (only available with a corporate license, on listed price)
- 5 additional Company Profile of client Choice pre- or Post-purchase, as a free update.
- Free Upcoming Version on the Purchase of Five and Enterprise User License.
- 16 analyst hours of support* (post-purchase, if you find additional data requirements upon review of the report, you may receive support amounting to 16 analyst hours to solve questions, and post-sale queries)
- 15% Free Customization* (in case the scope or segment of the report does not match your requirements, 15% is equivalent to 3 working days of free work, applicable once)
- Free data Pack on the Five and Enterprise User License. (Excel version of the report)
- Free Updated report if the report is 6-12 months old or older.
- 24-hour priority response*
- Free Industry updates and white papers.
Possible Customization with this report (with additional cost and timeline, please talk to the sales executive to know more)
- End user preferences and pain points
- Technology Trend Analysis
- New Product Development/ Product Matrix of Key Players
- Additional company profiles with specific to client's interest
- SWOT Analysis
Key Market Segments
By Product Type
- Speakers
- Soundbars
- Home Theater System
- Amplifiers
- Others
By Distribution Channel
- Online
- Offline
By Region
- North America
- U.S.
- Canada
- Mexico
- Europe
- UK
- Germany
- France
- Italy
- Rest of Europe
- Asia-Pacific
- China
- Japan
- India
- Australia
- South Korea
- Rest of Asia-Pacific
- Latin America
- Brazil
- Argentina
- Rest of Latin America
- Middle East and Africa
- UAE
- Saudi Arabia
- South Africa
- Rest of Middle East And Africa
Key Market Players:
- Bose Corporation
- Sony Corporation
- SAMSUNG ELECTRONICS CO., LTD.
- LG Electronics Inc.
- Apple Inc.
- Panasonic Corporation
- Yamaha Corporation
- Sonos, Inc.
- Amazon.com Inc.
- Google LLC
TABLE OF CONTENTS
CHAPTER 1: INTRODUCTION
- 1.1. Report description
- 1.2. Key market segments
- 1.3. Key benefits to the stakeholders
- 1.4. Research methodology
- 1.4.1. Primary research
- 1.4.2. Secondary research
- 1.4.3. Analyst tools and models
CHAPTER 2: EXECUTIVE SUMMARY
- 2.1. CXO perspective
CHAPTER 3: MARKET OVERVIEW
- 3.1. Market definition and scope
- 3.2. Key findings
- 3.2.1. Top impacting factors
- 3.2.2. Top investment pockets
- 3.3. Porter's five forces analysis
- 3.4. Market dynamics
- 3.4.1. Drivers
- 3.4.2. Restraints
- 3.4.3. Opportunities
CHAPTER 4: HOME AUDIO COMPONENTS MARKET, BY PRODUCT TYPE
- 4.1. Overview
- 4.1.1. Market size and forecast
- 4.2. Speakers
- 4.2.1. Key market trends, growth factors and opportunities
- 4.2.2. Market size and forecast, by region
- 4.2.3. Market share analysis by country
- 4.3. Soundbars
- 4.3.1. Key market trends, growth factors and opportunities
- 4.3.2. Market size and forecast, by region
- 4.3.3. Market share analysis by country
- 4.4. Home Theater System
- 4.4.1. Key market trends, growth factors and opportunities
- 4.4.2. Market size and forecast, by region
- 4.4.3. Market share analysis by country
- 4.5. Amplifiers
- 4.5.1. Key market trends, growth factors and opportunities
- 4.5.2. Market size and forecast, by region
- 4.5.3. Market share analysis by country
- 4.6. Others
- 4.6.1. Key market trends, growth factors and opportunities
- 4.6.2. Market size and forecast, by region
- 4.6.3. Market share analysis by country
CHAPTER 5: HOME AUDIO COMPONENTS MARKET, BY DISTRIBUTION CHANNEL
- 5.1. Overview
- 5.1.1. Market size and forecast
- 5.2. Online
- 5.2.1. Key market trends, growth factors and opportunities
- 5.2.2. Market size and forecast, by region
- 5.2.3. Market share analysis by country
- 5.3. Offline
- 5.3.1. Key market trends, growth factors and opportunities
- 5.3.2. Market size and forecast, by region
- 5.3.3. Market share analysis by country
CHAPTER 6: HOME AUDIO COMPONENTS MARKET, BY REGION
- 6.1. Overview
- 6.1.1. Market size and forecast By Region
- 6.2. North America
- 6.2.1. Key market trends, growth factors and opportunities
- 6.2.2. Market size and forecast, by Product Type
- 6.2.3. Market size and forecast, by Distribution Channel
- 6.2.4. Market size and forecast, by country
- 6.2.4.1. U.S.
- 6.2.4.1.1. Market size and forecast, by Product Type
- 6.2.4.1.2. Market size and forecast, by Distribution Channel
- 6.2.4.2. Canada
- 6.2.4.2.1. Market size and forecast, by Product Type
- 6.2.4.2.2. Market size and forecast, by Distribution Channel
- 6.2.4.3. Mexico
- 6.2.4.3.1. Market size and forecast, by Product Type
- 6.2.4.3.2. Market size and forecast, by Distribution Channel
- 6.3. Europe
- 6.3.1. Key market trends, growth factors and opportunities
- 6.3.2. Market size and forecast, by Product Type
- 6.3.3. Market size and forecast, by Distribution Channel
- 6.3.4. Market size and forecast, by country
- 6.3.4.1. UK
- 6.3.4.1.1. Market size and forecast, by Product Type
- 6.3.4.1.2. Market size and forecast, by Distribution Channel
- 6.3.4.2. Germany
- 6.3.4.2.1. Market size and forecast, by Product Type
- 6.3.4.2.2. Market size and forecast, by Distribution Channel
- 6.3.4.3. France
- 6.3.4.3.1. Market size and forecast, by Product Type
- 6.3.4.3.2. Market size and forecast, by Distribution Channel
- 6.3.4.4. Italy
- 6.3.4.4.1. Market size and forecast, by Product Type
- 6.3.4.4.2. Market size and forecast, by Distribution Channel
- 6.3.4.5. Rest of Europe
- 6.3.4.5.1. Market size and forecast, by Product Type
- 6.3.4.5.2. Market size and forecast, by Distribution Channel
- 6.4. Asia-Pacific
- 6.4.1. Key market trends, growth factors and opportunities
- 6.4.2. Market size and forecast, by Product Type
- 6.4.3. Market size and forecast, by Distribution Channel
- 6.4.4. Market size and forecast, by country
- 6.4.4.1. China
- 6.4.4.1.1. Market size and forecast, by Product Type
- 6.4.4.1.2. Market size and forecast, by Distribution Channel
- 6.4.4.2. Japan
- 6.4.4.2.1. Market size and forecast, by Product Type
- 6.4.4.2.2. Market size and forecast, by Distribution Channel
- 6.4.4.3. India
- 6.4.4.3.1. Market size and forecast, by Product Type
- 6.4.4.3.2. Market size and forecast, by Distribution Channel
- 6.4.4.4. Australia
- 6.4.4.4.1. Market size and forecast, by Product Type
- 6.4.4.4.2. Market size and forecast, by Distribution Channel
- 6.4.4.5. South Korea
- 6.4.4.5.1. Market size and forecast, by Product Type
- 6.4.4.5.2. Market size and forecast, by Distribution Channel
- 6.4.4.6. Rest of Asia-Pacific
- 6.4.4.6.1. Market size and forecast, by Product Type
- 6.4.4.6.2. Market size and forecast, by Distribution Channel
- 6.5. Latin America
- 6.5.1. Key market trends, growth factors and opportunities
- 6.5.2. Market size and forecast, by Product Type
- 6.5.3. Market size and forecast, by Distribution Channel
- 6.5.4. Market size and forecast, by country
- 6.5.4.1. Brazil
- 6.5.4.1.1. Market size and forecast, by Product Type
- 6.5.4.1.2. Market size and forecast, by Distribution Channel
- 6.5.4.2. Argentina
- 6.5.4.2.1. Market size and forecast, by Product Type
- 6.5.4.2.2. Market size and forecast, by Distribution Channel
- 6.5.4.3. Rest of Latin America
- 6.5.4.3.1. Market size and forecast, by Product Type
- 6.5.4.3.2. Market size and forecast, by Distribution Channel
- 6.6. Middle East and Africa
- 6.6.1. Key market trends, growth factors and opportunities
- 6.6.2. Market size and forecast, by Product Type
- 6.6.3. Market size and forecast, by Distribution Channel
- 6.6.4. Market size and forecast, by country
- 6.6.4.1. UAE
- 6.6.4.1.1. Market size and forecast, by Product Type
- 6.6.4.1.2. Market size and forecast, by Distribution Channel
- 6.6.4.2. Saudi Arabia
- 6.6.4.2.1. Market size and forecast, by Product Type
- 6.6.4.2.2. Market size and forecast, by Distribution Channel
- 6.6.4.3. South Africa
- 6.6.4.3.1. Market size and forecast, by Product Type
- 6.6.4.3.2. Market size and forecast, by Distribution Channel
- 6.6.4.4. Rest of Middle East And Africa
- 6.6.4.4.1. Market size and forecast, by Product Type
- 6.6.4.4.2. Market size and forecast, by Distribution Channel
CHAPTER 7: COMPETITIVE LANDSCAPE
- 7.1. Introduction
- 7.2. Top winning strategies
- 7.3. Product mapping of top 10 player
- 7.4. Competitive dashboard
- 7.5. Competitive heatmap
- 7.6. Top player positioning, 2022
CHAPTER 8: COMPANY PROFILES
- 8.1. Bose Corporation
- 8.1.1. Company overview
- 8.1.2. Key executives
- 8.1.3. Company snapshot
- 8.1.4. Operating business segments
- 8.1.5. Product portfolio
- 8.1.6. Business performance
- 8.1.7. Key strategic moves and developments
- 8.2. Sony Corporation
- 8.2.1. Company overview
- 8.2.2. Key executives
- 8.2.3. Company snapshot
- 8.2.4. Operating business segments
- 8.2.5. Product portfolio
- 8.2.6. Business performance
- 8.2.7. Key strategic moves and developments
- 8.3. SAMSUNG ELECTRONICS CO., LTD.
- 8.3.1. Company overview
- 8.3.2. Key executives
- 8.3.3. Company snapshot
- 8.3.4. Operating business segments
- 8.3.5. Product portfolio
- 8.3.6. Business performance
- 8.3.7. Key strategic moves and developments
- 8.4. LG Electronics Inc.
- 8.4.1. Company overview
- 8.4.2. Key executives
- 8.4.3. Company snapshot
- 8.4.4. Operating business segments
- 8.4.5. Product portfolio
- 8.4.6. Business performance
- 8.4.7. Key strategic moves and developments
- 8.5. Apple Inc.
- 8.5.1. Company overview
- 8.5.2. Key executives
- 8.5.3. Company snapshot
- 8.5.4. Operating business segments
- 8.5.5. Product portfolio
- 8.5.6. Business performance
- 8.5.7. Key strategic moves and developments
- 8.6. Panasonic Corporation
- 8.6.1. Company overview
- 8.6.2. Key executives
- 8.6.3. Company snapshot
- 8.6.4. Operating business segments
- 8.6.5. Product portfolio
- 8.6.6. Business performance
- 8.6.7. Key strategic moves and developments
- 8.7. Yamaha Corporation
- 8.7.1. Company overview
- 8.7.2. Key executives
- 8.7.3. Company snapshot
- 8.7.4. Operating business segments
- 8.7.5. Product portfolio
- 8.7.6. Business performance
- 8.7.7. Key strategic moves and developments
- 8.8. Sonos, Inc.
- 8.8.1. Company overview
- 8.8.2. Key executives
- 8.8.3. Company snapshot
- 8.8.4. Operating business segments
- 8.8.5. Product portfolio
- 8.8.6. Business performance
- 8.8.7. Key strategic moves and developments
- 8.9. Amazon.com Inc.
- 8.9.1. Company overview
- 8.9.2. Key executives
- 8.9.3. Company snapshot
- 8.9.4. Operating business segments
- 8.9.5. Product portfolio
- 8.9.6. Business performance
- 8.9.7. Key strategic moves and developments
- 8.10. Google LLC
- 8.10.1. Company overview
- 8.10.2. Key executives
- 8.10.3. Company snapshot
- 8.10.4. Operating business segments
- 8.10.5. Product portfolio
- 8.10.6. Business performance
- 8.10.7. Key strategic moves and developments
LIST OF TABLES
- TABLE 01. GLOBAL HOME AUDIO COMPONENTS MARKET, BY PRODUCT TYPE, 2022-2032 ($MILLION)
- TABLE 02. HOME AUDIO COMPONENTS MARKET FOR SPEAKERS, BY REGION, 2022-2032 ($MILLION)
- TABLE 03. HOME AUDIO COMPONENTS MARKET FOR SOUNDBARS, BY REGION, 2022-2032 ($MILLION)
- TABLE 04. HOME AUDIO COMPONENTS MARKET FOR HOME THEATER SYSTEM, BY REGION, 2022-2032 ($MILLION)
- TABLE 05. HOME AUDIO COMPONENTS MARKET FOR AMPLIFIERS, BY REGION, 2022-2032 ($MILLION)
- TABLE 06. HOME AUDIO COMPONENTS MARKET FOR OTHERS, BY REGION, 2022-2032 ($MILLION)
- TABLE 07. GLOBAL HOME AUDIO COMPONENTS MARKET, BY DISTRIBUTION CHANNEL, 2022-2032 ($MILLION)
- TABLE 08. HOME AUDIO COMPONENTS MARKET FOR ONLINE, BY REGION, 2022-2032 ($MILLION)
- TABLE 09. HOME AUDIO COMPONENTS MARKET FOR OFFLINE, BY REGION, 2022-2032 ($MILLION)
- TABLE 10. HOME AUDIO COMPONENTS MARKET, BY REGION, 2022-2032 ($MILLION)
- TABLE 11. NORTH AMERICA HOME AUDIO COMPONENTS MARKET, BY PRODUCT TYPE, 2022-2032 ($MILLION)
- TABLE 12. NORTH AMERICA HOME AUDIO COMPONENTS MARKET, BY DISTRIBUTION CHANNEL, 2022-2032 ($MILLION)
- TABLE 13. NORTH AMERICA HOME AUDIO COMPONENTS MARKET, BY COUNTRY, 2022-2032 ($MILLION)
- TABLE 14. U.S. HOME AUDIO COMPONENTS MARKET, BY PRODUCT TYPE, 2022-2032 ($MILLION)
- TABLE 15. U.S. HOME AUDIO COMPONENTS MARKET, BY DISTRIBUTION CHANNEL, 2022-2032 ($MILLION)
- TABLE 16. CANADA HOME AUDIO COMPONENTS MARKET, BY PRODUCT TYPE, 2022-2032 ($MILLION)
- TABLE 17. CANADA HOME AUDIO COMPONENTS MARKET, BY DISTRIBUTION CHANNEL, 2022-2032 ($MILLION)
- TABLE 18. MEXICO HOME AUDIO COMPONENTS MARKET, BY PRODUCT TYPE, 2022-2032 ($MILLION)
- TABLE 19. MEXICO HOME AUDIO COMPONENTS MARKET, BY DISTRIBUTION CHANNEL, 2022-2032 ($MILLION)
- TABLE 20. EUROPE HOME AUDIO COMPONENTS MARKET, BY PRODUCT TYPE, 2022-2032 ($MILLION)
- TABLE 21. EUROPE HOME AUDIO COMPONENTS MARKET, BY DISTRIBUTION CHANNEL, 2022-2032 ($MILLION)
- TABLE 22. EUROPE HOME AUDIO COMPONENTS MARKET, BY COUNTRY, 2022-2032 ($MILLION)
- TABLE 23. UK HOME AUDIO COMPONENTS MARKET, BY PRODUCT TYPE, 2022-2032 ($MILLION)
- TABLE 24. UK HOME AUDIO COMPONENTS MARKET, BY DISTRIBUTION CHANNEL, 2022-2032 ($MILLION)
- TABLE 25. GERMANY HOME AUDIO COMPONENTS MARKET, BY PRODUCT TYPE, 2022-2032 ($MILLION)
- TABLE 26. GERMANY HOME AUDIO COMPONENTS MARKET, BY DISTRIBUTION CHANNEL, 2022-2032 ($MILLION)
- TABLE 27. FRANCE HOME AUDIO COMPONENTS MARKET, BY PRODUCT TYPE, 2022-2032 ($MILLION)
- TABLE 28. FRANCE HOME AUDIO COMPONENTS MARKET, BY DISTRIBUTION CHANNEL, 2022-2032 ($MILLION)
- TABLE 29. ITALY HOME AUDIO COMPONENTS MARKET, BY PRODUCT TYPE, 2022-2032 ($MILLION)
- TABLE 30. ITALY HOME AUDIO COMPONENTS MARKET, BY DISTRIBUTION CHANNEL, 2022-2032 ($MILLION)
- TABLE 31. REST OF EUROPE HOME AUDIO COMPONENTS MARKET, BY PRODUCT TYPE, 2022-2032 ($MILLION)
- TABLE 32. REST OF EUROPE HOME AUDIO COMPONENTS MARKET, BY DISTRIBUTION CHANNEL, 2022-2032 ($MILLION)
- TABLE 33. ASIA-PACIFIC HOME AUDIO COMPONENTS MARKET, BY PRODUCT TYPE, 2022-2032 ($MILLION)
- TABLE 34. ASIA-PACIFIC HOME AUDIO COMPONENTS MARKET, BY DISTRIBUTION CHANNEL, 2022-2032 ($MILLION)
- TABLE 35. ASIA-PACIFIC HOME AUDIO COMPONENTS MARKET, BY COUNTRY, 2022-2032 ($MILLION)
- TABLE 36. CHINA HOME AUDIO COMPONENTS MARKET, BY PRODUCT TYPE, 2022-2032 ($MILLION)
- TABLE 37. CHINA HOME AUDIO COMPONENTS MARKET, BY DISTRIBUTION CHANNEL, 2022-2032 ($MILLION)
- TABLE 38. JAPAN HOME AUDIO COMPONENTS MARKET, BY PRODUCT TYPE, 2022-2032 ($MILLION)
- TABLE 39. JAPAN HOME AUDIO COMPONENTS MARKET, BY DISTRIBUTION CHANNEL, 2022-2032 ($MILLION)
- TABLE 40. INDIA HOME AUDIO COMPONENTS MARKET, BY PRODUCT TYPE, 2022-2032 ($MILLION)
- TABLE 41. INDIA HOME AUDIO COMPONENTS MARKET, BY DISTRIBUTION CHANNEL, 2022-2032 ($MILLION)
- TABLE 42. AUSTRALIA HOME AUDIO COMPONENTS MARKET, BY PRODUCT TYPE, 2022-2032 ($MILLION)
- TABLE 43. AUSTRALIA HOME AUDIO COMPONENTS MARKET, BY DISTRIBUTION CHANNEL, 2022-2032 ($MILLION)
- TABLE 44. SOUTH KOREA HOME AUDIO COMPONENTS MARKET, BY PRODUCT TYPE, 2022-2032 ($MILLION)
- TABLE 45. SOUTH KOREA HOME AUDIO COMPONENTS MARKET, BY DISTRIBUTION CHANNEL, 2022-2032 ($MILLION)
- TABLE 46. REST OF ASIA-PACIFIC HOME AUDIO COMPONENTS MARKET, BY PRODUCT TYPE, 2022-2032 ($MILLION)
- TABLE 47. REST OF ASIA-PACIFIC HOME AUDIO COMPONENTS MARKET, BY DISTRIBUTION CHANNEL, 2022-2032 ($MILLION)
- TABLE 48. LATIN AMERICA HOME AUDIO COMPONENTS MARKET, BY PRODUCT TYPE, 2022-2032 ($MILLION)
- TABLE 49. LATIN AMERICA HOME AUDIO COMPONENTS MARKET, BY DISTRIBUTION CHANNEL, 2022-2032 ($MILLION)
- TABLE 50. LATIN AMERICA HOME AUDIO COMPONENTS MARKET, BY COUNTRY, 2022-2032 ($MILLION)
- TABLE 51. BRAZIL HOME AUDIO COMPONENTS MARKET, BY PRODUCT TYPE, 2022-2032 ($MILLION)
- TABLE 52. BRAZIL HOME AUDIO COMPONENTS MARKET, BY DISTRIBUTION CHANNEL, 2022-2032 ($MILLION)
- TABLE 53. ARGENTINA HOME AUDIO COMPONENTS MARKET, BY PRODUCT TYPE, 2022-2032 ($MILLION)
- TABLE 54. ARGENTINA HOME AUDIO COMPONENTS MARKET, BY DISTRIBUTION CHANNEL, 2022-2032 ($MILLION)
- TABLE 55. REST OF LATIN AMERICA HOME AUDIO COMPONENTS MARKET, BY PRODUCT TYPE, 2022-2032 ($MILLION)
- TABLE 56. REST OF LATIN AMERICA HOME AUDIO COMPONENTS MARKET, BY DISTRIBUTION CHANNEL, 2022-2032 ($MILLION)
- TABLE 57. MIDDLE EAST AND AFRICA HOME AUDIO COMPONENTS MARKET, BY PRODUCT TYPE, 2022-2032 ($MILLION)
- TABLE 58. MIDDLE EAST AND AFRICA HOME AUDIO COMPONENTS MARKET, BY DISTRIBUTION CHANNEL, 2022-2032 ($MILLION)
- TABLE 59. MIDDLE EAST AND AFRICA HOME AUDIO COMPONENTS MARKET, BY COUNTRY, 2022-2032 ($MILLION)
- TABLE 60. UAE HOME AUDIO COMPONENTS MARKET, BY PRODUCT TYPE, 2022-2032 ($MILLION)
- TABLE 61. UAE HOME AUDIO COMPONENTS MARKET, BY DISTRIBUTION CHANNEL, 2022-2032 ($MILLION)
- TABLE 62. SAUDI ARABIA HOME AUDIO COMPONENTS MARKET, BY PRODUCT TYPE, 2022-2032 ($MILLION)
- TABLE 63. SAUDI ARABIA HOME AUDIO COMPONENTS MARKET, BY DISTRIBUTION CHANNEL, 2022-2032 ($MILLION)
- TABLE 64. SOUTH AFRICA HOME AUDIO COMPONENTS MARKET, BY PRODUCT TYPE, 2022-2032 ($MILLION)
- TABLE 65. SOUTH AFRICA HOME AUDIO COMPONENTS MARKET, BY DISTRIBUTION CHANNEL, 2022-2032 ($MILLION)
- TABLE 66. REST OF MIDDLE EAST AND AFRICA HOME AUDIO COMPONENTS MARKET, BY PRODUCT TYPE, 2022-2032 ($MILLION)
- TABLE 67. REST OF MIDDLE EAST AND AFRICA HOME AUDIO COMPONENTS MARKET, BY DISTRIBUTION CHANNEL, 2022-2032 ($MILLION)
- TABLE 68. BOSE CORPORATION: KEY EXECUTIVES
- TABLE 69. BOSE CORPORATION: COMPANY SNAPSHOT
- TABLE 70. BOSE CORPORATION: PRODUCT SEGMENTS
- TABLE 71. BOSE CORPORATION: SERVICE SEGMENTS
- TABLE 72. BOSE CORPORATION: PRODUCT PORTFOLIO
- TABLE 73. BOSE CORPORATION: KEY STRATERGIES
- TABLE 74. SONY CORPORATION: KEY EXECUTIVES
- TABLE 75. SONY CORPORATION: COMPANY SNAPSHOT
- TABLE 76. SONY CORPORATION: PRODUCT SEGMENTS
- TABLE 77. SONY CORPORATION: SERVICE SEGMENTS
- TABLE 78. SONY CORPORATION: PRODUCT PORTFOLIO
- TABLE 79. SONY CORPORATION: KEY STRATERGIES
- TABLE 80. SAMSUNG ELECTRONICS CO., LTD.: KEY EXECUTIVES
- TABLE 81. SAMSUNG ELECTRONICS CO., LTD.: COMPANY SNAPSHOT
- TABLE 82. SAMSUNG ELECTRONICS CO., LTD.: PRODUCT SEGMENTS
- TABLE 83. SAMSUNG ELECTRONICS CO., LTD.: SERVICE SEGMENTS
- TABLE 84. SAMSUNG ELECTRONICS CO., LTD.: PRODUCT PORTFOLIO
- TABLE 85. SAMSUNG ELECTRONICS CO., LTD.: KEY STRATERGIES
- TABLE 86. LG ELECTRONICS INC.: KEY EXECUTIVES
- TABLE 87. LG ELECTRONICS INC.: COMPANY SNAPSHOT
- TABLE 88. LG ELECTRONICS INC.: PRODUCT SEGMENTS
- TABLE 89. LG ELECTRONICS INC.: SERVICE SEGMENTS
- TABLE 90. LG ELECTRONICS INC.: PRODUCT PORTFOLIO
- TABLE 91. LG ELECTRONICS INC.: KEY STRATERGIES
- TABLE 92. APPLE INC.: KEY EXECUTIVES
- TABLE 93. APPLE INC.: COMPANY SNAPSHOT
- TABLE 94. APPLE INC.: PRODUCT SEGMENTS
- TABLE 95. APPLE INC.: SERVICE SEGMENTS
- TABLE 96. APPLE INC.: PRODUCT PORTFOLIO
- TABLE 97. APPLE INC.: KEY STRATERGIES
- TABLE 98. PANASONIC CORPORATION: KEY EXECUTIVES
- TABLE 99. PANASONIC CORPORATION: COMPANY SNAPSHOT
- TABLE 100. PANASONIC CORPORATION: PRODUCT SEGMENTS
- TABLE 101. PANASONIC CORPORATION: SERVICE SEGMENTS
- TABLE 102. PANASONIC CORPORATION: PRODUCT PORTFOLIO
- TABLE 103. PANASONIC CORPORATION: KEY STRATERGIES
- TABLE 104. YAMAHA CORPORATION: KEY EXECUTIVES
- TABLE 105. YAMAHA CORPORATION: COMPANY SNAPSHOT
- TABLE 106. YAMAHA CORPORATION: PRODUCT SEGMENTS
- TABLE 107. YAMAHA CORPORATION: SERVICE SEGMENTS
- TABLE 108. YAMAHA CORPORATION: PRODUCT PORTFOLIO
- TABLE 109. YAMAHA CORPORATION: KEY STRATERGIES
- TABLE 110. SONOS, INC.: KEY EXECUTIVES
- TABLE 111. SONOS, INC.: COMPANY SNAPSHOT
- TABLE 112. SONOS, INC.: PRODUCT SEGMENTS
- TABLE 113. SONOS, INC.: SERVICE SEGMENTS
- TABLE 114. SONOS, INC.: PRODUCT PORTFOLIO
- TABLE 115. SONOS, INC.: KEY STRATERGIES
- TABLE 116. AMAZON.COM INC.: KEY EXECUTIVES
- TABLE 117. AMAZON.COM INC.: COMPANY SNAPSHOT
- TABLE 118. AMAZON.COM INC.: PRODUCT SEGMENTS
- TABLE 119. AMAZON.COM INC.: SERVICE SEGMENTS
- TABLE 120. AMAZON.COM INC.: PRODUCT PORTFOLIO
- TABLE 121. AMAZON.COM INC.: KEY STRATERGIES
- TABLE 122. GOOGLE LLC: KEY EXECUTIVES
- TABLE 123. GOOGLE LLC: COMPANY SNAPSHOT
- TABLE 124. GOOGLE LLC: PRODUCT SEGMENTS
- TABLE 125. GOOGLE LLC: SERVICE SEGMENTS
- TABLE 126. GOOGLE LLC: PRODUCT PORTFOLIO
- TABLE 127. GOOGLE LLC: KEY STRATERGIES
LIST OF FIGURES
- FIGURE 01. HOME AUDIO COMPONENTS MARKET, 2022-2032
- FIGURE 02. SEGMENTATION OF HOME AUDIO COMPONENTS MARKET,2022-2032
- FIGURE 03. TOP IMPACTING FACTORS IN HOME AUDIO COMPONENTS MARKET
- FIGURE 04. TOP INVESTMENT POCKETS IN HOME AUDIO COMPONENTS MARKET (2023-2032)
- FIGURE 05. BARGAINING POWER OF SUPPLIERS
- FIGURE 06. BARGAINING POWER OF BUYERS
- FIGURE 07. THREAT OF SUBSTITUTION
- FIGURE 08. THREAT OF SUBSTITUTION
- FIGURE 09. COMPETITIVE RIVALRY
- FIGURE 10. GLOBAL HOME AUDIO COMPONENTS MARKET:DRIVERS, RESTRAINTS AND OPPORTUNITIES
- FIGURE 11. HOME AUDIO COMPONENTS MARKET, BY PRODUCT TYPE, 2022 AND 2032(%)
- FIGURE 12. COMPARATIVE SHARE ANALYSIS OF HOME AUDIO COMPONENTS MARKET FOR SPEAKERS, BY COUNTRY 2022 AND 2032(%)
- FIGURE 13. COMPARATIVE SHARE ANALYSIS OF HOME AUDIO COMPONENTS MARKET FOR SOUNDBARS, BY COUNTRY 2022 AND 2032(%)
- FIGURE 14. COMPARATIVE SHARE ANALYSIS OF HOME AUDIO COMPONENTS MARKET FOR HOME THEATER SYSTEM, BY COUNTRY 2022 AND 2032(%)
- FIGURE 15. COMPARATIVE SHARE ANALYSIS OF HOME AUDIO COMPONENTS MARKET FOR AMPLIFIERS, BY COUNTRY 2022 AND 2032(%)
- FIGURE 16. COMPARATIVE SHARE ANALYSIS OF HOME AUDIO COMPONENTS MARKET FOR OTHERS, BY COUNTRY 2022 AND 2032(%)
- FIGURE 17. HOME AUDIO COMPONENTS MARKET, BY DISTRIBUTION CHANNEL, 2022 AND 2032(%)
- FIGURE 18. COMPARATIVE SHARE ANALYSIS OF HOME AUDIO COMPONENTS MARKET FOR ONLINE, BY COUNTRY 2022 AND 2032(%)
- FIGURE 19. COMPARATIVE SHARE ANALYSIS OF HOME AUDIO COMPONENTS MARKET FOR OFFLINE, BY COUNTRY 2022 AND 2032(%)
- FIGURE 20. HOME AUDIO COMPONENTS MARKET BY REGION, 2022 AND 2032(%)
- FIGURE 21. U.S. HOME AUDIO COMPONENTS MARKET, 2022-2032 ($MILLION)
- FIGURE 22. CANADA HOME AUDIO COMPONENTS MARKET, 2022-2032 ($MILLION)
- FIGURE 23. MEXICO HOME AUDIO COMPONENTS MARKET, 2022-2032 ($MILLION)
- FIGURE 24. UK HOME AUDIO COMPONENTS MARKET, 2022-2032 ($MILLION)
- FIGURE 25. GERMANY HOME AUDIO COMPONENTS MARKET, 2022-2032 ($MILLION)
- FIGURE 26. FRANCE HOME AUDIO COMPONENTS MARKET, 2022-2032 ($MILLION)
- FIGURE 27. ITALY HOME AUDIO COMPONENTS MARKET, 2022-2032 ($MILLION)
- FIGURE 28. REST OF EUROPE HOME AUDIO COMPONENTS MARKET, 2022-2032 ($MILLION)
- FIGURE 29. CHINA HOME AUDIO COMPONENTS MARKET, 2022-2032 ($MILLION)
- FIGURE 30. JAPAN HOME AUDIO COMPONENTS MARKET, 2022-2032 ($MILLION)
- FIGURE 31. INDIA HOME AUDIO COMPONENTS MARKET, 2022-2032 ($MILLION)
- FIGURE 32. AUSTRALIA HOME AUDIO COMPONENTS MARKET, 2022-2032 ($MILLION)
- FIGURE 33. SOUTH KOREA HOME AUDIO COMPONENTS MARKET, 2022-2032 ($MILLION)
- FIGURE 34. REST OF ASIA-PACIFIC HOME AUDIO COMPONENTS MARKET, 2022-2032 ($MILLION)
- FIGURE 35. BRAZIL HOME AUDIO COMPONENTS MARKET, 2022-2032 ($MILLION)
- FIGURE 36. ARGENTINA HOME AUDIO COMPONENTS MARKET, 2022-2032 ($MILLION)
- FIGURE 37. REST OF LATIN AMERICA HOME AUDIO COMPONENTS MARKET, 2022-2032 ($MILLION)
- FIGURE 38. UAE HOME AUDIO COMPONENTS MARKET, 2022-2032 ($MILLION)
- FIGURE 39. SAUDI ARABIA HOME AUDIO COMPONENTS MARKET, 2022-2032 ($MILLION)
- FIGURE 40. SOUTH AFRICA HOME AUDIO COMPONENTS MARKET, 2022-2032 ($MILLION)
- FIGURE 41. REST OF MIDDLE EAST AND AFRICA HOME AUDIO COMPONENTS MARKET, 2022-2032 ($MILLION)
- FIGURE 42. TOP WINNING STRATEGIES, BY YEAR
- FIGURE 43. TOP WINNING STRATEGIES, BY DEVELOPMENT
- FIGURE 44. TOP WINNING STRATEGIES, BY COMPANY
- FIGURE 45. PRODUCT MAPPING OF TOP 10 PLAYERS
- FIGURE 46. COMPETITIVE DASHBOARD
- FIGURE 47. COMPETITIVE HEATMAP: HOME AUDIO COMPONENTS MARKET
- FIGURE 48. TOP PLAYER POSITIONING, 2022

