
PUBLISHER: Allied Market Research | PRODUCT CODE: 1472374

PUBLISHER: Allied Market Research | PRODUCT CODE: 1472374
Microbial Incubators Market By Type (Capacity Below 200L, Capacity 200L-400L, Capacity Above 400L), By End User (Hospitals, Laboratories, Others): Global Opportunity Analysis and Industry Forecast, 2023-2032
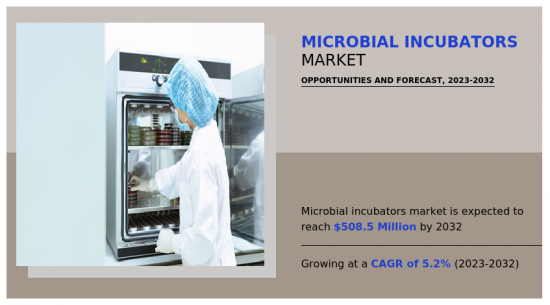
The global microbial incubators market is anticipated to reach $508.5 million by 2032, growing from $315.2 million in 2022 at a CAGR of 5.2 from 2023 to 2032.
A microbial incubator is a specialized piece of laboratory equipment that creates ideal conditions for the growth and proliferation of microorganisms such as bacteria, yeast, and fungi. These settings often include controlled temperature, humidity, and, in some cases, gas composition. Microbial incubators are vital equipment for microbiology, molecular biology, and other life sciences research that requires the culture of microorganisms.
Ongoing developments in incubator technologies, such as enhanced temperature control, humidity regulation, and programmable features, boost the efficiency and dependability of microbial incubators. This promotes the use of innovative models by research organizations and laboratories. The growing emphasis on biotechnology and life sciences research boosts the demand for microbial incubators. These incubators are vital for producing and researching microorganisms, which are used in a variety of scientific fields. The growing disciplines of cell culture and microbiology, particularly in the pharmaceutical and biopharmaceutical industries, drive the demand for improved microbial incubators. These industries rely on precise and controlled settings to develop microorganisms. All these factors are anticipated drive the microbial incubators market growth in the upcoming years.
Modern microbial incubators with advanced features can be quite expensive. Smaller research organizations or laboratories with limited budgets may find it difficult to embrace cutting-edge technologies due to the high initial expenditures. Alternative technologies, such as microfluidics and in-situ analytic systems, compete with conventional microbial incubators. Researchers may investigate various alternatives, particularly in specific applications, affecting the growth of the microbial incubator market. Laboratories in the life sciences and pharmaceutical industries are required to follow strict environmental laws. Meeting these compliance requirements can be difficult and serve as a constraint for some firms. All these factors are anticipated to restrain the market revenue growth during the forecast period.
The identification of new microbial species, as well as the exploration of unusual bioprospecting habitats, present prospects for the microbial incubators market. As researchers dive into uncharted ecosystems, the demand for specialized incubators is expected to grow. The use of 3D cell culture techniques in more realistic and physiologically relevant studies opens up prospects for microbial incubators with specific characteristics targeted to these applications. There is an increasing emphasis on sustainable laboratory techniques. Manufacturers of energy-efficient and ecologically friendly microbial incubators are expected to have a higher market appeal. Microbial incubators that link with laboratory information management systems (LIMS) and include automation elements for remote monitoring and control provide prospects for increased workflow efficiency and data management.
The key players profiled in this report include General Electric Company, Atom Medical Corporation, Panasonic, Thermofisher Inc., Natus Medical Incorporated, Phoenix Medical Systems, Dragerwerk AG, Cobams plc., Sartorius AG, Binderholz GmbH, and VWR Lab Products Pvt. Ltd. The market players are continuously striving to achieve a dominant position in this competitive market using strategies such as collaborations and acquisitions.
Key Benefits For Stakeholders
- This report provides a quantitative analysis of the market segments, current trends, estimations, and dynamics of the microbial incubators market analysis from 2022 to 2032 to identify the prevailing microbial incubators market opportunities.
- The market research is offered along with information related to key drivers, restraints, and opportunities.
- Porter's five forces analysis highlights the potency of buyers and suppliers to enable stakeholders make profit-oriented business decisions and strengthen their supplier-buyer network.
- In-depth analysis of the microbial incubators market segmentation assists to determine the prevailing market opportunities.
- Major countries in each region are mapped according to their revenue contribution to the global market.
- Market player positioning facilitates benchmarking and provides a clear understanding of the present position of the market players.
- The report includes the analysis of the regional as well as global microbial incubators market trends, key players, market segments, application areas, and market growth strategies.
Additional benefits you will get with this purchase are:
- Quarterly Update and* (only available with a corporate license, on listed price)
- 5 additional Company Profile of client Choice pre- or Post-purchase, as a free update.
- Free Upcoming Version on the Purchase of Five and Enterprise User License.
- 16 analyst hours of support* (post-purchase, if you find additional data requirements upon review of the report, you may receive support amounting to 16 analyst hours to solve questions, and post-sale queries)
- 15% Free Customization* (in case the scope or segment of the report does not match your requirements, 15% is equivalent to 3 working days of free work, applicable once)
- Free data Pack on the Five and Enterprise User License. (Excel version of the report)
- Free Updated report if the report is 6-12 months old or older.
- 24-hour priority response*
- Free Industry updates and white papers.
Possible Customization with this report (with additional cost and timeline, please talk to the sales executive to know more)
- Analysis of raw material in a product (by %)
- Manufacturing Capacity
- Product Benchmarking / Product specification and applications
- Go To Market Strategy
- New Product Development/ Product Matrix of Key Players
- Regulatory Guidelines
- Additional company profiles with specific to client's interest
- Brands Share Analysis
- Criss-cross segment analysis- market size and forecast
- Expanded list for Company Profiles
- Historic market data
- Key player details (including location, contact details, supplier/vendor network etc. in excel format)
- Product Consumption Analysis
- SWOT Analysis
Key Market Segments
By Type
- Capacity 200L-400L
- Capacity Above 400L
- Capacity Below 200L
By End User
- Hospitals
- Laboratories
- Others
By Region
- North America
- U.S.
- Canada
- Mexico
- Europe
- Germany
- UK
- France
- Spain
- Italy
- Rest of Europe
- Asia-Pacific
- China
- Japan
- India
- South Korea
- Australia
- Rest of Asia-Pacific
- LAMEA
- Brazil
- Saudi Arabia
- UAE
- South Africa
- Rest of LAMEA
Key Market Players:
- ThermoFisher Inc.
- Eppendorf Corporate
- PHC Corporation
- ESCO
- Binder
- sheldon manufacturing, inc.
- Labstac Ltd
- nuaire group
- Boekel Scientific
- Didac International
TABLE OF CONTENTS
CHAPTER 1: INTRODUCTION
- 1.1. Report description
- 1.2. Key market segments
- 1.3. Key benefits to the stakeholders
- 1.4. Research methodology
- 1.4.1. Primary research
- 1.4.2. Secondary research
- 1.4.3. Analyst tools and models
CHAPTER 2: EXECUTIVE SUMMARY
- 2.1. CXO perspective
CHAPTER 3: MARKET OVERVIEW
- 3.1. Market definition and scope
- 3.2. Key findings
- 3.2.1. Top impacting factors
- 3.2.2. Top investment pockets
- 3.3. Porter's five forces analysis
- 3.4. Market dynamics
- 3.4.1. Drivers
- 3.4.2. Restraints
- 3.4.3. Opportunities
- 3.5. Market Share Analysis
- 3.6. Value Chain Analysis
- 3.7. Regulatory Guidelines
- 3.8. Key Regulation Analysis
- 3.9. Patent Landscape
CHAPTER 4: MICROBIAL INCUBATORS MARKET, BY TYPE
- 4.1. Overview
- 4.1.1. Market size and forecast
- 4.2. Capacity Below 200L
- 4.2.1. Key market trends, growth factors and opportunities
- 4.2.2. Market size and forecast, by region
- 4.2.3. Market share analysis by country
- 4.3. Capacity 200L-400L
- 4.3.1. Key market trends, growth factors and opportunities
- 4.3.2. Market size and forecast, by region
- 4.3.3. Market share analysis by country
- 4.4. Capacity Above 400L
- 4.4.1. Key market trends, growth factors and opportunities
- 4.4.2. Market size and forecast, by region
- 4.4.3. Market share analysis by country
CHAPTER 5: MICROBIAL INCUBATORS MARKET, BY END USER
- 5.1. Overview
- 5.1.1. Market size and forecast
- 5.2. Hospitals
- 5.2.1. Key market trends, growth factors and opportunities
- 5.2.2. Market size and forecast, by region
- 5.2.3. Market share analysis by country
- 5.3. Laboratories
- 5.3.1. Key market trends, growth factors and opportunities
- 5.3.2. Market size and forecast, by region
- 5.3.3. Market share analysis by country
- 5.4. Others
- 5.4.1. Key market trends, growth factors and opportunities
- 5.4.2. Market size and forecast, by region
- 5.4.3. Market share analysis by country
CHAPTER 6: MICROBIAL INCUBATORS MARKET, BY REGION
- 6.1. Overview
- 6.1.1. Market size and forecast By Region
- 6.2. North America
- 6.2.1. Key market trends, growth factors and opportunities
- 6.2.2. Market size and forecast, by Type
- 6.2.3. Market size and forecast, by End User
- 6.2.4. Market size and forecast, by country
- 6.2.4.1. U.S.
- 6.2.4.1.1. Market size and forecast, by Type
- 6.2.4.1.2. Market size and forecast, by End User
- 6.2.4.2. Canada
- 6.2.4.2.1. Market size and forecast, by Type
- 6.2.4.2.2. Market size and forecast, by End User
- 6.2.4.3. Mexico
- 6.2.4.3.1. Market size and forecast, by Type
- 6.2.4.3.2. Market size and forecast, by End User
- 6.3. Europe
- 6.3.1. Key market trends, growth factors and opportunities
- 6.3.2. Market size and forecast, by Type
- 6.3.3. Market size and forecast, by End User
- 6.3.4. Market size and forecast, by country
- 6.3.4.1. Germany
- 6.3.4.1.1. Market size and forecast, by Type
- 6.3.4.1.2. Market size and forecast, by End User
- 6.3.4.2. UK
- 6.3.4.2.1. Market size and forecast, by Type
- 6.3.4.2.2. Market size and forecast, by End User
- 6.3.4.3. France
- 6.3.4.3.1. Market size and forecast, by Type
- 6.3.4.3.2. Market size and forecast, by End User
- 6.3.4.4. Spain
- 6.3.4.4.1. Market size and forecast, by Type
- 6.3.4.4.2. Market size and forecast, by End User
- 6.3.4.5. Italy
- 6.3.4.5.1. Market size and forecast, by Type
- 6.3.4.5.2. Market size and forecast, by End User
- 6.3.4.6. Rest of Europe
- 6.3.4.6.1. Market size and forecast, by Type
- 6.3.4.6.2. Market size and forecast, by End User
- 6.4. Asia-Pacific
- 6.4.1. Key market trends, growth factors and opportunities
- 6.4.2. Market size and forecast, by Type
- 6.4.3. Market size and forecast, by End User
- 6.4.4. Market size and forecast, by country
- 6.4.4.1. China
- 6.4.4.1.1. Market size and forecast, by Type
- 6.4.4.1.2. Market size and forecast, by End User
- 6.4.4.2. Japan
- 6.4.4.2.1. Market size and forecast, by Type
- 6.4.4.2.2. Market size and forecast, by End User
- 6.4.4.3. India
- 6.4.4.3.1. Market size and forecast, by Type
- 6.4.4.3.2. Market size and forecast, by End User
- 6.4.4.4. South Korea
- 6.4.4.4.1. Market size and forecast, by Type
- 6.4.4.4.2. Market size and forecast, by End User
- 6.4.4.5. Australia
- 6.4.4.5.1. Market size and forecast, by Type
- 6.4.4.5.2. Market size and forecast, by End User
- 6.4.4.6. Rest of Asia-Pacific
- 6.4.4.6.1. Market size and forecast, by Type
- 6.4.4.6.2. Market size and forecast, by End User
- 6.5. LAMEA
- 6.5.1. Key market trends, growth factors and opportunities
- 6.5.2. Market size and forecast, by Type
- 6.5.3. Market size and forecast, by End User
- 6.5.4. Market size and forecast, by country
- 6.5.4.1. Brazil
- 6.5.4.1.1. Market size and forecast, by Type
- 6.5.4.1.2. Market size and forecast, by End User
- 6.5.4.2. Saudi Arabia
- 6.5.4.2.1. Market size and forecast, by Type
- 6.5.4.2.2. Market size and forecast, by End User
- 6.5.4.3. UAE
- 6.5.4.3.1. Market size and forecast, by Type
- 6.5.4.3.2. Market size and forecast, by End User
- 6.5.4.4. South Africa
- 6.5.4.4.1. Market size and forecast, by Type
- 6.5.4.4.2. Market size and forecast, by End User
- 6.5.4.5. Rest of LAMEA
- 6.5.4.5.1. Market size and forecast, by Type
- 6.5.4.5.2. Market size and forecast, by End User
CHAPTER 7: COMPETITIVE LANDSCAPE
- 7.1. Introduction
- 7.2. Top winning strategies
- 7.3. Product mapping of top 10 player
- 7.4. Competitive dashboard
- 7.5. Competitive heatmap
- 7.6. Top player positioning, 2022
CHAPTER 8: COMPANY PROFILES
- 8.1. ThermoFisher Inc.
- 8.1.1. Company overview
- 8.1.2. Key executives
- 8.1.3. Company snapshot
- 8.1.4. Operating business segments
- 8.1.5. Product portfolio
- 8.1.6. Business performance
- 8.1.7. Key strategic moves and developments
- 8.2. Eppendorf Corporate
- 8.2.1. Company overview
- 8.2.2. Key executives
- 8.2.3. Company snapshot
- 8.2.4. Operating business segments
- 8.2.5. Product portfolio
- 8.2.6. Business performance
- 8.2.7. Key strategic moves and developments
- 8.3. PHC Corporation
- 8.3.1. Company overview
- 8.3.2. Key executives
- 8.3.3. Company snapshot
- 8.3.4. Operating business segments
- 8.3.5. Product portfolio
- 8.3.6. Business performance
- 8.3.7. Key strategic moves and developments
- 8.4. ESCO
- 8.4.1. Company overview
- 8.4.2. Key executives
- 8.4.3. Company snapshot
- 8.4.4. Operating business segments
- 8.4.5. Product portfolio
- 8.4.6. Business performance
- 8.4.7. Key strategic moves and developments
- 8.5. Binder
- 8.5.1. Company overview
- 8.5.2. Key executives
- 8.5.3. Company snapshot
- 8.5.4. Operating business segments
- 8.5.5. Product portfolio
- 8.5.6. Business performance
- 8.5.7. Key strategic moves and developments
- 8.6. sheldon manufacturing, inc.
- 8.6.1. Company overview
- 8.6.2. Key executives
- 8.6.3. Company snapshot
- 8.6.4. Operating business segments
- 8.6.5. Product portfolio
- 8.6.6. Business performance
- 8.6.7. Key strategic moves and developments
- 8.7. Labstac Ltd
- 8.7.1. Company overview
- 8.7.2. Key executives
- 8.7.3. Company snapshot
- 8.7.4. Operating business segments
- 8.7.5. Product portfolio
- 8.7.6. Business performance
- 8.7.7. Key strategic moves and developments
- 8.8. nuaire group
- 8.8.1. Company overview
- 8.8.2. Key executives
- 8.8.3. Company snapshot
- 8.8.4. Operating business segments
- 8.8.5. Product portfolio
- 8.8.6. Business performance
- 8.8.7. Key strategic moves and developments
- 8.9. Boekel Scientific
- 8.9.1. Company overview
- 8.9.2. Key executives
- 8.9.3. Company snapshot
- 8.9.4. Operating business segments
- 8.9.5. Product portfolio
- 8.9.6. Business performance
- 8.9.7. Key strategic moves and developments
- 8.10. Didac International
- 8.10.1. Company overview
- 8.10.2. Key executives
- 8.10.3. Company snapshot
- 8.10.4. Operating business segments
- 8.10.5. Product portfolio
- 8.10.6. Business performance
- 8.10.7. Key strategic moves and developments
LIST OF TABLES
- TABLE 01. GLOBAL MICROBIAL INCUBATORS MARKET, BY TYPE, 2022-2032 ($MILLION)
- TABLE 02. MICROBIAL INCUBATORS MARKET FOR CAPACITY BELOW 200L, BY REGION, 2022-2032 ($MILLION)
- TABLE 03. MICROBIAL INCUBATORS MARKET FOR CAPACITY 200L-400L, BY REGION, 2022-2032 ($MILLION)
- TABLE 04. MICROBIAL INCUBATORS MARKET FOR CAPACITY ABOVE 400L, BY REGION, 2022-2032 ($MILLION)
- TABLE 05. GLOBAL MICROBIAL INCUBATORS MARKET, BY END USER, 2022-2032 ($MILLION)
- TABLE 06. MICROBIAL INCUBATORS MARKET FOR HOSPITALS, BY REGION, 2022-2032 ($MILLION)
- TABLE 07. MICROBIAL INCUBATORS MARKET FOR LABORATORIES, BY REGION, 2022-2032 ($MILLION)
- TABLE 08. MICROBIAL INCUBATORS MARKET FOR OTHERS, BY REGION, 2022-2032 ($MILLION)
- TABLE 09. MICROBIAL INCUBATORS MARKET, BY REGION, 2022-2032 ($MILLION)
- TABLE 10. NORTH AMERICA MICROBIAL INCUBATORS MARKET, BY TYPE, 2022-2032 ($MILLION)
- TABLE 11. NORTH AMERICA MICROBIAL INCUBATORS MARKET, BY END USER, 2022-2032 ($MILLION)
- TABLE 12. NORTH AMERICA MICROBIAL INCUBATORS MARKET, BY COUNTRY, 2022-2032 ($MILLION)
- TABLE 13. U.S. MICROBIAL INCUBATORS MARKET, BY TYPE, 2022-2032 ($MILLION)
- TABLE 14. U.S. MICROBIAL INCUBATORS MARKET, BY END USER, 2022-2032 ($MILLION)
- TABLE 15. CANADA MICROBIAL INCUBATORS MARKET, BY TYPE, 2022-2032 ($MILLION)
- TABLE 16. CANADA MICROBIAL INCUBATORS MARKET, BY END USER, 2022-2032 ($MILLION)
- TABLE 17. MEXICO MICROBIAL INCUBATORS MARKET, BY TYPE, 2022-2032 ($MILLION)
- TABLE 18. MEXICO MICROBIAL INCUBATORS MARKET, BY END USER, 2022-2032 ($MILLION)
- TABLE 19. EUROPE MICROBIAL INCUBATORS MARKET, BY TYPE, 2022-2032 ($MILLION)
- TABLE 20. EUROPE MICROBIAL INCUBATORS MARKET, BY END USER, 2022-2032 ($MILLION)
- TABLE 21. EUROPE MICROBIAL INCUBATORS MARKET, BY COUNTRY, 2022-2032 ($MILLION)
- TABLE 22. GERMANY MICROBIAL INCUBATORS MARKET, BY TYPE, 2022-2032 ($MILLION)
- TABLE 23. GERMANY MICROBIAL INCUBATORS MARKET, BY END USER, 2022-2032 ($MILLION)
- TABLE 24. UK MICROBIAL INCUBATORS MARKET, BY TYPE, 2022-2032 ($MILLION)
- TABLE 25. UK MICROBIAL INCUBATORS MARKET, BY END USER, 2022-2032 ($MILLION)
- TABLE 26. FRANCE MICROBIAL INCUBATORS MARKET, BY TYPE, 2022-2032 ($MILLION)
- TABLE 27. FRANCE MICROBIAL INCUBATORS MARKET, BY END USER, 2022-2032 ($MILLION)
- TABLE 28. SPAIN MICROBIAL INCUBATORS MARKET, BY TYPE, 2022-2032 ($MILLION)
- TABLE 29. SPAIN MICROBIAL INCUBATORS MARKET, BY END USER, 2022-2032 ($MILLION)
- TABLE 30. ITALY MICROBIAL INCUBATORS MARKET, BY TYPE, 2022-2032 ($MILLION)
- TABLE 31. ITALY MICROBIAL INCUBATORS MARKET, BY END USER, 2022-2032 ($MILLION)
- TABLE 32. REST OF EUROPE MICROBIAL INCUBATORS MARKET, BY TYPE, 2022-2032 ($MILLION)
- TABLE 33. REST OF EUROPE MICROBIAL INCUBATORS MARKET, BY END USER, 2022-2032 ($MILLION)
- TABLE 34. ASIA-PACIFIC MICROBIAL INCUBATORS MARKET, BY TYPE, 2022-2032 ($MILLION)
- TABLE 35. ASIA-PACIFIC MICROBIAL INCUBATORS MARKET, BY END USER, 2022-2032 ($MILLION)
- TABLE 36. ASIA-PACIFIC MICROBIAL INCUBATORS MARKET, BY COUNTRY, 2022-2032 ($MILLION)
- TABLE 37. CHINA MICROBIAL INCUBATORS MARKET, BY TYPE, 2022-2032 ($MILLION)
- TABLE 38. CHINA MICROBIAL INCUBATORS MARKET, BY END USER, 2022-2032 ($MILLION)
- TABLE 39. JAPAN MICROBIAL INCUBATORS MARKET, BY TYPE, 2022-2032 ($MILLION)
- TABLE 40. JAPAN MICROBIAL INCUBATORS MARKET, BY END USER, 2022-2032 ($MILLION)
- TABLE 41. INDIA MICROBIAL INCUBATORS MARKET, BY TYPE, 2022-2032 ($MILLION)
- TABLE 42. INDIA MICROBIAL INCUBATORS MARKET, BY END USER, 2022-2032 ($MILLION)
- TABLE 43. SOUTH KOREA MICROBIAL INCUBATORS MARKET, BY TYPE, 2022-2032 ($MILLION)
- TABLE 44. SOUTH KOREA MICROBIAL INCUBATORS MARKET, BY END USER, 2022-2032 ($MILLION)
- TABLE 45. AUSTRALIA MICROBIAL INCUBATORS MARKET, BY TYPE, 2022-2032 ($MILLION)
- TABLE 46. AUSTRALIA MICROBIAL INCUBATORS MARKET, BY END USER, 2022-2032 ($MILLION)
- TABLE 47. REST OF ASIA-PACIFIC MICROBIAL INCUBATORS MARKET, BY TYPE, 2022-2032 ($MILLION)
- TABLE 48. REST OF ASIA-PACIFIC MICROBIAL INCUBATORS MARKET, BY END USER, 2022-2032 ($MILLION)
- TABLE 49. LAMEA MICROBIAL INCUBATORS MARKET, BY TYPE, 2022-2032 ($MILLION)
- TABLE 50. LAMEA MICROBIAL INCUBATORS MARKET, BY END USER, 2022-2032 ($MILLION)
- TABLE 51. LAMEA MICROBIAL INCUBATORS MARKET, BY COUNTRY, 2022-2032 ($MILLION)
- TABLE 52. BRAZIL MICROBIAL INCUBATORS MARKET, BY TYPE, 2022-2032 ($MILLION)
- TABLE 53. BRAZIL MICROBIAL INCUBATORS MARKET, BY END USER, 2022-2032 ($MILLION)
- TABLE 54. SAUDI ARABIA MICROBIAL INCUBATORS MARKET, BY TYPE, 2022-2032 ($MILLION)
- TABLE 55. SAUDI ARABIA MICROBIAL INCUBATORS MARKET, BY END USER, 2022-2032 ($MILLION)
- TABLE 56. UAE MICROBIAL INCUBATORS MARKET, BY TYPE, 2022-2032 ($MILLION)
- TABLE 57. UAE MICROBIAL INCUBATORS MARKET, BY END USER, 2022-2032 ($MILLION)
- TABLE 58. SOUTH AFRICA MICROBIAL INCUBATORS MARKET, BY TYPE, 2022-2032 ($MILLION)
- TABLE 59. SOUTH AFRICA MICROBIAL INCUBATORS MARKET, BY END USER, 2022-2032 ($MILLION)
- TABLE 60. REST OF LAMEA MICROBIAL INCUBATORS MARKET, BY TYPE, 2022-2032 ($MILLION)
- TABLE 61. REST OF LAMEA MICROBIAL INCUBATORS MARKET, BY END USER, 2022-2032 ($MILLION)
- TABLE 62. THERMOFISHER INC.: KEY EXECUTIVES
- TABLE 63. THERMOFISHER INC.: COMPANY SNAPSHOT
- TABLE 64. THERMOFISHER INC.: PRODUCT SEGMENTS
- TABLE 65. THERMOFISHER INC.: SERVICE SEGMENTS
- TABLE 66. THERMOFISHER INC.: PRODUCT PORTFOLIO
- TABLE 67. THERMOFISHER INC.: KEY STRATERGIES
- TABLE 68. EPPENDORF CORPORATE: KEY EXECUTIVES
- TABLE 69. EPPENDORF CORPORATE: COMPANY SNAPSHOT
- TABLE 70. EPPENDORF CORPORATE: PRODUCT SEGMENTS
- TABLE 71. EPPENDORF CORPORATE: SERVICE SEGMENTS
- TABLE 72. EPPENDORF CORPORATE: PRODUCT PORTFOLIO
- TABLE 73. EPPENDORF CORPORATE: KEY STRATERGIES
- TABLE 74. PHC CORPORATION: KEY EXECUTIVES
- TABLE 75. PHC CORPORATION: COMPANY SNAPSHOT
- TABLE 76. PHC CORPORATION: PRODUCT SEGMENTS
- TABLE 77. PHC CORPORATION: SERVICE SEGMENTS
- TABLE 78. PHC CORPORATION: PRODUCT PORTFOLIO
- TABLE 79. PHC CORPORATION: KEY STRATERGIES
- TABLE 80. ESCO: KEY EXECUTIVES
- TABLE 81. ESCO: COMPANY SNAPSHOT
- TABLE 82. ESCO: PRODUCT SEGMENTS
- TABLE 83. ESCO: SERVICE SEGMENTS
- TABLE 84. ESCO: PRODUCT PORTFOLIO
- TABLE 85. ESCO: KEY STRATERGIES
- TABLE 86. BINDER: KEY EXECUTIVES
- TABLE 87. BINDER: COMPANY SNAPSHOT
- TABLE 88. BINDER: PRODUCT SEGMENTS
- TABLE 89. BINDER: SERVICE SEGMENTS
- TABLE 90. BINDER: PRODUCT PORTFOLIO
- TABLE 91. BINDER: KEY STRATERGIES
- TABLE 92. SHELDON MANUFACTURING, INC.: KEY EXECUTIVES
- TABLE 93. SHELDON MANUFACTURING, INC.: COMPANY SNAPSHOT
- TABLE 94. SHELDON MANUFACTURING, INC.: PRODUCT SEGMENTS
- TABLE 95. SHELDON MANUFACTURING, INC.: SERVICE SEGMENTS
- TABLE 96. SHELDON MANUFACTURING, INC.: PRODUCT PORTFOLIO
- TABLE 97. SHELDON MANUFACTURING, INC.: KEY STRATERGIES
- TABLE 98. LABSTAC LTD: KEY EXECUTIVES
- TABLE 99. LABSTAC LTD: COMPANY SNAPSHOT
- TABLE 100. LABSTAC LTD: PRODUCT SEGMENTS
- TABLE 101. LABSTAC LTD: SERVICE SEGMENTS
- TABLE 102. LABSTAC LTD: PRODUCT PORTFOLIO
- TABLE 103. LABSTAC LTD: KEY STRATERGIES
- TABLE 104. NUAIRE GROUP: KEY EXECUTIVES
- TABLE 105. NUAIRE GROUP: COMPANY SNAPSHOT
- TABLE 106. NUAIRE GROUP: PRODUCT SEGMENTS
- TABLE 107. NUAIRE GROUP: SERVICE SEGMENTS
- TABLE 108. NUAIRE GROUP: PRODUCT PORTFOLIO
- TABLE 109. NUAIRE GROUP: KEY STRATERGIES
- TABLE 110. BOEKEL SCIENTIFIC: KEY EXECUTIVES
- TABLE 111. BOEKEL SCIENTIFIC: COMPANY SNAPSHOT
- TABLE 112. BOEKEL SCIENTIFIC: PRODUCT SEGMENTS
- TABLE 113. BOEKEL SCIENTIFIC: SERVICE SEGMENTS
- TABLE 114. BOEKEL SCIENTIFIC: PRODUCT PORTFOLIO
- TABLE 115. BOEKEL SCIENTIFIC: KEY STRATERGIES
- TABLE 116. DIDAC INTERNATIONAL: KEY EXECUTIVES
- TABLE 117. DIDAC INTERNATIONAL: COMPANY SNAPSHOT
- TABLE 118. DIDAC INTERNATIONAL: PRODUCT SEGMENTS
- TABLE 119. DIDAC INTERNATIONAL: SERVICE SEGMENTS
- TABLE 120. DIDAC INTERNATIONAL: PRODUCT PORTFOLIO
- TABLE 121. DIDAC INTERNATIONAL: KEY STRATERGIES
LIST OF FIGURES
- FIGURE 01. MICROBIAL INCUBATORS MARKET, 2022-2032
- FIGURE 02. SEGMENTATION OF MICROBIAL INCUBATORS MARKET,2022-2032
- FIGURE 03. TOP IMPACTING FACTORS IN MICROBIAL INCUBATORS MARKET
- FIGURE 04. TOP INVESTMENT POCKETS IN MICROBIAL INCUBATORS MARKET (2023-2032)
- FIGURE 05. BARGAINING POWER OF SUPPLIERS
- FIGURE 06. BARGAINING POWER OF BUYERS
- FIGURE 07. THREAT OF SUBSTITUTION
- FIGURE 08. THREAT OF SUBSTITUTION
- FIGURE 09. COMPETITIVE RIVALRY
- FIGURE 10. GLOBAL MICROBIAL INCUBATORS MARKET:DRIVERS, RESTRAINTS AND OPPORTUNITIES
- FIGURE 11. IMPACT OF KEY REGULATION: MICROBIAL INCUBATORS MARKET
- FIGURE 12. PATENT ANALYSIS BY COMPANY
- FIGURE 13. PATENT ANALYSIS BY COUNTRY
- FIGURE 14. MICROBIAL INCUBATORS MARKET, BY TYPE, 2022 AND 2032(%)
- FIGURE 15. COMPARATIVE SHARE ANALYSIS OF MICROBIAL INCUBATORS MARKET FOR CAPACITY BELOW 200L, BY COUNTRY 2022 AND 2032(%)
- FIGURE 16. COMPARATIVE SHARE ANALYSIS OF MICROBIAL INCUBATORS MARKET FOR CAPACITY 200L-400L, BY COUNTRY 2022 AND 2032(%)
- FIGURE 17. COMPARATIVE SHARE ANALYSIS OF MICROBIAL INCUBATORS MARKET FOR CAPACITY ABOVE 400L, BY COUNTRY 2022 AND 2032(%)
- FIGURE 18. MICROBIAL INCUBATORS MARKET, BY END USER, 2022 AND 2032(%)
- FIGURE 19. COMPARATIVE SHARE ANALYSIS OF MICROBIAL INCUBATORS MARKET FOR HOSPITALS, BY COUNTRY 2022 AND 2032(%)
- FIGURE 20. COMPARATIVE SHARE ANALYSIS OF MICROBIAL INCUBATORS MARKET FOR LABORATORIES, BY COUNTRY 2022 AND 2032(%)
- FIGURE 21. COMPARATIVE SHARE ANALYSIS OF MICROBIAL INCUBATORS MARKET FOR OTHERS, BY COUNTRY 2022 AND 2032(%)
- FIGURE 22. MICROBIAL INCUBATORS MARKET BY REGION, 2022 AND 2032(%)
- FIGURE 23. U.S. MICROBIAL INCUBATORS MARKET, 2022-2032 ($MILLION)
- FIGURE 24. CANADA MICROBIAL INCUBATORS MARKET, 2022-2032 ($MILLION)
- FIGURE 25. MEXICO MICROBIAL INCUBATORS MARKET, 2022-2032 ($MILLION)
- FIGURE 26. GERMANY MICROBIAL INCUBATORS MARKET, 2022-2032 ($MILLION)
- FIGURE 27. UK MICROBIAL INCUBATORS MARKET, 2022-2032 ($MILLION)
- FIGURE 28. FRANCE MICROBIAL INCUBATORS MARKET, 2022-2032 ($MILLION)
- FIGURE 29. SPAIN MICROBIAL INCUBATORS MARKET, 2022-2032 ($MILLION)
- FIGURE 30. ITALY MICROBIAL INCUBATORS MARKET, 2022-2032 ($MILLION)
- FIGURE 31. REST OF EUROPE MICROBIAL INCUBATORS MARKET, 2022-2032 ($MILLION)
- FIGURE 32. CHINA MICROBIAL INCUBATORS MARKET, 2022-2032 ($MILLION)
- FIGURE 33. JAPAN MICROBIAL INCUBATORS MARKET, 2022-2032 ($MILLION)
- FIGURE 34. INDIA MICROBIAL INCUBATORS MARKET, 2022-2032 ($MILLION)
- FIGURE 35. SOUTH KOREA MICROBIAL INCUBATORS MARKET, 2022-2032 ($MILLION)
- FIGURE 36. AUSTRALIA MICROBIAL INCUBATORS MARKET, 2022-2032 ($MILLION)
- FIGURE 37. REST OF ASIA-PACIFIC MICROBIAL INCUBATORS MARKET, 2022-2032 ($MILLION)
- FIGURE 38. BRAZIL MICROBIAL INCUBATORS MARKET, 2022-2032 ($MILLION)
- FIGURE 39. SAUDI ARABIA MICROBIAL INCUBATORS MARKET, 2022-2032 ($MILLION)
- FIGURE 40. UAE MICROBIAL INCUBATORS MARKET, 2022-2032 ($MILLION)
- FIGURE 41. SOUTH AFRICA MICROBIAL INCUBATORS MARKET, 2022-2032 ($MILLION)
- FIGURE 42. REST OF LAMEA MICROBIAL INCUBATORS MARKET, 2022-2032 ($MILLION)
- FIGURE 43. TOP WINNING STRATEGIES, BY YEAR
- FIGURE 44. TOP WINNING STRATEGIES, BY DEVELOPMENT
- FIGURE 45. TOP WINNING STRATEGIES, BY COMPANY
- FIGURE 46. PRODUCT MAPPING OF TOP 10 PLAYERS
- FIGURE 47. COMPETITIVE DASHBOARD
- FIGURE 48. COMPETITIVE HEATMAP: MICROBIAL INCUBATORS MARKET
- FIGURE 49. TOP PLAYER POSITIONING, 2022

