
PUBLISHER: Allied Market Research | PRODUCT CODE: 1472388

PUBLISHER: Allied Market Research | PRODUCT CODE: 1472388
Hybrid Boats Market By Type, By Product Type, By Length, By Application : Global Opportunity Analysis and Industry Forecast, 2023-2032
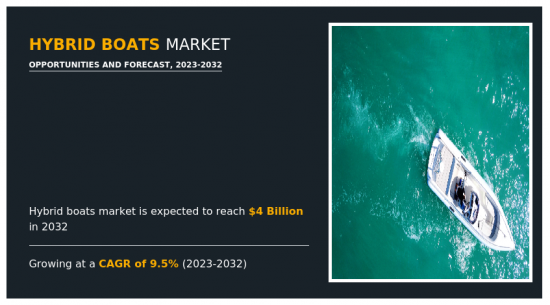
The global hybrid boats market is anticipated to reach $3,973.9 million by 2032, growing from $1,606.5 million in 2022 at a CAGR of 9.5% from 2023 to 2032. Hybrid boats, encompassing both electric and hybrid propulsion systems, are increasingly gaining traction in the marine industry. These vessels offer a blend of traditional combustion engines with electric motors, presenting a promising solution for environmentally-conscious boaters and addressing concerns regarding carbon emissions and noise pollution. Hybrid boats can be categorized into two main types: serial and parallel hybrids. Serial hybrids feature an electric motor as the prime mover, powered by a substantial battery bank, with a generator solely dedicated to charging the batteries. On the other hand, parallel hybrids integrate both combustion engines and electric motors to drive the prop shaft(s), offering flexibility in power sources and seamless transitions between combustion and electric modes.
The growing emphasis on sustainability and environmental conservation by reducing harmful carbon emissions is prompting boaters to seek greener alternatives. The hybrid boats industry align with this trend by reducing carbon emissions and noise pollution, offering an eco-friendlier boating experience. Secondly, advancements in technology and infrastructure are facilitating the integration of hybrid propulsion systems in boats. Improved battery technology, efficient electric motors, and the development of fast-charging infrastructure are enhancing the performance and range of hybrid boats, making them more attractive to consumers. In addition, regulatory initiatives and government incentives aimed at reducing emissions are encouraging the adoption of hybrid boats. Countries like the UK, for instance, have set ambitious targets to transition to electric and hybrid boats by 2050, further driving demand for these environmentally friendly vessels. Also, hybrid boats offer smoother and quieter operation, enhanced comfort, and the potential for cost savings over the long term. As consumers become more aware regarding these advantages, the demand for hybrid boats is expected to continue rising.
Hybrid boats face several limitations that may hinder their widespread adoption and sales. One significant limitation is the upfront cost associated with hybrid boat technology. Hybrid propulsion systems and advanced battery technology tend to be more expensive than traditional combustion engines, making hybrid boats a considerable investment for consumers. In addition, the complexity of hybrid propulsion systems can pose challenges in terms of maintenance and repair. Hybrid boats require specialized knowledge and expertise for servicing, which may limit the availability of qualified technicians and increase maintenance costs. Moreover, the integration of multiple power sources and components adds complexity to the boat's operation, potentially leading to reliability issues or performance discrepancies. These factors are anticipated to hinder the hybrid boats market growth in the upcoming years.
The compatibility of hybrid boats and efficiency improvements are the major factors anticipated to boost the hybrid boats market expansion during the forecast period. For instance, hybrid propulsion systems can be adapted for various types of boats, including leisure cruisers, yachts, fishing vessels, ferries, and patrol boats. This versatility allows manufacturers to cater to a wide range of customer needs and preferences, tapping into diverse market segments. Also, hybrid boats offer improved fuel efficiency and reduced operating costs compared to traditional diesel-powered vessels. By integrating electric propulsion with diesel engines, hybrid boats can optimize power usage, resulting in lower fuel consumption and longer cruising ranges. In addition, companies investing in hybrid boat technology are projected to lead the way in creating more efficient and powerful propulsion systems, driving progress in the marine industry. Furthermore, the collaboration between boat manufacturers, engine suppliers, and technology firms is anticipated to drive innovation in hybrid boat development. Partnerships can lead to the creation of integrated propulsion systems, advanced battery technology, and smart monitoring solutions, enhancing the performance and capabilities of hybrid boats.
The key players profiled in this report include Greenline Yachts, Torqeedo GmbH, aquawatt Green Marine Technologies, Sunreef Yachts Eco, BAVARIA YACHTS, Nautique Boat Company, Inc., RAND Boats, Elco Motor Yachts, X Shore, and DOMANI YACHTS. The market players are continuously striving to achieve a dominant position in this competitive market using strategies such as business expansion, partnership, new product, and acquisition.
Key Benefits For Stakeholders
- This report provides a quantitative analysis of the market segments, current trends, estimations, and dynamics of the hybrid boats market analysis from 2022 to 2032 to identify the prevailing hybrid boats market opportunities.
- The market research is offered along with information related to key drivers, restraints, and opportunities.
- Porter's five forces analysis highlights the potency of buyers and suppliers to enable stakeholders make profit-oriented business decisions and strengthen their supplier-buyer network.
- In-depth analysis of the hybrid boats market segmentation assists to determine the prevailing market opportunities.
- Major countries in each region are mapped according to their revenue contribution to the global market.
- Market player positioning facilitates benchmarking and provides a clear understanding of the present position of the market players.
- The report includes the analysis of the regional as well as global hybrid boats market trends, key players, market segments, application areas, and market growth strategies.
Additional benefits you will get with this purchase are:
- Quarterly Update and* (only available with a corporate license, on listed price)
- 5 additional Company Profile of client Choice pre- or Post-purchase, as a free update.
- Free Upcoming Version on the Purchase of Five and Enterprise User License.
- 16 analyst hours of support* (post-purchase, if you find additional data requirements upon review of the report, you may receive support amounting to 16 analyst hours to solve questions, and post-sale queries)
- 15% Free Customization* (in case the scope or segment of the report does not match your requirements, 15% is equivalent to 3 working days of free work, applicable once)
- Free data Pack on the Five and Enterprise User License. (Excel version of the report)
- Free Updated report if the report is 6-12 months old or older.
- 24-hour priority response*
- Free Industry updates and white papers.
Possible Customization with this report (with additional cost and timeline, please talk to the sales executive to know more)
- Consumer Buying Behavior Analysis
- End user preferences and pain points
- Investment Opportunities
- Upcoming/New Entrant by Regions
- Technology Trend Analysis
- Market share analysis of players by products/segments
- New Product Development/ Product Matrix of Key Players
- Pain Point Analysis
- Regulatory Guidelines
- Strategic Recommendations
- Additional company profiles with specific to client's interest
- Additional country or region analysis- market size and forecast
- Brands Share Analysis
- Criss-cross segment analysis- market size and forecast
- Expanded list for Company Profiles
- Historic market data
- Key player details (including location, contact details, supplier/vendor network etc. in excel format)
- List of customers/consumers/raw material suppliers- value chain analysis
- Market share analysis of players at global/region/country level
- SWOT Analysis
Key Market Segments
By Type
- Power Boats
- Sail Boats
By Product Type
- Parallel Hybrid Boats
- Serial Hybrid Boats
- Regenerative Hybrid Boats
By Length
- Less Than 26 Feet
- 26 to 35 Feet
- 36 to 45 Feet
- 46 to 55 Feet
- 56 to 79 Feet
- Greater Than 80 Feet
By Application
- Boating
- Fishing
- Watersports
- Others
By Region
- North America
- U.S.
- Canada
- Mexico
- Europe
- Finland
- Norway
- Sweden
- UK
- Italy
- Rest of Europe
- Asia-Pacific
- China
- Japan
- India
- New Zealand
- Australia
- Rest of Asia-Pacific
- LAMEA
- Brazil
- Saudi Arabia
- United Arab Emirates
- South Africa
- Rest of LAMEA
Key Market Players:
- Greenline Yachts
- Torqeedo GmbH
- aquawatt Green Marine Technologies
- Sunreef Yachts Eco
- BAVARIA YACHTS
- Nautique Boat Company, Inc.
- RAND Boats
- Elco Motor Yachts
- X Shore
- DOMANI YACHTS
TABLE OF CONTENTS
CHAPTER 1: INTRODUCTION
- 1.1. Report description
- 1.2. Key market segments
- 1.3. Key benefits to the stakeholders
- 1.4. Research methodology
- 1.4.1. Primary research
- 1.4.2. Secondary research
- 1.4.3. Analyst tools and models
CHAPTER 2: EXECUTIVE SUMMARY
- 2.1. CXO perspective
CHAPTER 3: MARKET OVERVIEW
- 3.1. Market definition and scope
- 3.2. Key findings
- 3.2.1. Top impacting factors
- 3.2.2. Top investment pockets
- 3.3. Porter's five forces analysis
- 3.4. Market dynamics
- 3.4.1. Drivers
- 3.4.2. Restraints
- 3.4.3. Opportunities
- 3.5. Market Share Analysis
- 3.6. Brand Share Analysis
- 3.7. Value Chain Analysis
- 3.8. Key Players Details
- 3.9. Key Regulation Analysis
- 3.10. Patent Landscape
CHAPTER 4: HYBRID BOATS MARKET, BY TYPE
- 4.1. Overview
- 4.1.1. Market size and forecast
- 4.2. Power Boats
- 4.2.1. Key market trends, growth factors and opportunities
- 4.2.2. Market size and forecast, by region
- 4.2.3. Market share analysis by country
- 4.3. Sail Boats
- 4.3.1. Key market trends, growth factors and opportunities
- 4.3.2. Market size and forecast, by region
- 4.3.3. Market share analysis by country
CHAPTER 5: HYBRID BOATS MARKET, BY PRODUCT TYPE
- 5.1. Overview
- 5.1.1. Market size and forecast
- 5.2. Parallel Hybrid Boats
- 5.2.1. Key market trends, growth factors and opportunities
- 5.2.2. Market size and forecast, by region
- 5.2.3. Market share analysis by country
- 5.3. Serial Hybrid Boats
- 5.3.1. Key market trends, growth factors and opportunities
- 5.3.2. Market size and forecast, by region
- 5.3.3. Market share analysis by country
- 5.4. Regenerative Hybrid Boats
- 5.4.1. Key market trends, growth factors and opportunities
- 5.4.2. Market size and forecast, by region
- 5.4.3. Market share analysis by country
CHAPTER 6: HYBRID BOATS MARKET, BY LENGTH
- 6.1. Overview
- 6.1.1. Market size and forecast
- 6.2. Less Than 26 Feet
- 6.2.1. Key market trends, growth factors and opportunities
- 6.2.2. Market size and forecast, by region
- 6.2.3. Market share analysis by country
- 6.3. 26 to 35 Feet
- 6.3.1. Key market trends, growth factors and opportunities
- 6.3.2. Market size and forecast, by region
- 6.3.3. Market share analysis by country
- 6.4. 36 to 45 Feet
- 6.4.1. Key market trends, growth factors and opportunities
- 6.4.2. Market size and forecast, by region
- 6.4.3. Market share analysis by country
- 6.5. 46 to 55 Feet
- 6.5.1. Key market trends, growth factors and opportunities
- 6.5.2. Market size and forecast, by region
- 6.5.3. Market share analysis by country
- 6.6. 56 to 79 Feet
- 6.6.1. Key market trends, growth factors and opportunities
- 6.6.2. Market size and forecast, by region
- 6.6.3. Market share analysis by country
- 6.7. Greater Than 80 Feet
- 6.7.1. Key market trends, growth factors and opportunities
- 6.7.2. Market size and forecast, by region
- 6.7.3. Market share analysis by country
CHAPTER 7: HYBRID BOATS MARKET, BY APPLICATION
- 7.1. Overview
- 7.1.1. Market size and forecast
- 7.2. Boating
- 7.2.1. Key market trends, growth factors and opportunities
- 7.2.2. Market size and forecast, by region
- 7.2.3. Market share analysis by country
- 7.3. Fishing
- 7.3.1. Key market trends, growth factors and opportunities
- 7.3.2. Market size and forecast, by region
- 7.3.3. Market share analysis by country
- 7.4. Watersports
- 7.4.1. Key market trends, growth factors and opportunities
- 7.4.2. Market size and forecast, by region
- 7.4.3. Market share analysis by country
- 7.5. Others
- 7.5.1. Key market trends, growth factors and opportunities
- 7.5.2. Market size and forecast, by region
- 7.5.3. Market share analysis by country
CHAPTER 8: HYBRID BOATS MARKET, BY REGION
- 8.1. Overview
- 8.1.1. Market size and forecast By Region
- 8.2. North America
- 8.2.1. Key market trends, growth factors and opportunities
- 8.2.2. Market size and forecast, by Type
- 8.2.3. Market size and forecast, by Product Type
- 8.2.4. Market size and forecast, by Length
- 8.2.5. Market size and forecast, by Application
- 8.2.6. Market size and forecast, by country
- 8.2.6.1. U.S.
- 8.2.6.1.1. Market size and forecast, by Type
- 8.2.6.1.2. Market size and forecast, by Product Type
- 8.2.6.1.3. Market size and forecast, by Length
- 8.2.6.1.4. Market size and forecast, by Application
- 8.2.6.2. Canada
- 8.2.6.2.1. Market size and forecast, by Type
- 8.2.6.2.2. Market size and forecast, by Product Type
- 8.2.6.2.3. Market size and forecast, by Length
- 8.2.6.2.4. Market size and forecast, by Application
- 8.2.6.3. Mexico
- 8.2.6.3.1. Market size and forecast, by Type
- 8.2.6.3.2. Market size and forecast, by Product Type
- 8.2.6.3.3. Market size and forecast, by Length
- 8.2.6.3.4. Market size and forecast, by Application
- 8.3. Europe
- 8.3.1. Key market trends, growth factors and opportunities
- 8.3.2. Market size and forecast, by Type
- 8.3.3. Market size and forecast, by Product Type
- 8.3.4. Market size and forecast, by Length
- 8.3.5. Market size and forecast, by Application
- 8.3.6. Market size and forecast, by country
- 8.3.6.1. Finland
- 8.3.6.1.1. Market size and forecast, by Type
- 8.3.6.1.2. Market size and forecast, by Product Type
- 8.3.6.1.3. Market size and forecast, by Length
- 8.3.6.1.4. Market size and forecast, by Application
- 8.3.6.2. Norway
- 8.3.6.2.1. Market size and forecast, by Type
- 8.3.6.2.2. Market size and forecast, by Product Type
- 8.3.6.2.3. Market size and forecast, by Length
- 8.3.6.2.4. Market size and forecast, by Application
- 8.3.6.3. Sweden
- 8.3.6.3.1. Market size and forecast, by Type
- 8.3.6.3.2. Market size and forecast, by Product Type
- 8.3.6.3.3. Market size and forecast, by Length
- 8.3.6.3.4. Market size and forecast, by Application
- 8.3.6.4. UK
- 8.3.6.4.1. Market size and forecast, by Type
- 8.3.6.4.2. Market size and forecast, by Product Type
- 8.3.6.4.3. Market size and forecast, by Length
- 8.3.6.4.4. Market size and forecast, by Application
- 8.3.6.5. Italy
- 8.3.6.5.1. Market size and forecast, by Type
- 8.3.6.5.2. Market size and forecast, by Product Type
- 8.3.6.5.3. Market size and forecast, by Length
- 8.3.6.5.4. Market size and forecast, by Application
- 8.3.6.6. Rest of Europe
- 8.3.6.6.1. Market size and forecast, by Type
- 8.3.6.6.2. Market size and forecast, by Product Type
- 8.3.6.6.3. Market size and forecast, by Length
- 8.3.6.6.4. Market size and forecast, by Application
- 8.4. Asia-Pacific
- 8.4.1. Key market trends, growth factors and opportunities
- 8.4.2. Market size and forecast, by Type
- 8.4.3. Market size and forecast, by Product Type
- 8.4.4. Market size and forecast, by Length
- 8.4.5. Market size and forecast, by Application
- 8.4.6. Market size and forecast, by country
- 8.4.6.1. China
- 8.4.6.1.1. Market size and forecast, by Type
- 8.4.6.1.2. Market size and forecast, by Product Type
- 8.4.6.1.3. Market size and forecast, by Length
- 8.4.6.1.4. Market size and forecast, by Application
- 8.4.6.2. Japan
- 8.4.6.2.1. Market size and forecast, by Type
- 8.4.6.2.2. Market size and forecast, by Product Type
- 8.4.6.2.3. Market size and forecast, by Length
- 8.4.6.2.4. Market size and forecast, by Application
- 8.4.6.3. India
- 8.4.6.3.1. Market size and forecast, by Type
- 8.4.6.3.2. Market size and forecast, by Product Type
- 8.4.6.3.3. Market size and forecast, by Length
- 8.4.6.3.4. Market size and forecast, by Application
- 8.4.6.4. New Zealand
- 8.4.6.4.1. Market size and forecast, by Type
- 8.4.6.4.2. Market size and forecast, by Product Type
- 8.4.6.4.3. Market size and forecast, by Length
- 8.4.6.4.4. Market size and forecast, by Application
- 8.4.6.5. Australia
- 8.4.6.5.1. Market size and forecast, by Type
- 8.4.6.5.2. Market size and forecast, by Product Type
- 8.4.6.5.3. Market size and forecast, by Length
- 8.4.6.5.4. Market size and forecast, by Application
- 8.4.6.6. Rest of Asia-Pacific
- 8.4.6.6.1. Market size and forecast, by Type
- 8.4.6.6.2. Market size and forecast, by Product Type
- 8.4.6.6.3. Market size and forecast, by Length
- 8.4.6.6.4. Market size and forecast, by Application
- 8.5. LAMEA
- 8.5.1. Key market trends, growth factors and opportunities
- 8.5.2. Market size and forecast, by Type
- 8.5.3. Market size and forecast, by Product Type
- 8.5.4. Market size and forecast, by Length
- 8.5.5. Market size and forecast, by Application
- 8.5.6. Market size and forecast, by country
- 8.5.6.1. Brazil
- 8.5.6.1.1. Market size and forecast, by Type
- 8.5.6.1.2. Market size and forecast, by Product Type
- 8.5.6.1.3. Market size and forecast, by Length
- 8.5.6.1.4. Market size and forecast, by Application
- 8.5.6.2. Saudi Arabia
- 8.5.6.2.1. Market size and forecast, by Type
- 8.5.6.2.2. Market size and forecast, by Product Type
- 8.5.6.2.3. Market size and forecast, by Length
- 8.5.6.2.4. Market size and forecast, by Application
- 8.5.6.3. United Arab Emirates
- 8.5.6.3.1. Market size and forecast, by Type
- 8.5.6.3.2. Market size and forecast, by Product Type
- 8.5.6.3.3. Market size and forecast, by Length
- 8.5.6.3.4. Market size and forecast, by Application
- 8.5.6.4. South Africa
- 8.5.6.4.1. Market size and forecast, by Type
- 8.5.6.4.2. Market size and forecast, by Product Type
- 8.5.6.4.3. Market size and forecast, by Length
- 8.5.6.4.4. Market size and forecast, by Application
- 8.5.6.5. Rest of LAMEA
- 8.5.6.5.1. Market size and forecast, by Type
- 8.5.6.5.2. Market size and forecast, by Product Type
- 8.5.6.5.3. Market size and forecast, by Length
- 8.5.6.5.4. Market size and forecast, by Application
CHAPTER 9: COMPETITIVE LANDSCAPE
- 9.1. Introduction
- 9.2. Top winning strategies
- 9.3. Product mapping of top 10 player
- 9.4. Competitive dashboard
- 9.5. Competitive heatmap
- 9.6. Top player positioning, 2022
CHAPTER 10: COMPANY PROFILES
- 10.1. Greenline Yachts
- 10.1.1. Company overview
- 10.1.2. Key executives
- 10.1.3. Company snapshot
- 10.1.4. Operating business segments
- 10.1.5. Product portfolio
- 10.1.6. Business performance
- 10.1.7. Key strategic moves and developments
- 10.2. Torqeedo GmbH
- 10.2.1. Company overview
- 10.2.2. Key executives
- 10.2.3. Company snapshot
- 10.2.4. Operating business segments
- 10.2.5. Product portfolio
- 10.2.6. Business performance
- 10.2.7. Key strategic moves and developments
- 10.3. aquawatt Green Marine Technologies
- 10.3.1. Company overview
- 10.3.2. Key executives
- 10.3.3. Company snapshot
- 10.3.4. Operating business segments
- 10.3.5. Product portfolio
- 10.3.6. Business performance
- 10.3.7. Key strategic moves and developments
- 10.4. Sunreef Yachts Eco
- 10.4.1. Company overview
- 10.4.2. Key executives
- 10.4.3. Company snapshot
- 10.4.4. Operating business segments
- 10.4.5. Product portfolio
- 10.4.6. Business performance
- 10.4.7. Key strategic moves and developments
- 10.5. BAVARIA YACHTS
- 10.5.1. Company overview
- 10.5.2. Key executives
- 10.5.3. Company snapshot
- 10.5.4. Operating business segments
- 10.5.5. Product portfolio
- 10.5.6. Business performance
- 10.5.7. Key strategic moves and developments
- 10.6. Nautique Boat Company, Inc.
- 10.6.1. Company overview
- 10.6.2. Key executives
- 10.6.3. Company snapshot
- 10.6.4. Operating business segments
- 10.6.5. Product portfolio
- 10.6.6. Business performance
- 10.6.7. Key strategic moves and developments
- 10.7. RAND Boats
- 10.7.1. Company overview
- 10.7.2. Key executives
- 10.7.3. Company snapshot
- 10.7.4. Operating business segments
- 10.7.5. Product portfolio
- 10.7.6. Business performance
- 10.7.7. Key strategic moves and developments
- 10.8. Elco Motor Yachts
- 10.8.1. Company overview
- 10.8.2. Key executives
- 10.8.3. Company snapshot
- 10.8.4. Operating business segments
- 10.8.5. Product portfolio
- 10.8.6. Business performance
- 10.8.7. Key strategic moves and developments
- 10.9. X Shore
- 10.9.1. Company overview
- 10.9.2. Key executives
- 10.9.3. Company snapshot
- 10.9.4. Operating business segments
- 10.9.5. Product portfolio
- 10.9.6. Business performance
- 10.9.7. Key strategic moves and developments
- 10.10. DOMANI YACHTS
- 10.10.1. Company overview
- 10.10.2. Key executives
- 10.10.3. Company snapshot
- 10.10.4. Operating business segments
- 10.10.5. Product portfolio
- 10.10.6. Business performance
- 10.10.7. Key strategic moves and developments
LIST OF TABLES
- TABLE 01. GLOBAL HYBRID BOATS MARKET, BY TYPE, 2022-2032 ($MILLION)
- TABLE 02. HYBRID BOATS MARKET FOR POWER BOATS, BY REGION, 2022-2032 ($MILLION)
- TABLE 03. HYBRID BOATS MARKET FOR SAIL BOATS, BY REGION, 2022-2032 ($MILLION)
- TABLE 04. GLOBAL HYBRID BOATS MARKET, BY PRODUCT TYPE, 2022-2032 ($MILLION)
- TABLE 05. HYBRID BOATS MARKET FOR PARALLEL HYBRID BOATS, BY REGION, 2022-2032 ($MILLION)
- TABLE 06. HYBRID BOATS MARKET FOR SERIAL HYBRID BOATS, BY REGION, 2022-2032 ($MILLION)
- TABLE 07. HYBRID BOATS MARKET FOR REGENERATIVE HYBRID BOATS, BY REGION, 2022-2032 ($MILLION)
- TABLE 08. GLOBAL HYBRID BOATS MARKET, BY LENGTH, 2022-2032 ($MILLION)
- TABLE 09. HYBRID BOATS MARKET FOR LESS THAN 26 FEET, BY REGION, 2022-2032 ($MILLION)
- TABLE 10. HYBRID BOATS MARKET FOR 26 TO 35 FEET, BY REGION, 2022-2032 ($MILLION)
- TABLE 11. HYBRID BOATS MARKET FOR 36 TO 45 FEET, BY REGION, 2022-2032 ($MILLION)
- TABLE 12. HYBRID BOATS MARKET FOR 46 TO 55 FEET, BY REGION, 2022-2032 ($MILLION)
- TABLE 13. HYBRID BOATS MARKET FOR 56 TO 79 FEET, BY REGION, 2022-2032 ($MILLION)
- TABLE 14. HYBRID BOATS MARKET FOR GREATER THAN 80 FEET, BY REGION, 2022-2032 ($MILLION)
- TABLE 15. GLOBAL HYBRID BOATS MARKET, BY APPLICATION, 2022-2032 ($MILLION)
- TABLE 16. HYBRID BOATS MARKET FOR BOATING, BY REGION, 2022-2032 ($MILLION)
- TABLE 17. HYBRID BOATS MARKET FOR FISHING, BY REGION, 2022-2032 ($MILLION)
- TABLE 18. HYBRID BOATS MARKET FOR WATERSPORTS, BY REGION, 2022-2032 ($MILLION)
- TABLE 19. HYBRID BOATS MARKET FOR OTHERS, BY REGION, 2022-2032 ($MILLION)
- TABLE 20. HYBRID BOATS MARKET, BY REGION, 2022-2032 ($MILLION)
- TABLE 21. NORTH AMERICA HYBRID BOATS MARKET, BY TYPE, 2022-2032 ($MILLION)
- TABLE 22. NORTH AMERICA HYBRID BOATS MARKET, BY PRODUCT TYPE, 2022-2032 ($MILLION)
- TABLE 23. NORTH AMERICA HYBRID BOATS MARKET, BY LENGTH, 2022-2032 ($MILLION)
- TABLE 24. NORTH AMERICA HYBRID BOATS MARKET, BY APPLICATION, 2022-2032 ($MILLION)
- TABLE 25. NORTH AMERICA HYBRID BOATS MARKET, BY COUNTRY, 2022-2032 ($MILLION)
- TABLE 26. U.S. HYBRID BOATS MARKET, BY TYPE, 2022-2032 ($MILLION)
- TABLE 27. U.S. HYBRID BOATS MARKET, BY PRODUCT TYPE, 2022-2032 ($MILLION)
- TABLE 28. U.S. HYBRID BOATS MARKET, BY LENGTH, 2022-2032 ($MILLION)
- TABLE 29. U.S. HYBRID BOATS MARKET, BY APPLICATION, 2022-2032 ($MILLION)
- TABLE 30. CANADA HYBRID BOATS MARKET, BY TYPE, 2022-2032 ($MILLION)
- TABLE 31. CANADA HYBRID BOATS MARKET, BY PRODUCT TYPE, 2022-2032 ($MILLION)
- TABLE 32. CANADA HYBRID BOATS MARKET, BY LENGTH, 2022-2032 ($MILLION)
- TABLE 33. CANADA HYBRID BOATS MARKET, BY APPLICATION, 2022-2032 ($MILLION)
- TABLE 34. MEXICO HYBRID BOATS MARKET, BY TYPE, 2022-2032 ($MILLION)
- TABLE 35. MEXICO HYBRID BOATS MARKET, BY PRODUCT TYPE, 2022-2032 ($MILLION)
- TABLE 36. MEXICO HYBRID BOATS MARKET, BY LENGTH, 2022-2032 ($MILLION)
- TABLE 37. MEXICO HYBRID BOATS MARKET, BY APPLICATION, 2022-2032 ($MILLION)
- TABLE 38. EUROPE HYBRID BOATS MARKET, BY TYPE, 2022-2032 ($MILLION)
- TABLE 39. EUROPE HYBRID BOATS MARKET, BY PRODUCT TYPE, 2022-2032 ($MILLION)
- TABLE 40. EUROPE HYBRID BOATS MARKET, BY LENGTH, 2022-2032 ($MILLION)
- TABLE 41. EUROPE HYBRID BOATS MARKET, BY APPLICATION, 2022-2032 ($MILLION)
- TABLE 42. EUROPE HYBRID BOATS MARKET, BY COUNTRY, 2022-2032 ($MILLION)
- TABLE 43. FINLAND HYBRID BOATS MARKET, BY TYPE, 2022-2032 ($MILLION)
- TABLE 44. FINLAND HYBRID BOATS MARKET, BY PRODUCT TYPE, 2022-2032 ($MILLION)
- TABLE 45. FINLAND HYBRID BOATS MARKET, BY LENGTH, 2022-2032 ($MILLION)
- TABLE 46. FINLAND HYBRID BOATS MARKET, BY APPLICATION, 2022-2032 ($MILLION)
- TABLE 47. NORWAY HYBRID BOATS MARKET, BY TYPE, 2022-2032 ($MILLION)
- TABLE 48. NORWAY HYBRID BOATS MARKET, BY PRODUCT TYPE, 2022-2032 ($MILLION)
- TABLE 49. NORWAY HYBRID BOATS MARKET, BY LENGTH, 2022-2032 ($MILLION)
- TABLE 50. NORWAY HYBRID BOATS MARKET, BY APPLICATION, 2022-2032 ($MILLION)
- TABLE 51. SWEDEN HYBRID BOATS MARKET, BY TYPE, 2022-2032 ($MILLION)
- TABLE 52. SWEDEN HYBRID BOATS MARKET, BY PRODUCT TYPE, 2022-2032 ($MILLION)
- TABLE 53. SWEDEN HYBRID BOATS MARKET, BY LENGTH, 2022-2032 ($MILLION)
- TABLE 54. SWEDEN HYBRID BOATS MARKET, BY APPLICATION, 2022-2032 ($MILLION)
- TABLE 55. UK HYBRID BOATS MARKET, BY TYPE, 2022-2032 ($MILLION)
- TABLE 56. UK HYBRID BOATS MARKET, BY PRODUCT TYPE, 2022-2032 ($MILLION)
- TABLE 57. UK HYBRID BOATS MARKET, BY LENGTH, 2022-2032 ($MILLION)
- TABLE 58. UK HYBRID BOATS MARKET, BY APPLICATION, 2022-2032 ($MILLION)
- TABLE 59. ITALY HYBRID BOATS MARKET, BY TYPE, 2022-2032 ($MILLION)
- TABLE 60. ITALY HYBRID BOATS MARKET, BY PRODUCT TYPE, 2022-2032 ($MILLION)
- TABLE 61. ITALY HYBRID BOATS MARKET, BY LENGTH, 2022-2032 ($MILLION)
- TABLE 62. ITALY HYBRID BOATS MARKET, BY APPLICATION, 2022-2032 ($MILLION)
- TABLE 63. REST OF EUROPE HYBRID BOATS MARKET, BY TYPE, 2022-2032 ($MILLION)
- TABLE 64. REST OF EUROPE HYBRID BOATS MARKET, BY PRODUCT TYPE, 2022-2032 ($MILLION)
- TABLE 65. REST OF EUROPE HYBRID BOATS MARKET, BY LENGTH, 2022-2032 ($MILLION)
- TABLE 66. REST OF EUROPE HYBRID BOATS MARKET, BY APPLICATION, 2022-2032 ($MILLION)
- TABLE 67. ASIA-PACIFIC HYBRID BOATS MARKET, BY TYPE, 2022-2032 ($MILLION)
- TABLE 68. ASIA-PACIFIC HYBRID BOATS MARKET, BY PRODUCT TYPE, 2022-2032 ($MILLION)
- TABLE 69. ASIA-PACIFIC HYBRID BOATS MARKET, BY LENGTH, 2022-2032 ($MILLION)
- TABLE 70. ASIA-PACIFIC HYBRID BOATS MARKET, BY APPLICATION, 2022-2032 ($MILLION)
- TABLE 71. ASIA-PACIFIC HYBRID BOATS MARKET, BY COUNTRY, 2022-2032 ($MILLION)
- TABLE 72. CHINA HYBRID BOATS MARKET, BY TYPE, 2022-2032 ($MILLION)
- TABLE 73. CHINA HYBRID BOATS MARKET, BY PRODUCT TYPE, 2022-2032 ($MILLION)
- TABLE 74. CHINA HYBRID BOATS MARKET, BY LENGTH, 2022-2032 ($MILLION)
- TABLE 75. CHINA HYBRID BOATS MARKET, BY APPLICATION, 2022-2032 ($MILLION)
- TABLE 76. JAPAN HYBRID BOATS MARKET, BY TYPE, 2022-2032 ($MILLION)
- TABLE 77. JAPAN HYBRID BOATS MARKET, BY PRODUCT TYPE, 2022-2032 ($MILLION)
- TABLE 78. JAPAN HYBRID BOATS MARKET, BY LENGTH, 2022-2032 ($MILLION)
- TABLE 79. JAPAN HYBRID BOATS MARKET, BY APPLICATION, 2022-2032 ($MILLION)
- TABLE 80. INDIA HYBRID BOATS MARKET, BY TYPE, 2022-2032 ($MILLION)
- TABLE 81. INDIA HYBRID BOATS MARKET, BY PRODUCT TYPE, 2022-2032 ($MILLION)
- TABLE 82. INDIA HYBRID BOATS MARKET, BY LENGTH, 2022-2032 ($MILLION)
- TABLE 83. INDIA HYBRID BOATS MARKET, BY APPLICATION, 2022-2032 ($MILLION)
- TABLE 84. NEW ZEALAND HYBRID BOATS MARKET, BY TYPE, 2022-2032 ($MILLION)
- TABLE 85. NEW ZEALAND HYBRID BOATS MARKET, BY PRODUCT TYPE, 2022-2032 ($MILLION)
- TABLE 86. NEW ZEALAND HYBRID BOATS MARKET, BY LENGTH, 2022-2032 ($MILLION)
- TABLE 87. NEW ZEALAND HYBRID BOATS MARKET, BY APPLICATION, 2022-2032 ($MILLION)
- TABLE 88. AUSTRALIA HYBRID BOATS MARKET, BY TYPE, 2022-2032 ($MILLION)
- TABLE 89. AUSTRALIA HYBRID BOATS MARKET, BY PRODUCT TYPE, 2022-2032 ($MILLION)
- TABLE 90. AUSTRALIA HYBRID BOATS MARKET, BY LENGTH, 2022-2032 ($MILLION)
- TABLE 91. AUSTRALIA HYBRID BOATS MARKET, BY APPLICATION, 2022-2032 ($MILLION)
- TABLE 92. REST OF ASIA-PACIFIC HYBRID BOATS MARKET, BY TYPE, 2022-2032 ($MILLION)
- TABLE 93. REST OF ASIA-PACIFIC HYBRID BOATS MARKET, BY PRODUCT TYPE, 2022-2032 ($MILLION)
- TABLE 94. REST OF ASIA-PACIFIC HYBRID BOATS MARKET, BY LENGTH, 2022-2032 ($MILLION)
- TABLE 95. REST OF ASIA-PACIFIC HYBRID BOATS MARKET, BY APPLICATION, 2022-2032 ($MILLION)
- TABLE 96. LAMEA HYBRID BOATS MARKET, BY TYPE, 2022-2032 ($MILLION)
- TABLE 97. LAMEA HYBRID BOATS MARKET, BY PRODUCT TYPE, 2022-2032 ($MILLION)
- TABLE 98. LAMEA HYBRID BOATS MARKET, BY LENGTH, 2022-2032 ($MILLION)
- TABLE 99. LAMEA HYBRID BOATS MARKET, BY APPLICATION, 2022-2032 ($MILLION)
- TABLE 100. LAMEA HYBRID BOATS MARKET, BY COUNTRY, 2022-2032 ($MILLION)
- TABLE 101. BRAZIL HYBRID BOATS MARKET, BY TYPE, 2022-2032 ($MILLION)
- TABLE 102. BRAZIL HYBRID BOATS MARKET, BY PRODUCT TYPE, 2022-2032 ($MILLION)
- TABLE 103. BRAZIL HYBRID BOATS MARKET, BY LENGTH, 2022-2032 ($MILLION)
- TABLE 104. BRAZIL HYBRID BOATS MARKET, BY APPLICATION, 2022-2032 ($MILLION)
- TABLE 105. SAUDI ARABIA HYBRID BOATS MARKET, BY TYPE, 2022-2032 ($MILLION)
- TABLE 106. SAUDI ARABIA HYBRID BOATS MARKET, BY PRODUCT TYPE, 2022-2032 ($MILLION)
- TABLE 107. SAUDI ARABIA HYBRID BOATS MARKET, BY LENGTH, 2022-2032 ($MILLION)
- TABLE 108. SAUDI ARABIA HYBRID BOATS MARKET, BY APPLICATION, 2022-2032 ($MILLION)
- TABLE 109. UNITED ARAB EMIRATES HYBRID BOATS MARKET, BY TYPE, 2022-2032 ($MILLION)
- TABLE 110. UNITED ARAB EMIRATES HYBRID BOATS MARKET, BY PRODUCT TYPE, 2022-2032 ($MILLION)
- TABLE 111. UNITED ARAB EMIRATES HYBRID BOATS MARKET, BY LENGTH, 2022-2032 ($MILLION)
- TABLE 112. UNITED ARAB EMIRATES HYBRID BOATS MARKET, BY APPLICATION, 2022-2032 ($MILLION)
- TABLE 113. SOUTH AFRICA HYBRID BOATS MARKET, BY TYPE, 2022-2032 ($MILLION)
- TABLE 114. SOUTH AFRICA HYBRID BOATS MARKET, BY PRODUCT TYPE, 2022-2032 ($MILLION)
- TABLE 115. SOUTH AFRICA HYBRID BOATS MARKET, BY LENGTH, 2022-2032 ($MILLION)
- TABLE 116. SOUTH AFRICA HYBRID BOATS MARKET, BY APPLICATION, 2022-2032 ($MILLION)
- TABLE 117. REST OF LAMEA HYBRID BOATS MARKET, BY TYPE, 2022-2032 ($MILLION)
- TABLE 118. REST OF LAMEA HYBRID BOATS MARKET, BY PRODUCT TYPE, 2022-2032 ($MILLION)
- TABLE 119. REST OF LAMEA HYBRID BOATS MARKET, BY LENGTH, 2022-2032 ($MILLION)
- TABLE 120. REST OF LAMEA HYBRID BOATS MARKET, BY APPLICATION, 2022-2032 ($MILLION)
- TABLE 121. GREENLINE YACHTS: KEY EXECUTIVES
- TABLE 122. GREENLINE YACHTS: COMPANY SNAPSHOT
- TABLE 123. GREENLINE YACHTS: PRODUCT SEGMENTS
- TABLE 124. GREENLINE YACHTS: SERVICE SEGMENTS
- TABLE 125. GREENLINE YACHTS: PRODUCT PORTFOLIO
- TABLE 126. GREENLINE YACHTS: KEY STRATERGIES
- TABLE 127. TORQEEDO GMBH: KEY EXECUTIVES
- TABLE 128. TORQEEDO GMBH: COMPANY SNAPSHOT
- TABLE 129. TORQEEDO GMBH: PRODUCT SEGMENTS
- TABLE 130. TORQEEDO GMBH: SERVICE SEGMENTS
- TABLE 131. TORQEEDO GMBH: PRODUCT PORTFOLIO
- TABLE 132. TORQEEDO GMBH: KEY STRATERGIES
- TABLE 133. AQUAWATT GREEN MARINE TECHNOLOGIES: KEY EXECUTIVES
- TABLE 134. AQUAWATT GREEN MARINE TECHNOLOGIES: COMPANY SNAPSHOT
- TABLE 135. AQUAWATT GREEN MARINE TECHNOLOGIES: PRODUCT SEGMENTS
- TABLE 136. AQUAWATT GREEN MARINE TECHNOLOGIES: SERVICE SEGMENTS
- TABLE 137. AQUAWATT GREEN MARINE TECHNOLOGIES: PRODUCT PORTFOLIO
- TABLE 138. AQUAWATT GREEN MARINE TECHNOLOGIES: KEY STRATERGIES
- TABLE 139. SUNREEF YACHTS ECO: KEY EXECUTIVES
- TABLE 140. SUNREEF YACHTS ECO: COMPANY SNAPSHOT
- TABLE 141. SUNREEF YACHTS ECO: PRODUCT SEGMENTS
- TABLE 142. SUNREEF YACHTS ECO: SERVICE SEGMENTS
- TABLE 143. SUNREEF YACHTS ECO: PRODUCT PORTFOLIO
- TABLE 144. SUNREEF YACHTS ECO: KEY STRATERGIES
- TABLE 145. BAVARIA YACHTS: KEY EXECUTIVES
- TABLE 146. BAVARIA YACHTS: COMPANY SNAPSHOT
- TABLE 147. BAVARIA YACHTS: PRODUCT SEGMENTS
- TABLE 148. BAVARIA YACHTS: SERVICE SEGMENTS
- TABLE 149. BAVARIA YACHTS: PRODUCT PORTFOLIO
- TABLE 150. BAVARIA YACHTS: KEY STRATERGIES
- TABLE 151. NAUTIQUE BOAT COMPANY, INC.: KEY EXECUTIVES
- TABLE 152. NAUTIQUE BOAT COMPANY, INC.: COMPANY SNAPSHOT
- TABLE 153. NAUTIQUE BOAT COMPANY, INC.: PRODUCT SEGMENTS
- TABLE 154. NAUTIQUE BOAT COMPANY, INC.: SERVICE SEGMENTS
- TABLE 155. NAUTIQUE BOAT COMPANY, INC.: PRODUCT PORTFOLIO
- TABLE 156. NAUTIQUE BOAT COMPANY, INC.: KEY STRATERGIES
- TABLE 157. RAND BOATS: KEY EXECUTIVES
- TABLE 158. RAND BOATS: COMPANY SNAPSHOT
- TABLE 159. RAND BOATS: PRODUCT SEGMENTS
- TABLE 160. RAND BOATS: SERVICE SEGMENTS
- TABLE 161. RAND BOATS: PRODUCT PORTFOLIO
- TABLE 162. RAND BOATS: KEY STRATERGIES
- TABLE 163. ELCO MOTOR YACHTS: KEY EXECUTIVES
- TABLE 164. ELCO MOTOR YACHTS: COMPANY SNAPSHOT
- TABLE 165. ELCO MOTOR YACHTS: PRODUCT SEGMENTS
- TABLE 166. ELCO MOTOR YACHTS: SERVICE SEGMENTS
- TABLE 167. ELCO MOTOR YACHTS: PRODUCT PORTFOLIO
- TABLE 168. ELCO MOTOR YACHTS: KEY STRATERGIES
- TABLE 169. X SHORE: KEY EXECUTIVES
- TABLE 170. X SHORE: COMPANY SNAPSHOT
- TABLE 171. X SHORE: PRODUCT SEGMENTS
- TABLE 172. X SHORE: SERVICE SEGMENTS
- TABLE 173. X SHORE: PRODUCT PORTFOLIO
- TABLE 174. X SHORE: KEY STRATERGIES
- TABLE 175. DOMANI YACHTS: KEY EXECUTIVES
- TABLE 176. DOMANI YACHTS: COMPANY SNAPSHOT
- TABLE 177. DOMANI YACHTS: PRODUCT SEGMENTS
- TABLE 178. DOMANI YACHTS: SERVICE SEGMENTS
- TABLE 179. DOMANI YACHTS: PRODUCT PORTFOLIO
- TABLE 180. DOMANI YACHTS: KEY STRATERGIES
LIST OF FIGURES
- FIGURE 01. HYBRID BOATS MARKET, 2022-2032
- FIGURE 02. SEGMENTATION OF HYBRID BOATS MARKET,2022-2032
- FIGURE 03. TOP IMPACTING FACTORS IN HYBRID BOATS MARKET
- FIGURE 04. TOP INVESTMENT POCKETS IN HYBRID BOATS MARKET (2023-2032)
- FIGURE 05. BARGAINING POWER OF SUPPLIERS
- FIGURE 06. BARGAINING POWER OF BUYERS
- FIGURE 07. THREAT OF SUBSTITUTION
- FIGURE 08. THREAT OF SUBSTITUTION
- FIGURE 09. COMPETITIVE RIVALRY
- FIGURE 10. GLOBAL HYBRID BOATS MARKET:DRIVERS, RESTRAINTS AND OPPORTUNITIES
- FIGURE 11. IMPACT OF KEY REGULATION: HYBRID BOATS MARKET
- FIGURE 12. PATENT ANALYSIS BY COMPANY
- FIGURE 13. PATENT ANALYSIS BY COUNTRY
- FIGURE 14. HYBRID BOATS MARKET, BY TYPE, 2022 AND 2032(%)
- FIGURE 15. COMPARATIVE SHARE ANALYSIS OF HYBRID BOATS MARKET FOR POWER BOATS, BY COUNTRY 2022 AND 2032(%)
- FIGURE 16. COMPARATIVE SHARE ANALYSIS OF HYBRID BOATS MARKET FOR SAIL BOATS, BY COUNTRY 2022 AND 2032(%)
- FIGURE 17. HYBRID BOATS MARKET, BY PRODUCT TYPE, 2022 AND 2032(%)
- FIGURE 18. COMPARATIVE SHARE ANALYSIS OF HYBRID BOATS MARKET FOR PARALLEL HYBRID BOATS, BY COUNTRY 2022 AND 2032(%)
- FIGURE 19. COMPARATIVE SHARE ANALYSIS OF HYBRID BOATS MARKET FOR SERIAL HYBRID BOATS, BY COUNTRY 2022 AND 2032(%)
- FIGURE 20. COMPARATIVE SHARE ANALYSIS OF HYBRID BOATS MARKET FOR REGENERATIVE HYBRID BOATS, BY COUNTRY 2022 AND 2032(%)
- FIGURE 21. HYBRID BOATS MARKET, BY LENGTH, 2022 AND 2032(%)
- FIGURE 22. COMPARATIVE SHARE ANALYSIS OF HYBRID BOATS MARKET FOR LESS THAN 26 FEET, BY COUNTRY 2022 AND 2032(%)
- FIGURE 23. COMPARATIVE SHARE ANALYSIS OF HYBRID BOATS MARKET FOR 26 TO 35 FEET, BY COUNTRY 2022 AND 2032(%)
- FIGURE 24. COMPARATIVE SHARE ANALYSIS OF HYBRID BOATS MARKET FOR 36 TO 45 FEET, BY COUNTRY 2022 AND 2032(%)
- FIGURE 25. COMPARATIVE SHARE ANALYSIS OF HYBRID BOATS MARKET FOR 46 TO 55 FEET, BY COUNTRY 2022 AND 2032(%)
- FIGURE 26. COMPARATIVE SHARE ANALYSIS OF HYBRID BOATS MARKET FOR 56 TO 79 FEET, BY COUNTRY 2022 AND 2032(%)
- FIGURE 27. COMPARATIVE SHARE ANALYSIS OF HYBRID BOATS MARKET FOR GREATER THAN 80 FEET, BY COUNTRY 2022 AND 2032(%)
- FIGURE 28. HYBRID BOATS MARKET, BY APPLICATION, 2022 AND 2032(%)
- FIGURE 29. COMPARATIVE SHARE ANALYSIS OF HYBRID BOATS MARKET FOR BOATING, BY COUNTRY 2022 AND 2032(%)
- FIGURE 30. COMPARATIVE SHARE ANALYSIS OF HYBRID BOATS MARKET FOR FISHING, BY COUNTRY 2022 AND 2032(%)
- FIGURE 31. COMPARATIVE SHARE ANALYSIS OF HYBRID BOATS MARKET FOR WATERSPORTS, BY COUNTRY 2022 AND 2032(%)
- FIGURE 32. COMPARATIVE SHARE ANALYSIS OF HYBRID BOATS MARKET FOR OTHERS, BY COUNTRY 2022 AND 2032(%)
- FIGURE 33. HYBRID BOATS MARKET BY REGION, 2022 AND 2032(%)
- FIGURE 34. U.S. HYBRID BOATS MARKET, 2022-2032 ($MILLION)
- FIGURE 35. CANADA HYBRID BOATS MARKET, 2022-2032 ($MILLION)
- FIGURE 36. MEXICO HYBRID BOATS MARKET, 2022-2032 ($MILLION)
- FIGURE 37. FINLAND HYBRID BOATS MARKET, 2022-2032 ($MILLION)
- FIGURE 38. NORWAY HYBRID BOATS MARKET, 2022-2032 ($MILLION)
- FIGURE 39. SWEDEN HYBRID BOATS MARKET, 2022-2032 ($MILLION)
- FIGURE 40. UK HYBRID BOATS MARKET, 2022-2032 ($MILLION)
- FIGURE 41. ITALY HYBRID BOATS MARKET, 2022-2032 ($MILLION)
- FIGURE 42. REST OF EUROPE HYBRID BOATS MARKET, 2022-2032 ($MILLION)
- FIGURE 43. CHINA HYBRID BOATS MARKET, 2022-2032 ($MILLION)
- FIGURE 44. JAPAN HYBRID BOATS MARKET, 2022-2032 ($MILLION)
- FIGURE 45. INDIA HYBRID BOATS MARKET, 2022-2032 ($MILLION)
- FIGURE 46. NEW ZEALAND HYBRID BOATS MARKET, 2022-2032 ($MILLION)
- FIGURE 47. AUSTRALIA HYBRID BOATS MARKET, 2022-2032 ($MILLION)
- FIGURE 48. REST OF ASIA-PACIFIC HYBRID BOATS MARKET, 2022-2032 ($MILLION)
- FIGURE 49. BRAZIL HYBRID BOATS MARKET, 2022-2032 ($MILLION)
- FIGURE 50. SAUDI ARABIA HYBRID BOATS MARKET, 2022-2032 ($MILLION)
- FIGURE 51. UNITED ARAB EMIRATES HYBRID BOATS MARKET, 2022-2032 ($MILLION)
- FIGURE 52. SOUTH AFRICA HYBRID BOATS MARKET, 2022-2032 ($MILLION)
- FIGURE 53. REST OF LAMEA HYBRID BOATS MARKET, 2022-2032 ($MILLION)
- FIGURE 54. TOP WINNING STRATEGIES, BY YEAR
- FIGURE 55. TOP WINNING STRATEGIES, BY DEVELOPMENT
- FIGURE 56. TOP WINNING STRATEGIES, BY COMPANY
- FIGURE 57. PRODUCT MAPPING OF TOP 10 PLAYERS
- FIGURE 58. COMPETITIVE DASHBOARD
- FIGURE 59. COMPETITIVE HEATMAP: HYBRID BOATS MARKET
- FIGURE 60. TOP PLAYER POSITIONING, 2022

