
PUBLISHER: Allied Market Research | PRODUCT CODE: 1641723

PUBLISHER: Allied Market Research | PRODUCT CODE: 1641723
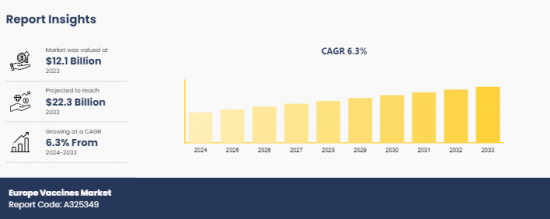
Europe Vaccines Market By Technology Type , By Indication By End User : Opportunity Analysis and Industry Forecast, 2024-2033
The Europe vaccines market was valued at $12.1 billion in 2023, and is projected to reach $22.3 billion by 2033, growing at a CAGR of 6.3% from 2024 to 2033.
Vaccine is a suspension of killed, weakened, or fragmented toxins, microorganisms, or other biological preparation such as those consisting of lymphocytes, antibodies, or messenger RNA (mRNA), that is administered to prevent diseases. The goal of vaccination is to prepare the body's immune defenses to respond effectively if exposed to the pathogen in the future, thereby preventing illness or reducing its severity.
The growth of the Europe vaccines market is majorly driven by alarming rise in burden of diseases such as measles, influenza, meningitis, and human papillomavirus. A study by Statista revealed that in 2023, approximately 4,000 measles cases were reported in the European Economic Area (EEA), with Romania accounting for nearly 3,400 cases, indicating a significant concentration of outbreaks in specific regions. Furthermore, strong governmental support through routine immunization programs, subsidies, and awareness campaigns significantly contributes toward the growth of the market. For instance, the European Centre for Disease Prevention and Control (ECDC) emphasizes vaccination programs to combat seasonal outbreaks. Initiatives like the European Immunization Week further aim to boost public confidence in vaccines and promote their adoption. In addition, increase in awareness among the population about the importance of vaccination in preventing life-threatening diseases encourages higher immunization rates. This is further supported by educational efforts from healthcare organizations. According to Statista, approximately 92.4% of children in the European Economic Area (EEA) received their first dose of the measles vaccination, whereas 89.7% received their second dose. The World Health Organization recommends a 95% vaccination rate to halt the spread of preventable diseases. Moreover, surge in geriatric population acts as the key driving force of the market. This is attributed to the fact that Europe's aging demographic has led to an increased demand for vaccines targeting age-related infections, such as pneumococcal and herpes zoster vaccines, to reduce healthcare costs and morbidity in older adults. Despite strong public health initiatives, vaccine hesitancy remains a significant barrier, influenced by misinformation, cultural beliefs, and distrust in pharmaceutical companies. The World Health Organization lists vaccine hesitancy as one of the top ten global health threats. Moreover, high cost associated with research, development, and manufacturing of vaccines significantly hampers the market growth. On the contrary, innovations such as mRNA-based vaccines, recombinant protein vaccines, and needle-free delivery methods have enhanced the efficiency, safety, and accessibility of vaccines, which are expected to offer remunerative opportunities for the expansion of the market during the forecast period.
The Europe vaccines market size is segmented into technology type, indication, end user, and country. On the basis of technology type, the market is categorized into recombinant & conjugate vaccines, live attenuated vaccines, inactivated vaccines, toxoid vaccines, and others. By indication, it is classified into pneumococcal disease; influenza; human papilloma virus; meningococcal disease; rotavirus; varicella; measles, mumps, and rubella; diphtheria, pertussis, and tetanus (DTP); polio; hepatitis; and other indications. Depending on end user, it is segregated into pediatric, adults, and travelers. Country wise, the Europe vaccines industry is analyzed across Germany, France, UK, Italy, Spain, and rest of Europe.
Competition Analysis
The major players operating in the Europe vaccines market include Pfizer, Bavarian Nordic A/S, Valneva SE, Viatris Inc., AstraZeneca, Emergex Vaccines, Sanofi, Prokarium, Merck & Co., Inc., and GSK Plc. These major players have adopted various key development strategies such as business expansion, new product launches, and partnerships to sustain the intense competition and gain a strong foothold in the market.
Additional benefits you will get with this purchase are:
- Quarterly Update and* (only available with a corporate license, on listed price)
- 5 additional Company Profile of client Choice pre- or Post-purchase, as a free update.
- Free Upcoming Version on the Purchase of Five and Enterprise User License.
- 16 analyst hours of support* (post-purchase, if you find additional data requirements upon review of the report, you may receive support amounting to 16 analyst hours to solve questions, and post-sale queries)
- 15% Free Customization* (in case the scope or segment of the report does not match your requirements, 15% is equivalent to 3 working days of free work, applicable once)
- Free data Pack on the Five and Enterprise User License. (Excel version of the report)
- Free Updated report if the report is 6-12 months old or older.
- 24-hour priority response*
- Free Industry updates and white papers.
Possible Customization with this report (with additional cost and timeline, please talk to the sales executive to know more)
- Regulatory Guidelines
- Additional company profiles with specific to client's interest
- Additional country or region analysis- market size and forecast
- Expanded list for Company Profiles
- Historic market data
- Key player details (including location, contact details, supplier/vendor network etc. in excel format)
Key Market Segments
By Technology Type
- Inactivated Vaccines
- Toxoid Vaccines
- Recombinant and Conjugate Vaccines
- Live Attenuated Vaccines
- Others
By Indication
- Pneumococcal Disease
- Influenza
- Human Papilloma Virus
- Meningococcal Disease
- Rotavirus
- Varicella
- Measles, Mumps, and Rubella
- Diphtheria, Pertussis, and Tetanus (DTP)
- Polio
- Hepatitis
- Other Indications
By End User
- Pediatric
- Adults
- Travelers
By Country
- Germany
- France
- UK
- Italy
- Spain
- Rest Of Europe
Key Market Players:
- Pfizer
- Bavarian Nordic A/S
- Valneva SE
- Viatris Inc.
- AstraZeneca
- Emergex Vaccines
- Sanofi
- Prokarium
- Merck & Co., Inc.
- GSK plc.
TABLE OF CONTENTS
CHAPTER 1: INTRODUCTION
- 1.1. Report Description
- 1.2. Key Market Segments
- 1.3. Key Benefits
- 1.4. Research Methodology
- 1.4.1. Primary Research
- 1.4.2. Secondary Research
- 1.4.3. Analyst Tools and Models
CHAPTER 2: EXECUTIVE SUMMARY
- 2.1. CXO Perspective
CHAPTER 3: MARKET LANDSCAPE
- 3.1. Market Definition and Scope
- 3.2. Key Findings
- 3.2.1. Top Investment Pockets
- 3.2.2. Top Winning Strategies
- 3.3. Porter's Five Forces Analysis
- 3.3.1. Bargaining Power of Suppliers
- 3.3.2. Threat of New Entrants
- 3.3.3. Threat of Substitutes
- 3.3.4. Competitive Rivalry
- 3.3.5. Bargaining Power among Buyers
- 3.4. Market Dynamics
- 3.4.1. Drivers
- 3.4.2. Restraints
- 3.4.3. Opportunities
CHAPTER 4: EUROPE VACCINES MARKET, BY TECHNOLOGY TYPE
- 4.1. Market Overview
- 4.1.1 Market Size and Forecast, By Technology Type
- 4.2. Inactivated Vaccines
- 4.2.1. Key Market Trends, Growth Factors and Opportunities
- 4.2.2. Market Share Analysis, By Country
- 4.3. Toxoid Vaccines
- 4.3.1. Key Market Trends, Growth Factors and Opportunities
- 4.3.2. Market Share Analysis, By Country
- 4.4. Recombinant And Conjugate Vaccines
- 4.4.1. Key Market Trends, Growth Factors and Opportunities
- 4.4.2. Market Share Analysis, By Country
- 4.5. Live Attenuated Vaccines
- 4.5.1. Key Market Trends, Growth Factors and Opportunities
- 4.5.2. Market Share Analysis, By Country
- 4.6. Others
- 4.6.1. Key Market Trends, Growth Factors and Opportunities
- 4.6.2. Market Share Analysis, By Country
CHAPTER 5: EUROPE VACCINES MARKET, BY INDICATION
- 5.1. Market Overview
- 5.1.1 Market Size and Forecast, By Indication
- 5.2. Pneumococcal Disease
- 5.2.1. Key Market Trends, Growth Factors and Opportunities
- 5.2.2. Market Share Analysis, By Country
- 5.3. Influenza
- 5.3.1. Key Market Trends, Growth Factors and Opportunities
- 5.3.2. Market Share Analysis, By Country
- 5.4. Human Papilloma Virus
- 5.4.1. Key Market Trends, Growth Factors and Opportunities
- 5.4.2. Market Share Analysis, By Country
- 5.5. Meningococcal Disease
- 5.5.1. Key Market Trends, Growth Factors and Opportunities
- 5.5.2. Market Share Analysis, By Country
- 5.6. Rotavirus
- 5.6.1. Key Market Trends, Growth Factors and Opportunities
- 5.6.2. Market Share Analysis, By Country
- 5.7. Varicella
- 5.7.1. Key Market Trends, Growth Factors and Opportunities
- 5.7.2. Market Share Analysis, By Country
- 5.8. Measles, Mumps, And Rubella
- 5.8.1. Key Market Trends, Growth Factors and Opportunities
- 5.8.2. Market Share Analysis, By Country
- 5.9. Diphtheria, Pertussis, And Tetanus (DTP)
- 5.9.1. Key Market Trends, Growth Factors and Opportunities
- 5.9.2. Market Share Analysis, By Country
- 5.10. Polio
- 5.10.1. Key Market Trends, Growth Factors and Opportunities
- 5.10.2. Market Share Analysis, By Country
- 5.11. Hepatitis
- 5.11.1. Key Market Trends, Growth Factors and Opportunities
- 5.11.2. Market Share Analysis, By Country
- 5.12. Other Indications
- 5.12.1. Key Market Trends, Growth Factors and Opportunities
- 5.12.2. Market Share Analysis, By Country
CHAPTER 6: EUROPE VACCINES MARKET, BY END USER
- 6.1. Market Overview
- 6.1.1 Market Size and Forecast, By End User
- 6.2. Pediatric
- 6.2.1. Key Market Trends, Growth Factors and Opportunities
- 6.2.2. Market Share Analysis, By Country
- 6.3. Adults
- 6.3.1. Key Market Trends, Growth Factors and Opportunities
- 6.3.2. Market Share Analysis, By Country
- 6.4. Travelers
- 6.4.1. Key Market Trends, Growth Factors and Opportunities
- 6.4.2. Market Share Analysis, By Country
CHAPTER 7: EUROPE VACCINES MARKET, BY COUNTRY
- 7.1. Market Overview
- 7.1.1 Market Size and Forecast, By Country
- 7.2. Europe
- 7.2.2. Key Market Trends and Opportunities
- 7.2.2. Market Size and Forecast, By Technology Type
- 7.2.3. Market Size and Forecast, By Indication
- 7.2.4. Market Size and Forecast, By End User
- 7.2.5. Market Size and Forecast, By Country
- 7.2.6.Germany
- 7.2.6.1. Market Size and Forecast, By Technology Type
- 7.2.6.2. Market Size and Forecast, By Indication
- 7.2.6.3. Market Size and Forecast, By End User
- 7.2.7.France
- 7.2.7.1. Market Size and Forecast, By Technology Type
- 7.2.7.2. Market Size and Forecast, By Indication
- 7.2.7.3. Market Size and Forecast, By End User
- 7.2.8.UK
- 7.2.8.1. Market Size and Forecast, By Technology Type
- 7.2.8.2. Market Size and Forecast, By Indication
- 7.2.8.3. Market Size and Forecast, By End User
- 7.2.9.Italy
- 7.2.9.1. Market Size and Forecast, By Technology Type
- 7.2.9.2. Market Size and Forecast, By Indication
- 7.2.9.3. Market Size and Forecast, By End User
- 7.2.10.Spain
- 7.2.10.1. Market Size and Forecast, By Technology Type
- 7.2.10.2. Market Size and Forecast, By Indication
- 7.2.10.3. Market Size and Forecast, By End User
- 7.2.11.Rest Of Europe
- 7.2.11.1. Market Size and Forecast, By Technology Type
- 7.2.11.2. Market Size and Forecast, By Indication
- 7.2.11.3. Market Size and Forecast, By End User
CHAPTER 8: COMPETITIVE LANDSCAPE
- 8.1. Introduction
- 8.2. Top Winning Strategies
- 8.3. Product Mapping Of Top 10 Player
- 8.4. Competitive Dashboard
- 8.5. Competitive Heatmap
- 8.6. Top Player Positioning,2023
CHAPTER 9: COMPANY PROFILES
- 9.1. Pfizer
- 9.1.1. Company Overview
- 9.1.2. Key Executives
- 9.1.3. Company Snapshot
- 9.1.4. Operating Business Segments
- 9.1.5. Product Portfolio
- 9.1.6. Business Performance
- 9.1.7. Key Strategic Moves and Developments
- 9.2. Bavarian Nordic A/S
- 9.2.1. Company Overview
- 9.2.2. Key Executives
- 9.2.3. Company Snapshot
- 9.2.4. Operating Business Segments
- 9.2.5. Product Portfolio
- 9.2.6. Business Performance
- 9.2.7. Key Strategic Moves and Developments
- 9.3. Valneva SE
- 9.3.1. Company Overview
- 9.3.2. Key Executives
- 9.3.3. Company Snapshot
- 9.3.4. Operating Business Segments
- 9.3.5. Product Portfolio
- 9.3.6. Business Performance
- 9.3.7. Key Strategic Moves and Developments
- 9.4. Viatris Inc.
- 9.4.1. Company Overview
- 9.4.2. Key Executives
- 9.4.3. Company Snapshot
- 9.4.4. Operating Business Segments
- 9.4.5. Product Portfolio
- 9.4.6. Business Performance
- 9.4.7. Key Strategic Moves and Developments
- 9.5. AstraZeneca
- 9.5.1. Company Overview
- 9.5.2. Key Executives
- 9.5.3. Company Snapshot
- 9.5.4. Operating Business Segments
- 9.5.5. Product Portfolio
- 9.5.6. Business Performance
- 9.5.7. Key Strategic Moves and Developments
- 9.6. Emergex Vaccines
- 9.6.1. Company Overview
- 9.6.2. Key Executives
- 9.6.3. Company Snapshot
- 9.6.4. Operating Business Segments
- 9.6.5. Product Portfolio
- 9.6.6. Business Performance
- 9.6.7. Key Strategic Moves and Developments
- 9.7. Sanofi
- 9.7.1. Company Overview
- 9.7.2. Key Executives
- 9.7.3. Company Snapshot
- 9.7.4. Operating Business Segments
- 9.7.5. Product Portfolio
- 9.7.6. Business Performance
- 9.7.7. Key Strategic Moves and Developments
- 9.8. Prokarium
- 9.8.1. Company Overview
- 9.8.2. Key Executives
- 9.8.3. Company Snapshot
- 9.8.4. Operating Business Segments
- 9.8.5. Product Portfolio
- 9.8.6. Business Performance
- 9.8.7. Key Strategic Moves and Developments
- 9.9. Merck And Co., Inc.
- 9.9.1. Company Overview
- 9.9.2. Key Executives
- 9.9.3. Company Snapshot
- 9.9.4. Operating Business Segments
- 9.9.5. Product Portfolio
- 9.9.6. Business Performance
- 9.9.7. Key Strategic Moves and Developments
- 9.10. GSK Plc.
- 9.10.1. Company Overview
- 9.10.2. Key Executives
- 9.10.3. Company Snapshot
- 9.10.4. Operating Business Segments
- 9.10.5. Product Portfolio
- 9.10.6. Business Performance
- 9.10.7. Key Strategic Moves and Developments
- TABLE 1. EUROPE VACCINES MARKET, BY TECHNOLOGY TYPE, 2024 - 2033 ($BILLION)
- TABLE 2. EUROPE VACCINES MARKET FOR INACTIVATED VACCINES, BY COUNTRY, 2024 - 2033 ($BILLION)
- TABLE 3. EUROPE VACCINES MARKET FOR TOXOID VACCINES, BY COUNTRY, 2024 - 2033 ($BILLION)
- TABLE 4. EUROPE VACCINES MARKET FOR RECOMBINANT AND CONJUGATE VACCINES, BY COUNTRY, 2024 - 2033 ($BILLION)
- TABLE 5. EUROPE VACCINES MARKET FOR LIVE ATTENUATED VACCINES, BY COUNTRY, 2024 - 2033 ($BILLION)
- TABLE 6. EUROPE VACCINES MARKET FOR OTHERS, BY COUNTRY, 2024 - 2033 ($BILLION)
- TABLE 7. EUROPE VACCINES MARKET, BY INDICATION, 2024 - 2033 ($BILLION)
- TABLE 8. EUROPE VACCINES MARKET FOR PNEUMOCOCCAL DISEASE, BY COUNTRY, 2024 - 2033 ($BILLION)
- TABLE 9. EUROPE VACCINES MARKET FOR INFLUENZA, BY COUNTRY, 2024 - 2033 ($BILLION)
- TABLE 10. EUROPE VACCINES MARKET FOR HUMAN PAPILLOMA VIRUS, BY COUNTRY, 2024 - 2033 ($BILLION)
- TABLE 11. EUROPE VACCINES MARKET FOR MENINGOCOCCAL DISEASE, BY COUNTRY, 2024 - 2033 ($BILLION)
- TABLE 12. EUROPE VACCINES MARKET FOR ROTAVIRUS, BY COUNTRY, 2024 - 2033 ($BILLION)
- TABLE 13. EUROPE VACCINES MARKET FOR VARICELLA, BY COUNTRY, 2024 - 2033 ($BILLION)
- TABLE 14. EUROPE VACCINES MARKET FOR MEASLES, MUMPS, AND RUBELLA, BY COUNTRY, 2024 - 2033 ($BILLION)
- TABLE 15. EUROPE VACCINES MARKET FOR DIPHTHERIA, PERTUSSIS, AND TETANUS (DTP), BY COUNTRY, 2024 - 2033 ($BILLION)
- TABLE 16. EUROPE VACCINES MARKET FOR POLIO, BY COUNTRY, 2024 - 2033 ($BILLION)
- TABLE 17. EUROPE VACCINES MARKET FOR HEPATITIS, BY COUNTRY, 2024 - 2033 ($BILLION)
- TABLE 18. EUROPE VACCINES MARKET FOR OTHER INDICATIONS, BY COUNTRY, 2024 - 2033 ($BILLION)
- TABLE 19. EUROPE VACCINES MARKET, BY END USER, 2024 - 2033 ($BILLION)
- TABLE 20. EUROPE VACCINES MARKET FOR PEDIATRIC, BY COUNTRY, 2024 - 2033 ($BILLION)
- TABLE 21. EUROPE VACCINES MARKET FOR ADULTS, BY COUNTRY, 2024 - 2033 ($BILLION)
- TABLE 22. EUROPE VACCINES MARKET FOR TRAVELERS, BY COUNTRY, 2024 - 2033 ($BILLION)
- TABLE 23. EUROPE VACCINES MARKET, BY COUNTRY, 2024 - 2033 ($BILLION)
- TABLE 24. EUROPE VACCINES MARKET, BY TECHNOLOGY TYPE, 2024 - 2033 ($BILLION)
- TABLE 25. EUROPE VACCINES MARKET, BY INDICATION, 2024 - 2033 ($BILLION)
- TABLE 26. EUROPE VACCINES MARKET, BY END USER, 2024 - 2033 ($BILLION)
- TABLE 27. GERMANY VACCINES MARKET, BY TECHNOLOGY TYPE, 2024 - 2033 ($BILLION)
- TABLE 28. GERMANY VACCINES MARKET, BY INDICATION, 2024 - 2033 ($BILLION)
- TABLE 29. GERMANY VACCINES MARKET, BY END USER, 2024 - 2033 ($BILLION)
- TABLE 30. FRANCE VACCINES MARKET, BY TECHNOLOGY TYPE, 2024 - 2033 ($BILLION)
- TABLE 31. FRANCE VACCINES MARKET, BY INDICATION, 2024 - 2033 ($BILLION)
- TABLE 32. FRANCE VACCINES MARKET, BY END USER, 2024 - 2033 ($BILLION)
- TABLE 33. UK VACCINES MARKET, BY TECHNOLOGY TYPE, 2024 - 2033 ($BILLION)
- TABLE 34. UK VACCINES MARKET, BY INDICATION, 2024 - 2033 ($BILLION)
- TABLE 35. UK VACCINES MARKET, BY END USER, 2024 - 2033 ($BILLION)
- TABLE 36. ITALY VACCINES MARKET, BY TECHNOLOGY TYPE, 2024 - 2033 ($BILLION)
- TABLE 37. ITALY VACCINES MARKET, BY INDICATION, 2024 - 2033 ($BILLION)
- TABLE 38. ITALY VACCINES MARKET, BY END USER, 2024 - 2033 ($BILLION)
- TABLE 39. SPAIN VACCINES MARKET, BY TECHNOLOGY TYPE, 2024 - 2033 ($BILLION)
- TABLE 40. SPAIN VACCINES MARKET, BY INDICATION, 2024 - 2033 ($BILLION)
- TABLE 41. SPAIN VACCINES MARKET, BY END USER, 2024 - 2033 ($BILLION)
- TABLE 42. REST OF EUROPE VACCINES MARKET, BY TECHNOLOGY TYPE, 2024 - 2033 ($BILLION)
- TABLE 43. REST OF EUROPE VACCINES MARKET, BY INDICATION, 2024 - 2033 ($BILLION)
- TABLE 44. REST OF EUROPE VACCINES MARKET, BY END USER, 2024 - 2033 ($BILLION)
- TABLE 45. PFIZER: KEY EXECUTIVES
- TABLE 46. PFIZER: COMPANY SNAPSHOT
- TABLE 47. PFIZER: OPERATING SEGMENTS
- TABLE 48. PFIZER: PRODUCT PORTFOLIO
- TABLE 49. PFIZER: KEY STRATEGIC MOVES AND DEVELOPMENTS
- TABLE 50. BAVARIAN NORDIC A/S: KEY EXECUTIVES
- TABLE 51. BAVARIAN NORDIC A/S: COMPANY SNAPSHOT
- TABLE 52. BAVARIAN NORDIC A/S: OPERATING SEGMENTS
- TABLE 53. BAVARIAN NORDIC A/S: PRODUCT PORTFOLIO
- TABLE 54. BAVARIAN NORDIC A/S: KEY STRATEGIC MOVES AND DEVELOPMENTS
- TABLE 55. VALNEVA SE: KEY EXECUTIVES
- TABLE 56. VALNEVA SE: COMPANY SNAPSHOT
- TABLE 57. VALNEVA SE: OPERATING SEGMENTS
- TABLE 58. VALNEVA SE: PRODUCT PORTFOLIO
- TABLE 59. VALNEVA SE: KEY STRATEGIC MOVES AND DEVELOPMENTS
- TABLE 60. VIATRIS INC.: KEY EXECUTIVES
- TABLE 61. VIATRIS INC.: COMPANY SNAPSHOT
- TABLE 62. VIATRIS INC.: OPERATING SEGMENTS
- TABLE 63. VIATRIS INC.: PRODUCT PORTFOLIO
- TABLE 64. VIATRIS INC.: KEY STRATEGIC MOVES AND DEVELOPMENTS
- TABLE 65. ASTRAZENECA: KEY EXECUTIVES
- TABLE 66. ASTRAZENECA: COMPANY SNAPSHOT
- TABLE 67. ASTRAZENECA: OPERATING SEGMENTS
- TABLE 68. ASTRAZENECA: PRODUCT PORTFOLIO
- TABLE 69. ASTRAZENECA: KEY STRATEGIC MOVES AND DEVELOPMENTS
- TABLE 70. EMERGEX VACCINES: KEY EXECUTIVES
- TABLE 71. EMERGEX VACCINES: COMPANY SNAPSHOT
- TABLE 72. EMERGEX VACCINES: OPERATING SEGMENTS
- TABLE 73. EMERGEX VACCINES: PRODUCT PORTFOLIO
- TABLE 74. EMERGEX VACCINES: KEY STRATEGIC MOVES AND DEVELOPMENTS
- TABLE 75. SANOFI: KEY EXECUTIVES
- TABLE 76. SANOFI: COMPANY SNAPSHOT
- TABLE 77. SANOFI: OPERATING SEGMENTS
- TABLE 78. SANOFI: PRODUCT PORTFOLIO
- TABLE 79. SANOFI: KEY STRATEGIC MOVES AND DEVELOPMENTS
- TABLE 80. PROKARIUM: KEY EXECUTIVES
- TABLE 81. PROKARIUM: COMPANY SNAPSHOT
- TABLE 82. PROKARIUM: OPERATING SEGMENTS
- TABLE 83. PROKARIUM: PRODUCT PORTFOLIO
- TABLE 84. PROKARIUM: KEY STRATEGIC MOVES AND DEVELOPMENTS
- TABLE 85. MERCK AND CO., INC.: KEY EXECUTIVES
- TABLE 86. MERCK AND CO., INC.: COMPANY SNAPSHOT
- TABLE 87. MERCK AND CO., INC.: OPERATING SEGMENTS
- TABLE 88. MERCK AND CO., INC.: PRODUCT PORTFOLIO
- TABLE 89. MERCK AND CO., INC.: KEY STRATEGIC MOVES AND DEVELOPMENTS
- TABLE 90. GSK PLC.: KEY EXECUTIVES
- TABLE 91. GSK PLC.: COMPANY SNAPSHOT
- TABLE 92. GSK PLC.: OPERATING SEGMENTS
- TABLE 93. GSK PLC.: PRODUCT PORTFOLIO
- TABLE 94. GSK PLC.: KEY STRATEGIC MOVES AND DEVELOPMENTS
- FIGURE 1. EUROPE VACCINES MARKET,2024 - 2033
- FIGURE 2. SEGMENTATION OF EUROPE VACCINES MARKET,2024 - 2033
- FIGURE 3. TOP INVESTMENT POCKET IN EUROPE VACCINES MARKET,2024 - 2033
- FIGURE 4. MODERATE BARGAINING POWER OF BUYERS
- FIGURE 5. MODERATE BARGAINING POWER OF SUPPLIERS
- FIGURE 6. MODERATE THREAT OF NEW ENTRANTS
- FIGURE 7. LOW THREAT OF SUBSTITUTION
- FIGURE 8. HIGH COMPETITIVE RIVALRY
- FIGURE 9. OPPORTUNITIES, RESTRAINTS AND DRIVERS: EUROPE VACCINES MARKET
- FIGURE 10. EUROPE VACCINES MARKET , BY TECHNOLOGY TYPE,2024 - 2033 ($BILLION)
- FIGURE 11. EUROPE VACCINES MARKET FOR INACTIVATED VACCINES, BY COUNTRY, 2024 - 2033 ($BILLION)
- FIGURE 12. EUROPE VACCINES MARKET FOR TOXOID VACCINES, BY COUNTRY, 2024 - 2033 ($BILLION)
- FIGURE 13. EUROPE VACCINES MARKET FOR RECOMBINANT AND CONJUGATE VACCINES, BY COUNTRY, 2024 - 2033 ($BILLION)
- FIGURE 14. EUROPE VACCINES MARKET FOR LIVE ATTENUATED VACCINES, BY COUNTRY, 2024 - 2033 ($BILLION)
- FIGURE 15. EUROPE VACCINES MARKET FOR OTHERS, BY COUNTRY, 2024 - 2033 ($BILLION)
- FIGURE 16. EUROPE VACCINES MARKET , BY INDICATION,2024 - 2033 ($BILLION)
- FIGURE 17. EUROPE VACCINES MARKET FOR PNEUMOCOCCAL DISEASE, BY COUNTRY, 2024 - 2033 ($BILLION)
- FIGURE 18. EUROPE VACCINES MARKET FOR INFLUENZA, BY COUNTRY, 2024 - 2033 ($BILLION)
- FIGURE 19. EUROPE VACCINES MARKET FOR HUMAN PAPILLOMA VIRUS, BY COUNTRY, 2024 - 2033 ($BILLION)
- FIGURE 20. EUROPE VACCINES MARKET FOR MENINGOCOCCAL DISEASE, BY COUNTRY, 2024 - 2033 ($BILLION)
- FIGURE 21. EUROPE VACCINES MARKET FOR ROTAVIRUS, BY COUNTRY, 2024 - 2033 ($BILLION)
- FIGURE 22. EUROPE VACCINES MARKET FOR VARICELLA, BY COUNTRY, 2024 - 2033 ($BILLION)
- FIGURE 23. EUROPE VACCINES MARKET FOR MEASLES, MUMPS, AND RUBELLA, BY COUNTRY, 2024 - 2033 ($BILLION)
- FIGURE 24. EUROPE VACCINES MARKET FOR DIPHTHERIA, PERTUSSIS, AND TETANUS (DTP), BY COUNTRY, 2024 - 2033 ($BILLION)
- FIGURE 25. EUROPE VACCINES MARKET FOR POLIO, BY COUNTRY, 2024 - 2033 ($BILLION)
- FIGURE 26. EUROPE VACCINES MARKET FOR HEPATITIS, BY COUNTRY, 2024 - 2033 ($BILLION)
- FIGURE 27. EUROPE VACCINES MARKET FOR OTHER INDICATIONS, BY COUNTRY, 2024 - 2033 ($BILLION)
- FIGURE 28. EUROPE VACCINES MARKET , BY END USER,2024 - 2033 ($BILLION)
- FIGURE 29. EUROPE VACCINES MARKET FOR PEDIATRIC, BY COUNTRY, 2024 - 2033 ($BILLION)
- FIGURE 30. EUROPE VACCINES MARKET FOR ADULTS, BY COUNTRY, 2024 - 2033 ($BILLION)
- FIGURE 31. EUROPE VACCINES MARKET FOR TRAVELERS, BY COUNTRY, 2024 - 2033 ($BILLION)
- FIGURE 32. TOP WINNING STRATEGIES, BY YEAR, 2021-2023*
- FIGURE 33. TOP WINNING STRATEGIES, BY DEVELOPMENT, 2021-2023*
- FIGURE 34. TOP WINNING STRATEGIES, BY COMPANY, 2021-2023*
- FIGURE 35. PRODUCT MAPPING OF TOP 10 PLAYERS
- FIGURE 36. COMPETITIVE DASHBOARD
- FIGURE 37. COMPETITIVE HEATMAP: EUROPE VACCINES MARKET
- FIGURE 38. TOP PLAYER POSITIONING,2023
- FIGURE 39. PFIZER: NET SALES, 2021-2023 ($BILLION)
- FIGURE 40. PFIZER: REVENUE SHARE, BY SEGMENT, 2023 (%)
- FIGURE 41. PFIZER: REVENUE SHARE, BY REGION, 2023 (%)
- FIGURE 42. BAVARIAN NORDIC A/S: NET SALES, 2021-2023 ($BILLION)
- FIGURE 43. BAVARIAN NORDIC A/S: REVENUE SHARE, BY SEGMENT, 2023 (%)
- FIGURE 44. BAVARIAN NORDIC A/S: REVENUE SHARE, BY REGION, 2023 (%)
- FIGURE 45. VALNEVA SE: NET SALES, 2021-2023 ($BILLION)
- FIGURE 46. VALNEVA SE: REVENUE SHARE, BY SEGMENT, 2023 (%)
- FIGURE 47. VALNEVA SE: REVENUE SHARE, BY REGION, 2023 (%)
- FIGURE 48. VIATRIS INC.: NET SALES, 2021-2023 ($BILLION)
- FIGURE 49. VIATRIS INC.: REVENUE SHARE, BY SEGMENT, 2023 (%)
- FIGURE 50. VIATRIS INC.: REVENUE SHARE, BY REGION, 2023 (%)
- FIGURE 51. ASTRAZENECA: NET SALES, 2021-2023 ($BILLION)
- FIGURE 52. ASTRAZENECA: REVENUE SHARE, BY SEGMENT, 2023 (%)
- FIGURE 53. ASTRAZENECA: REVENUE SHARE, BY REGION, 2023 (%)
- FIGURE 54. EMERGEX VACCINES: NET SALES, 2021-2023 ($BILLION)
- FIGURE 55. EMERGEX VACCINES: REVENUE SHARE, BY SEGMENT, 2023 (%)
- FIGURE 56. EMERGEX VACCINES: REVENUE SHARE, BY REGION, 2023 (%)
- FIGURE 57. SANOFI: NET SALES, 2021-2023 ($BILLION)
- FIGURE 58. SANOFI: REVENUE SHARE, BY SEGMENT, 2023 (%)
- FIGURE 59. SANOFI: REVENUE SHARE, BY REGION, 2023 (%)
- FIGURE 60. PROKARIUM: NET SALES, 2021-2023 ($BILLION)
- FIGURE 61. PROKARIUM: REVENUE SHARE, BY SEGMENT, 2023 (%)
- FIGURE 62. PROKARIUM: REVENUE SHARE, BY REGION, 2023 (%)
- FIGURE 63. MERCK AND CO., INC.: NET SALES, 2021-2023 ($BILLION)
- FIGURE 64. MERCK AND CO., INC.: REVENUE SHARE, BY SEGMENT, 2023 (%)
- FIGURE 65. MERCK AND CO., INC.: REVENUE SHARE, BY REGION, 2023 (%)
- FIGURE 66. GSK PLC.: NET SALES, 2021-2023 ($BILLION)
- FIGURE 67. GSK PLC.: REVENUE SHARE, BY SEGMENT, 2023 (%)
- FIGURE 68. GSK PLC.: REVENUE SHARE, BY REGION, 2023 (%)

