
PUBLISHER: Allied Market Research | PRODUCT CODE: 1641767

PUBLISHER: Allied Market Research | PRODUCT CODE: 1641767
U.S. Beef Market By Distribution Channel , By Product Type By Cut Type : Opportunity Analysis and Industry Forecast, 2023-2032
U.S. Beef Market
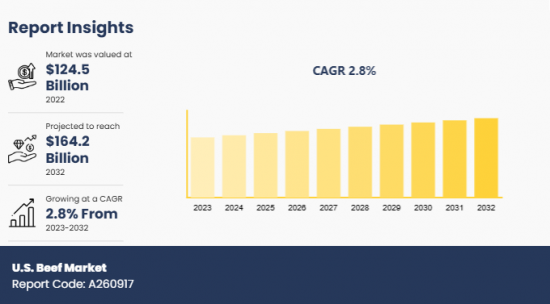
The U.S. beef market was valued at $124.5 billion in 2022 and is projected to reach $164.2 billion by 2032, growing at a CAGR of 2.8% from 2023 to 2032.
Beef is a category of red meat obtained from different cattle, primarily adult cows. The distinctive flavor and texture of beef are attributed to its combination of muscle tissue, connective tissue, and fat. Different forms of cuts in beef result in varying textures & tastes and it is considered a nutrition-rich food due to the abundance of protein, vitamin B, iron, zinc, and fat. Beef cuts majorly consumed in the U.S. include loin, chuck, rib, and round.
High efficiency in the production of good quality meat in the U.S. owing to advancements in breeding and feeding technologies is a key driver of the U.S. beef market. In addition, position of the U.S. as one of the top exporters of beef globally maintains a constant demand, which augments the development of the market. According to Pasture.io-an online web platform-exports bring significant revenue in the U.S. and contribute to 15% of the production owing to high demands from Asia and several countries of North America. A key trend dominating the U.S. beef market currently is the reduction of environmental impact of its production. Stakeholders are making considerable investments in R&D to reduce the environmental effects of beef production, along with enhancing the health of cattle.
However, rise in infections among cattle, which are caused by pests such as New World Screwworm, is expected to reduce their slaughter and hamper the development of the market. According to the U.S. Department of Agriculture, projected reduction in slaughter has decreased the 2025 beef production forecast by 25.665 billion pounds, which was 615 million pounds in December 2024. Contrarily, the usage of health tech and wearables with robust sensors to monitor the health of cattle is projected to present remunerative opportunities for the U.S. beef market.
Segment Review
The U.S. beef market is segmented into distribution channel, product type, and cut type. On the basis of distribution channel, the market is divided into supermarket & hypermarket, retail store, wholesaler, e-commerce, and others. Depending on product type, it is classified into loin, chuck, round, brisket, rib, and others. As per cut type, it is categorized into ground beef, steaks, roasts, cubed, and others.
Key Findings
On the basis of distribution channel, the supermarket & hypermarket segment was the highest shareholder in 2023.
Depending on product type, the loin segment acquired a notable stake in the market in 2023.
As per cut type, the ground beef segment dominated the market in 2023.
Competition Analysis
The major players in the U.S. beef market include Tyson Foods, Inc., JBS USA Holdings, Inc., CARGILL MEAT SOLUTIONS CORPORATION, NATIONAL BEEF PACKING COMPANY LLC, Hormel Foods Corporation, Smithfield Foods, Inc., Greater Omaha Packing Co., Inc., American Foods Group, LLC, OSI Group, and Perdue Farms, Inc. These major players have adopted various key development strategies such as business expansion, new product launches, and partnerships to strengthen their foothold in the competitive market.
Additional benefits you will get with this purchase are:
- Quarterly Update and* (only available with a corporate license, on listed price)
- 5 additional Company Profile of client Choice pre- or Post-purchase, as a free update.
- Free Upcoming Version on the Purchase of Five and Enterprise User License.
- 16 analyst hours of support* (post-purchase, if you find additional data requirements upon review of the report, you may receive support amounting to 16 analyst hours to solve questions, and post-sale queries)
- 15% Free Customization* (in case the scope or segment of the report does not match your requirements, 15% is equivalent to 3 working days of free work, applicable once)
- Free data Pack on the Five and Enterprise User License. (Excel version of the report)
- Free Updated report if the report is 6-12 months old or older.
- 24-hour priority response*
- Free Industry updates and white papers.
Possible Customization with this report (with additional cost and timeline, please talk to the sales executive to know more)
- Additional company profiles with specific to client's interest
- Additional country or region analysis- market size and forecast
- Historic market data
Key Market Segments
By Distribution Channel
- Supermarket and Hypermarket
- Retail Store
- Wholesaler
- E commerce
- Others
By Product Type
- Loin
- Chuck
- Round
- Brisket
- Rib
- Others
By Cut Type
- Ground Beef
- Steaks
- Roasts
- Cubed
- Others
Key Market Players:
- Tyson Foods, Inc.
- JBS USA Holdings, Inc
- CARGILL MEAT SOLUTIONS CORPORATION
- NATIONAL BEEF PACKING COMPANY LLC
- Hormel Foods Corporation
- Smithfield Foods, Inc.
- greater omaha packing co., inc.
- American Foods Group, LLC
- OSI Group
- Perdue Farms, Inc.
TABLE OF CONTENTS
CHAPTER 1: INTRODUCTION
- 1.1. Report Description
- 1.2. Key Market Segments
- 1.3. Key Benefits
- 1.4. Research Methodology
- 1.4.1. Primary Research
- 1.4.2. Secondary Research
- 1.4.3. Analyst Tools and Models
CHAPTER 2: EXECUTIVE SUMMARY
- 2.1. CXO Perspective
CHAPTER 3: MARKET LANDSCAPE
- 3.1. Market Definition and Scope
- 3.2. Key Findings
- 3.2.1. Top Investment Pockets
- 3.2.2. Top Winning Strategies
- 3.3. Porter's Five Forces Analysis
- 3.3.1. Bargaining Power of Suppliers
- 3.3.2. Threat of New Entrants
- 3.3.3. Threat of Substitutes
- 3.3.4. Competitive Rivalry
- 3.3.5. Bargaining Power among Buyers
- 3.4. Market Dynamics
- 3.4.1. Drivers
- 3.4.2. Restraints
- 3.4.3. Opportunities
CHAPTER 4: U.S. BEEF MARKET, BY DISTRIBUTION CHANNEL
- 4.1. Market Overview
- 4.1.1 Market Size and Forecast, By Distribution Channel
- 4.2. Supermarket And Hypermarket
- 4.2.1. Key Market Trends, Growth Factors and Opportunities
- 4.3. Retail Store
- 4.3.1. Key Market Trends, Growth Factors and Opportunities
- 4.4. Wholesaler
- 4.4.1. Key Market Trends, Growth Factors and Opportunities
- 4.5. E Commerce
- 4.5.1. Key Market Trends, Growth Factors and Opportunities
- 4.6. Others
- 4.6.1. Key Market Trends, Growth Factors and Opportunities
CHAPTER 5: U.S. BEEF MARKET, BY PRODUCT TYPE
- 5.1. Market Overview
- 5.1.1 Market Size and Forecast, By Product Type
- 5.2. Loin
- 5.2.1. Key Market Trends, Growth Factors and Opportunities
- 5.3. Chuck
- 5.3.1. Key Market Trends, Growth Factors and Opportunities
- 5.4. Round
- 5.4.1. Key Market Trends, Growth Factors and Opportunities
- 5.5. Brisket
- 5.5.1. Key Market Trends, Growth Factors and Opportunities
- 5.6. Rib
- 5.6.1. Key Market Trends, Growth Factors and Opportunities
- 5.7. Others
- 5.7.1. Key Market Trends, Growth Factors and Opportunities
CHAPTER 6: U.S. BEEF MARKET, BY CUT TYPE
- 6.1. Market Overview
- 6.1.1 Market Size and Forecast, By Cut Type
- 6.2. Ground Beef
- 6.2.1. Key Market Trends, Growth Factors and Opportunities
- 6.3. Steaks
- 6.3.1. Key Market Trends, Growth Factors and Opportunities
- 6.4. Roasts
- 6.4.1. Key Market Trends, Growth Factors and Opportunities
- 6.5. Cubed
- 6.5.1. Key Market Trends, Growth Factors and Opportunities
- 6.6. Others
- 6.6.1. Key Market Trends, Growth Factors and Opportunities
CHAPTER 7: COMPETITIVE LANDSCAPE
- 7.1. Introduction
- 7.2. Top Winning Strategies
- 7.3. Product Mapping Of Top 10 Player
- 7.4. Competitive Dashboard
- 7.5. Competitive Heatmap
- 7.6. Top Player Positioning,2022
CHAPTER 8: COMPANY PROFILES
- 8.1. Tyson Foods, Inc.
- 8.1.1. Company Overview
- 8.1.2. Key Executives
- 8.1.3. Company Snapshot
- 8.1.4. Operating Business Segments
- 8.1.5. Product Portfolio
- 8.1.6. Business Performance
- 8.1.7. Key Strategic Moves and Developments
- 8.2. JBS USA Holdings, Inc
- 8.2.1. Company Overview
- 8.2.2. Key Executives
- 8.2.3. Company Snapshot
- 8.2.4. Operating Business Segments
- 8.2.5. Product Portfolio
- 8.2.6. Business Performance
- 8.2.7. Key Strategic Moves and Developments
- 8.3. CARGILL MEAT SOLUTIONS CORPORATION
- 8.3.1. Company Overview
- 8.3.2. Key Executives
- 8.3.3. Company Snapshot
- 8.3.4. Operating Business Segments
- 8.3.5. Product Portfolio
- 8.3.6. Business Performance
- 8.3.7. Key Strategic Moves and Developments
- 8.4. NATIONAL BEEF PACKING COMPANY LLC
- 8.4.1. Company Overview
- 8.4.2. Key Executives
- 8.4.3. Company Snapshot
- 8.4.4. Operating Business Segments
- 8.4.5. Product Portfolio
- 8.4.6. Business Performance
- 8.4.7. Key Strategic Moves and Developments
- 8.5. Hormel Foods Corporation
- 8.5.1. Company Overview
- 8.5.2. Key Executives
- 8.5.3. Company Snapshot
- 8.5.4. Operating Business Segments
- 8.5.5. Product Portfolio
- 8.5.6. Business Performance
- 8.5.7. Key Strategic Moves and Developments
- 8.6. Smithfield Foods, Inc.
- 8.6.1. Company Overview
- 8.6.2. Key Executives
- 8.6.3. Company Snapshot
- 8.6.4. Operating Business Segments
- 8.6.5. Product Portfolio
- 8.6.6. Business Performance
- 8.6.7. Key Strategic Moves and Developments
- 8.7. Greater Omaha Packing Co., Inc.
- 8.7.1. Company Overview
- 8.7.2. Key Executives
- 8.7.3. Company Snapshot
- 8.7.4. Operating Business Segments
- 8.7.5. Product Portfolio
- 8.7.6. Business Performance
- 8.7.7. Key Strategic Moves and Developments
- 8.8. American Foods Group, LLC
- 8.8.1. Company Overview
- 8.8.2. Key Executives
- 8.8.3. Company Snapshot
- 8.8.4. Operating Business Segments
- 8.8.5. Product Portfolio
- 8.8.6. Business Performance
- 8.8.7. Key Strategic Moves and Developments
- 8.9. OSI Group
- 8.9.1. Company Overview
- 8.9.2. Key Executives
- 8.9.3. Company Snapshot
- 8.9.4. Operating Business Segments
- 8.9.5. Product Portfolio
- 8.9.6. Business Performance
- 8.9.7. Key Strategic Moves and Developments
- 8.10. Perdue Farms, Inc.
- 8.10.1. Company Overview
- 8.10.2. Key Executives
- 8.10.3. Company Snapshot
- 8.10.4. Operating Business Segments
- 8.10.5. Product Portfolio
- 8.10.6. Business Performance
- 8.10.7. Key Strategic Moves and Developments
- TABLE 1. U.S. BEEF MARKET, BY DISTRIBUTION CHANNEL, 2023 - 2032 ($MILLION)
- TABLE 2. U.S. BEEF MARKET, BY PRODUCT TYPE, 2023 - 2032 ($MILLION)
- TABLE 3. U.S. BEEF MARKET, BY CUT TYPE, 2023 - 2032 ($MILLION)
- TABLE 4. TYSON FOODS, INC.: KEY EXECUTIVES
- TABLE 5. TYSON FOODS, INC.: COMPANY SNAPSHOT
- TABLE 6. TYSON FOODS, INC.: OPERATING SEGMENTS
- TABLE 7. TYSON FOODS, INC.: PRODUCT PORTFOLIO
- TABLE 8. TYSON FOODS, INC.: KEY STRATEGIC MOVES AND DEVELOPMENTS
- TABLE 9. JBS USA HOLDINGS, INC: KEY EXECUTIVES
- TABLE 10. JBS USA HOLDINGS, INC: COMPANY SNAPSHOT
- TABLE 11. JBS USA HOLDINGS, INC: OPERATING SEGMENTS
- TABLE 12. JBS USA HOLDINGS, INC: PRODUCT PORTFOLIO
- TABLE 13. JBS USA HOLDINGS, INC: KEY STRATEGIC MOVES AND DEVELOPMENTS
- TABLE 14. CARGILL MEAT SOLUTIONS CORPORATION: KEY EXECUTIVES
- TABLE 15. CARGILL MEAT SOLUTIONS CORPORATION: COMPANY SNAPSHOT
- TABLE 16. CARGILL MEAT SOLUTIONS CORPORATION: OPERATING SEGMENTS
- TABLE 17. CARGILL MEAT SOLUTIONS CORPORATION: PRODUCT PORTFOLIO
- TABLE 18. CARGILL MEAT SOLUTIONS CORPORATION: KEY STRATEGIC MOVES AND DEVELOPMENTS
- TABLE 19. NATIONAL BEEF PACKING COMPANY LLC: KEY EXECUTIVES
- TABLE 20. NATIONAL BEEF PACKING COMPANY LLC: COMPANY SNAPSHOT
- TABLE 21. NATIONAL BEEF PACKING COMPANY LLC: OPERATING SEGMENTS
- TABLE 22. NATIONAL BEEF PACKING COMPANY LLC: PRODUCT PORTFOLIO
- TABLE 23. NATIONAL BEEF PACKING COMPANY LLC: KEY STRATEGIC MOVES AND DEVELOPMENTS
- TABLE 24. HORMEL FOODS CORPORATION: KEY EXECUTIVES
- TABLE 25. HORMEL FOODS CORPORATION: COMPANY SNAPSHOT
- TABLE 26. HORMEL FOODS CORPORATION: OPERATING SEGMENTS
- TABLE 27. HORMEL FOODS CORPORATION: PRODUCT PORTFOLIO
- TABLE 28. HORMEL FOODS CORPORATION: KEY STRATEGIC MOVES AND DEVELOPMENTS
- TABLE 29. SMITHFIELD FOODS, INC.: KEY EXECUTIVES
- TABLE 30. SMITHFIELD FOODS, INC.: COMPANY SNAPSHOT
- TABLE 31. SMITHFIELD FOODS, INC.: OPERATING SEGMENTS
- TABLE 32. SMITHFIELD FOODS, INC.: PRODUCT PORTFOLIO
- TABLE 33. SMITHFIELD FOODS, INC.: KEY STRATEGIC MOVES AND DEVELOPMENTS
- TABLE 34. GREATER OMAHA PACKING CO., INC.: KEY EXECUTIVES
- TABLE 35. GREATER OMAHA PACKING CO., INC.: COMPANY SNAPSHOT
- TABLE 36. GREATER OMAHA PACKING CO., INC.: OPERATING SEGMENTS
- TABLE 37. GREATER OMAHA PACKING CO., INC.: PRODUCT PORTFOLIO
- TABLE 38. GREATER OMAHA PACKING CO., INC.: KEY STRATEGIC MOVES AND DEVELOPMENTS
- TABLE 39. AMERICAN FOODS GROUP, LLC: KEY EXECUTIVES
- TABLE 40. AMERICAN FOODS GROUP, LLC: COMPANY SNAPSHOT
- TABLE 41. AMERICAN FOODS GROUP, LLC: OPERATING SEGMENTS
- TABLE 42. AMERICAN FOODS GROUP, LLC: PRODUCT PORTFOLIO
- TABLE 43. AMERICAN FOODS GROUP, LLC: KEY STRATEGIC MOVES AND DEVELOPMENTS
- TABLE 44. OSI GROUP: KEY EXECUTIVES
- TABLE 45. OSI GROUP: COMPANY SNAPSHOT
- TABLE 46. OSI GROUP: OPERATING SEGMENTS
- TABLE 47. OSI GROUP: PRODUCT PORTFOLIO
- TABLE 48. OSI GROUP: KEY STRATEGIC MOVES AND DEVELOPMENTS
- TABLE 49. PERDUE FARMS, INC.: KEY EXECUTIVES
- TABLE 50. PERDUE FARMS, INC.: COMPANY SNAPSHOT
- TABLE 51. PERDUE FARMS, INC.: OPERATING SEGMENTS
- TABLE 52. PERDUE FARMS, INC.: PRODUCT PORTFOLIO
- TABLE 53. PERDUE FARMS, INC.: KEY STRATEGIC MOVES AND DEVELOPMENTS
- FIGURE 1. U.S. BEEF MARKET,2023 - 2032
- FIGURE 2. SEGMENTATION OF U.S. BEEF MARKET,2023 - 2032
- FIGURE 3. TOP INVESTMENT POCKET IN U.S. BEEF MARKET,2023 - 2032
- FIGURE 4. MODERATE BARGAINING POWER OF BUYERS
- FIGURE 5. MODERATE BARGAINING POWER OF SUPPLIERS
- FIGURE 6. MODERATE THREAT OF NEW ENTRANTS
- FIGURE 7. LOW THREAT OF SUBSTITUTION
- FIGURE 8. HIGH COMPETITIVE RIVALRY
- FIGURE 9. OPPORTUNITIES, RESTRAINTS AND DRIVERS: U.S. BEEF MARKET
- FIGURE 10. U.S. BEEF MARKET , BY DISTRIBUTION CHANNEL,2023 - 2032 ($MILLION)
- FIGURE 11. U.S. BEEF MARKET , BY PRODUCT TYPE,2023 - 2032 ($MILLION)
- FIGURE 12. U.S. BEEF MARKET , BY CUT TYPE,2023 - 2032 ($MILLION)
- FIGURE 13. TOP WINNING STRATEGIES, BY YEAR, 2021-2023*
- FIGURE 14. TOP WINNING STRATEGIES, BY DEVELOPMENT, 2021-2023*
- FIGURE 15. TOP WINNING STRATEGIES, BY COMPANY, 2021-2023*
- FIGURE 16. PRODUCT MAPPING OF TOP 10 PLAYERS
- FIGURE 17. COMPETITIVE DASHBOARD
- FIGURE 18. COMPETITIVE HEATMAP: U.S. BEEF MARKET
- FIGURE 19. TOP PLAYER POSITIONING,2022
- FIGURE 20. TYSON FOODS, INC.: NET SALES, 2021-2023 ($MILLION)
- FIGURE 21. TYSON FOODS, INC.: REVENUE SHARE, BY SEGMENT, 2022 (%)
- FIGURE 22. TYSON FOODS, INC.: REVENUE SHARE, BY REGION, 2023 (%)
- FIGURE 23. JBS USA HOLDINGS, INC: NET SALES, 2021-2023 ($MILLION)
- FIGURE 24. JBS USA HOLDINGS, INC: REVENUE SHARE, BY SEGMENT, 2022 (%)
- FIGURE 25. JBS USA HOLDINGS, INC: REVENUE SHARE, BY REGION, 2023 (%)
- FIGURE 26. CARGILL MEAT SOLUTIONS CORPORATION: NET SALES, 2021-2023 ($MILLION)
- FIGURE 27. CARGILL MEAT SOLUTIONS CORPORATION: REVENUE SHARE, BY SEGMENT, 2022 (%)
- FIGURE 28. CARGILL MEAT SOLUTIONS CORPORATION: REVENUE SHARE, BY REGION, 2023 (%)
- FIGURE 29. NATIONAL BEEF PACKING COMPANY LLC: NET SALES, 2021-2023 ($MILLION)
- FIGURE 30. NATIONAL BEEF PACKING COMPANY LLC: REVENUE SHARE, BY SEGMENT, 2022 (%)
- FIGURE 31. NATIONAL BEEF PACKING COMPANY LLC: REVENUE SHARE, BY REGION, 2023 (%)
- FIGURE 32. HORMEL FOODS CORPORATION: NET SALES, 2021-2023 ($MILLION)
- FIGURE 33. HORMEL FOODS CORPORATION: REVENUE SHARE, BY SEGMENT, 2022 (%)
- FIGURE 34. HORMEL FOODS CORPORATION: REVENUE SHARE, BY REGION, 2023 (%)
- FIGURE 35. SMITHFIELD FOODS, INC.: NET SALES, 2021-2023 ($MILLION)
- FIGURE 36. SMITHFIELD FOODS, INC.: REVENUE SHARE, BY SEGMENT, 2022 (%)
- FIGURE 37. SMITHFIELD FOODS, INC.: REVENUE SHARE, BY REGION, 2023 (%)
- FIGURE 38. GREATER OMAHA PACKING CO., INC.: NET SALES, 2021-2023 ($MILLION)
- FIGURE 39. GREATER OMAHA PACKING CO., INC.: REVENUE SHARE, BY SEGMENT, 2022 (%)
- FIGURE 40. GREATER OMAHA PACKING CO., INC.: REVENUE SHARE, BY REGION, 2023 (%)
- FIGURE 41. AMERICAN FOODS GROUP, LLC: NET SALES, 2021-2023 ($MILLION)
- FIGURE 42. AMERICAN FOODS GROUP, LLC: REVENUE SHARE, BY SEGMENT, 2022 (%)
- FIGURE 43. AMERICAN FOODS GROUP, LLC: REVENUE SHARE, BY REGION, 2023 (%)
- FIGURE 44. OSI GROUP: NET SALES, 2021-2023 ($MILLION)
- FIGURE 45. OSI GROUP: REVENUE SHARE, BY SEGMENT, 2022 (%)
- FIGURE 46. OSI GROUP: REVENUE SHARE, BY REGION, 2023 (%)
- FIGURE 47. PERDUE FARMS, INC.: NET SALES, 2021-2023 ($MILLION)
- FIGURE 48. PERDUE FARMS, INC.: REVENUE SHARE, BY SEGMENT, 2022 (%)
- FIGURE 49. PERDUE FARMS, INC.: REVENUE SHARE, BY REGION, 2023 (%)

