
PUBLISHER: Allied Market Research | PRODUCT CODE: 1641771

PUBLISHER: Allied Market Research | PRODUCT CODE: 1641771
UK Beef Market By Distribution Channel , By Product Type By Cut Type : Opportunity Analysis and Industry Forecast, 2023-2032
UK Beef Market
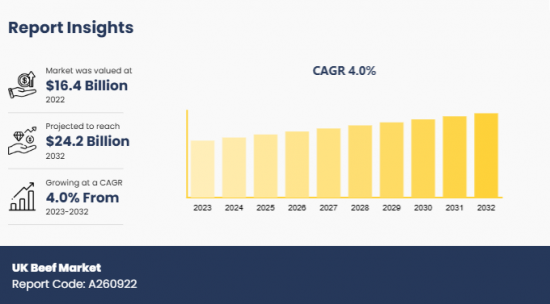
The UK beef market was valued at $16.4 billion in 2022 and is projected to reach $24.2 billion by 2032, growing at a CAGR of 4% from 2023 to 2032.
Beef is a variety of red meat that is obtained from domesticated cattle. There are different types of beef depending on their quality grades, cuts, and preparation methods. The nutritional profile of beef includes protein, vitamin B, iron, zinc, and fat. Due to its rich dietary value, versatility, and flavor, beef is a staple in various traditional British dishes such as roast beef, beef Wellington, and cottage pie.
Increase in the number of fast-food outlets and quick-service restaurants has fueled the requirement for beef in the UK, thereby propelling the development of the market. In addition, as individuals have shifted toward a fast-paced lifestyle, surge in demand for ready-to-cook pre-packed kits and value-added beef products such as marinated cuts is augmenting the growth of the market. Furthermore, as the suppliers are focusing on sustainable practices to provide "grass-fed" labeled beef to consumers, the market growth is being driven significantly. An emerging trend gaining prominence in the UK beef market in recent times is the production of lab-grown beef. This is an innovative, sustainable, and ethical method of beef production, which is garnering traction from environmentally concerned and health-conscious consumers in the region.
However, exponential surge in the cost-of-living pressures among individuals in the UK has reduced the demand for beef in retail and takeaways, which is restraining the growth of the market. According to the Agriculture and Horticulture Development Board in the UK, total year-on-year beef volumes were low by 1% in 2023. Moreover, surge in the prevalence of cattle diseases such as foot-and-mouth disease and bovine spongiform encephalopathy has significantly impacted beef production, thereby hampering the market development. On the contrary, expansion in export deals and establishment of new trade agreements are anticipated to present lucrative opportunities for the UK beef market. The UK produces approximately 900,00 tons of beef every year, of which 148,000 tons are exported to other countries. The Agriculture and Horticulture Development Board predicts this volume to rise in the future, indicating a promising future for the market.
Segment Review
The UK beef market is segmented into distribution channel, product type, and cut type. On the basis of distribution channel, the market is divided into supermarket & hypermarket, retail store, wholesaler, e-commerce, and others. As per product type, it is classified into loin, chuck, round, brisket, rib, and others. Depending on cut type, it is categorized into ground beef, steaks, roasts, cubed, and others.
Key Findings
On the basis of distribution channel, the supermarket & hypermarket segment was the highest shareholder in 2023.
Depending on product type, the loin segment acquired a notable stake in the market in 2023.
As per cut type, the ground beef segment dominated the market in 2023.
Competition Analysis
The major players in the UK beef market include ABP Food Group, Dawn Meats Group, Tulip Ltd., Dunbia, Cargill, Oakham Meats, Scottish Beef, Meat and Livestock Australia (MLA), Dovecote Park Ltd., and Harrison & Hetherington. These major players have adopted various key development strategies such as business expansion, new product launches, and partnerships to strengthen their foothold in the competitive market.
Additional benefits you will get with this purchase are:
- Quarterly Update and* (only available with a corporate license, on listed price)
- 5 additional Company Profile of client Choice pre- or Post-purchase, as a free update.
- Free Upcoming Version on the Purchase of Five and Enterprise User License.
- 16 analyst hours of support* (post-purchase, if you find additional data requirements upon review of the report, you may receive support amounting to 16 analyst hours to solve questions, and post-sale queries)
- 15% Free Customization* (in case the scope or segment of the report does not match your requirements, 15% is equivalent to 3 working days of free work, applicable once)
- Free data Pack on the Five and Enterprise User License. (Excel version of the report)
- Free Updated report if the report is 6-12 months old or older.
- 24-hour priority response*
- Free Industry updates and white papers.
Possible Customization with this report (with additional cost and timeline, please talk to the sales executive to know more)
- Additional company profiles with specific to client's interest
- Additional country or region analysis- market size and forecast
- Historic market data
Key Market Segments
By Distribution Channel
- Supermarket and Hypermarket
- Retail Store
- Wholesaler
- E commerce
- Others
By Product Type
- Loin
- Chuck
- Round
- Brisket
- Rib
- Others
By Cut Type
- Ground Beef
- Steaks
- Roasts
- Cubed
- Others
Key Market Players:
- abp food group
- dawn meats group
- Tulip Ltd.
- Dunbia
- Cargill
- Oakham Meats
- Scottish Beef
- Meat and Livestock Australia (MLA)
- dovecote park ltd
- Harrison & Hetherington
TABLE OF CONTENTS
CHAPTER 1: INTRODUCTION
- 1.1. Report Description
- 1.2. Key Market Segments
- 1.3. Key Benefits
- 1.4. Research Methodology
- 1.4.1. Primary Research
- 1.4.2. Secondary Research
- 1.4.3. Analyst Tools and Models
CHAPTER 2: EXECUTIVE SUMMARY
- 2.1. CXO Perspective
CHAPTER 3: MARKET LANDSCAPE
- 3.1. Market Definition and Scope
- 3.2. Key Findings
- 3.2.1. Top Investment Pockets
- 3.2.2. Top Winning Strategies
- 3.3. Porter's Five Forces Analysis
- 3.3.1. Bargaining Power of Suppliers
- 3.3.2. Threat of New Entrants
- 3.3.3. Threat of Substitutes
- 3.3.4. Competitive Rivalry
- 3.3.5. Bargaining Power among Buyers
- 3.4. Market Dynamics
- 3.4.1. Drivers
- 3.4.2. Restraints
- 3.4.3. Opportunities
CHAPTER 4: UK BEEF MARKET, BY DISTRIBUTION CHANNEL
- 4.1. Market Overview
- 4.1.1 Market Size and Forecast, By Distribution Channel
- 4.2. Supermarket And Hypermarket
- 4.2.1. Key Market Trends, Growth Factors and Opportunities
- 4.3. Retail Store
- 4.3.1. Key Market Trends, Growth Factors and Opportunities
- 4.4. Wholesaler
- 4.4.1. Key Market Trends, Growth Factors and Opportunities
- 4.5. E Commerce
- 4.5.1. Key Market Trends, Growth Factors and Opportunities
- 4.6. Others
- 4.6.1. Key Market Trends, Growth Factors and Opportunities
CHAPTER 5: UK BEEF MARKET, BY PRODUCT TYPE
- 5.1. Market Overview
- 5.1.1 Market Size and Forecast, By Product Type
- 5.2. Loin
- 5.2.1. Key Market Trends, Growth Factors and Opportunities
- 5.3. Chuck
- 5.3.1. Key Market Trends, Growth Factors and Opportunities
- 5.4. Round
- 5.4.1. Key Market Trends, Growth Factors and Opportunities
- 5.5. Brisket
- 5.5.1. Key Market Trends, Growth Factors and Opportunities
- 5.6. Rib
- 5.6.1. Key Market Trends, Growth Factors and Opportunities
- 5.7. Others
- 5.7.1. Key Market Trends, Growth Factors and Opportunities
CHAPTER 6: UK BEEF MARKET, BY CUT TYPE
- 6.1. Market Overview
- 6.1.1 Market Size and Forecast, By Cut Type
- 6.2. Ground Beef
- 6.2.1. Key Market Trends, Growth Factors and Opportunities
- 6.3. Steaks
- 6.3.1. Key Market Trends, Growth Factors and Opportunities
- 6.4. Roasts
- 6.4.1. Key Market Trends, Growth Factors and Opportunities
- 6.5. Cubed
- 6.5.1. Key Market Trends, Growth Factors and Opportunities
- 6.6. Others
- 6.6.1. Key Market Trends, Growth Factors and Opportunities
CHAPTER 7: COMPETITIVE LANDSCAPE
- 7.1. Introduction
- 7.2. Top Winning Strategies
- 7.3. Product Mapping Of Top 10 Player
- 7.4. Competitive Dashboard
- 7.5. Competitive Heatmap
- 7.6. Top Player Positioning,2022
CHAPTER 8: COMPANY PROFILES
- 8.1. Abp Food Group
- 8.1.1. Company Overview
- 8.1.2. Key Executives
- 8.1.3. Company Snapshot
- 8.1.4. Operating Business Segments
- 8.1.5. Product Portfolio
- 8.1.6. Business Performance
- 8.1.7. Key Strategic Moves and Developments
- 8.2. Dawn Meats Group
- 8.2.1. Company Overview
- 8.2.2. Key Executives
- 8.2.3. Company Snapshot
- 8.2.4. Operating Business Segments
- 8.2.5. Product Portfolio
- 8.2.6. Business Performance
- 8.2.7. Key Strategic Moves and Developments
- 8.3. Tulip Ltd.
- 8.3.1. Company Overview
- 8.3.2. Key Executives
- 8.3.3. Company Snapshot
- 8.3.4. Operating Business Segments
- 8.3.5. Product Portfolio
- 8.3.6. Business Performance
- 8.3.7. Key Strategic Moves and Developments
- 8.4. Dunbia
- 8.4.1. Company Overview
- 8.4.2. Key Executives
- 8.4.3. Company Snapshot
- 8.4.4. Operating Business Segments
- 8.4.5. Product Portfolio
- 8.4.6. Business Performance
- 8.4.7. Key Strategic Moves and Developments
- 8.5. Cargill
- 8.5.1. Company Overview
- 8.5.2. Key Executives
- 8.5.3. Company Snapshot
- 8.5.4. Operating Business Segments
- 8.5.5. Product Portfolio
- 8.5.6. Business Performance
- 8.5.7. Key Strategic Moves and Developments
- 8.6. Oakham Meats
- 8.6.1. Company Overview
- 8.6.2. Key Executives
- 8.6.3. Company Snapshot
- 8.6.4. Operating Business Segments
- 8.6.5. Product Portfolio
- 8.6.6. Business Performance
- 8.6.7. Key Strategic Moves and Developments
- 8.7. Scottish Beef
- 8.7.1. Company Overview
- 8.7.2. Key Executives
- 8.7.3. Company Snapshot
- 8.7.4. Operating Business Segments
- 8.7.5. Product Portfolio
- 8.7.6. Business Performance
- 8.7.7. Key Strategic Moves and Developments
- 8.8. Meat And Livestock Australia (MLA)
- 8.8.1. Company Overview
- 8.8.2. Key Executives
- 8.8.3. Company Snapshot
- 8.8.4. Operating Business Segments
- 8.8.5. Product Portfolio
- 8.8.6. Business Performance
- 8.8.7. Key Strategic Moves and Developments
- 8.9. Dovecote Park Ltd
- 8.9.1. Company Overview
- 8.9.2. Key Executives
- 8.9.3. Company Snapshot
- 8.9.4. Operating Business Segments
- 8.9.5. Product Portfolio
- 8.9.6. Business Performance
- 8.9.7. Key Strategic Moves and Developments
- 8.10. Harrison And Hetherington
- 8.10.1. Company Overview
- 8.10.2. Key Executives
- 8.10.3. Company Snapshot
- 8.10.4. Operating Business Segments
- 8.10.5. Product Portfolio
- 8.10.6. Business Performance
- 8.10.7. Key Strategic Moves and Developments
- TABLE 1. UK BEEF MARKET, BY DISTRIBUTION CHANNEL, 2023 - 2032 ($MILLION)
- TABLE 2. UK BEEF MARKET, BY PRODUCT TYPE, 2023 - 2032 ($MILLION)
- TABLE 3. UK BEEF MARKET, BY CUT TYPE, 2023 - 2032 ($MILLION)
- TABLE 4. ABP FOOD GROUP: KEY EXECUTIVES
- TABLE 5. ABP FOOD GROUP: COMPANY SNAPSHOT
- TABLE 6. ABP FOOD GROUP: OPERATING SEGMENTS
- TABLE 7. ABP FOOD GROUP: PRODUCT PORTFOLIO
- TABLE 8. ABP FOOD GROUP: KEY STRATEGIC MOVES AND DEVELOPMENTS
- TABLE 9. DAWN MEATS GROUP: KEY EXECUTIVES
- TABLE 10. DAWN MEATS GROUP: COMPANY SNAPSHOT
- TABLE 11. DAWN MEATS GROUP: OPERATING SEGMENTS
- TABLE 12. DAWN MEATS GROUP: PRODUCT PORTFOLIO
- TABLE 13. DAWN MEATS GROUP: KEY STRATEGIC MOVES AND DEVELOPMENTS
- TABLE 14. TULIP LTD.: KEY EXECUTIVES
- TABLE 15. TULIP LTD.: COMPANY SNAPSHOT
- TABLE 16. TULIP LTD.: OPERATING SEGMENTS
- TABLE 17. TULIP LTD.: PRODUCT PORTFOLIO
- TABLE 18. TULIP LTD.: KEY STRATEGIC MOVES AND DEVELOPMENTS
- TABLE 19. DUNBIA: KEY EXECUTIVES
- TABLE 20. DUNBIA: COMPANY SNAPSHOT
- TABLE 21. DUNBIA: OPERATING SEGMENTS
- TABLE 22. DUNBIA: PRODUCT PORTFOLIO
- TABLE 23. DUNBIA: KEY STRATEGIC MOVES AND DEVELOPMENTS
- TABLE 24. CARGILL: KEY EXECUTIVES
- TABLE 25. CARGILL: COMPANY SNAPSHOT
- TABLE 26. CARGILL: OPERATING SEGMENTS
- TABLE 27. CARGILL: PRODUCT PORTFOLIO
- TABLE 28. CARGILL: KEY STRATEGIC MOVES AND DEVELOPMENTS
- TABLE 29. OAKHAM MEATS: KEY EXECUTIVES
- TABLE 30. OAKHAM MEATS: COMPANY SNAPSHOT
- TABLE 31. OAKHAM MEATS: OPERATING SEGMENTS
- TABLE 32. OAKHAM MEATS: PRODUCT PORTFOLIO
- TABLE 33. OAKHAM MEATS: KEY STRATEGIC MOVES AND DEVELOPMENTS
- TABLE 34. SCOTTISH BEEF: KEY EXECUTIVES
- TABLE 35. SCOTTISH BEEF: COMPANY SNAPSHOT
- TABLE 36. SCOTTISH BEEF: OPERATING SEGMENTS
- TABLE 37. SCOTTISH BEEF: PRODUCT PORTFOLIO
- TABLE 38. SCOTTISH BEEF: KEY STRATEGIC MOVES AND DEVELOPMENTS
- TABLE 39. MEAT AND LIVESTOCK AUSTRALIA (MLA): KEY EXECUTIVES
- TABLE 40. MEAT AND LIVESTOCK AUSTRALIA (MLA): COMPANY SNAPSHOT
- TABLE 41. MEAT AND LIVESTOCK AUSTRALIA (MLA): OPERATING SEGMENTS
- TABLE 42. MEAT AND LIVESTOCK AUSTRALIA (MLA): PRODUCT PORTFOLIO
- TABLE 43. MEAT AND LIVESTOCK AUSTRALIA (MLA): KEY STRATEGIC MOVES AND DEVELOPMENTS
- TABLE 44. DOVECOTE PARK LTD: KEY EXECUTIVES
- TABLE 45. DOVECOTE PARK LTD: COMPANY SNAPSHOT
- TABLE 46. DOVECOTE PARK LTD: OPERATING SEGMENTS
- TABLE 47. DOVECOTE PARK LTD: PRODUCT PORTFOLIO
- TABLE 48. DOVECOTE PARK LTD: KEY STRATEGIC MOVES AND DEVELOPMENTS
- TABLE 49. HARRISON AND HETHERINGTON: KEY EXECUTIVES
- TABLE 50. HARRISON AND HETHERINGTON: COMPANY SNAPSHOT
- TABLE 51. HARRISON AND HETHERINGTON: OPERATING SEGMENTS
- TABLE 52. HARRISON AND HETHERINGTON: PRODUCT PORTFOLIO
- TABLE 53. HARRISON AND HETHERINGTON: KEY STRATEGIC MOVES AND DEVELOPMENTS
- FIGURE 1. UK BEEF MARKET,2023 - 2032
- FIGURE 2. SEGMENTATION OF UK BEEF MARKET,2023 - 2032
- FIGURE 3. TOP INVESTMENT POCKET IN UK BEEF MARKET,2023 - 2032
- FIGURE 4. MODERATE BARGAINING POWER OF BUYERS
- FIGURE 5. MODERATE BARGAINING POWER OF SUPPLIERS
- FIGURE 6. MODERATE THREAT OF NEW ENTRANTS
- FIGURE 7. LOW THREAT OF SUBSTITUTION
- FIGURE 8. HIGH COMPETITIVE RIVALRY
- FIGURE 9. OPPORTUNITIES, RESTRAINTS AND DRIVERS: UK BEEF MARKET
- FIGURE 10. UK BEEF MARKET , BY DISTRIBUTION CHANNEL,2023 - 2032 ($MILLION)
- FIGURE 11. UK BEEF MARKET , BY PRODUCT TYPE,2023 - 2032 ($MILLION)
- FIGURE 12. UK BEEF MARKET , BY CUT TYPE,2023 - 2032 ($MILLION)
- FIGURE 13. TOP WINNING STRATEGIES, BY YEAR, 2021-2023*
- FIGURE 14. TOP WINNING STRATEGIES, BY DEVELOPMENT, 2021-2023*
- FIGURE 15. TOP WINNING STRATEGIES, BY COMPANY, 2021-2023*
- FIGURE 16. PRODUCT MAPPING OF TOP 10 PLAYERS
- FIGURE 17. COMPETITIVE DASHBOARD
- FIGURE 18. COMPETITIVE HEATMAP: UK BEEF MARKET
- FIGURE 19. TOP PLAYER POSITIONING,2022
- FIGURE 20. ABP FOOD GROUP: NET SALES, 2021-2023 ($MILLION)
- FIGURE 21. ABP FOOD GROUP: REVENUE SHARE, BY SEGMENT, 2022 (%)
- FIGURE 22. ABP FOOD GROUP: REVENUE SHARE, BY REGION, 2023 (%)
- FIGURE 23. DAWN MEATS GROUP: NET SALES, 2021-2023 ($MILLION)
- FIGURE 24. DAWN MEATS GROUP: REVENUE SHARE, BY SEGMENT, 2022 (%)
- FIGURE 25. DAWN MEATS GROUP: REVENUE SHARE, BY REGION, 2023 (%)
- FIGURE 26. TULIP LTD.: NET SALES, 2021-2023 ($MILLION)
- FIGURE 27. TULIP LTD.: REVENUE SHARE, BY SEGMENT, 2022 (%)
- FIGURE 28. TULIP LTD.: REVENUE SHARE, BY REGION, 2023 (%)
- FIGURE 29. DUNBIA: NET SALES, 2021-2023 ($MILLION)
- FIGURE 30. DUNBIA: REVENUE SHARE, BY SEGMENT, 2022 (%)
- FIGURE 31. DUNBIA: REVENUE SHARE, BY REGION, 2023 (%)
- FIGURE 32. CARGILL: NET SALES, 2021-2023 ($MILLION)
- FIGURE 33. CARGILL: REVENUE SHARE, BY SEGMENT, 2022 (%)
- FIGURE 34. CARGILL: REVENUE SHARE, BY REGION, 2023 (%)
- FIGURE 35. OAKHAM MEATS: NET SALES, 2021-2023 ($MILLION)
- FIGURE 36. OAKHAM MEATS: REVENUE SHARE, BY SEGMENT, 2022 (%)
- FIGURE 37. OAKHAM MEATS: REVENUE SHARE, BY REGION, 2023 (%)
- FIGURE 38. SCOTTISH BEEF: NET SALES, 2021-2023 ($MILLION)
- FIGURE 39. SCOTTISH BEEF: REVENUE SHARE, BY SEGMENT, 2022 (%)
- FIGURE 40. SCOTTISH BEEF: REVENUE SHARE, BY REGION, 2023 (%)
- FIGURE 41. MEAT AND LIVESTOCK AUSTRALIA (MLA): NET SALES, 2021-2023 ($MILLION)
- FIGURE 42. MEAT AND LIVESTOCK AUSTRALIA (MLA): REVENUE SHARE, BY SEGMENT, 2022 (%)
- FIGURE 43. MEAT AND LIVESTOCK AUSTRALIA (MLA): REVENUE SHARE, BY REGION, 2023 (%)
- FIGURE 44. DOVECOTE PARK LTD: NET SALES, 2021-2023 ($MILLION)
- FIGURE 45. DOVECOTE PARK LTD: REVENUE SHARE, BY SEGMENT, 2022 (%)
- FIGURE 46. DOVECOTE PARK LTD: REVENUE SHARE, BY REGION, 2023 (%)
- FIGURE 47. HARRISON AND HETHERINGTON: NET SALES, 2021-2023 ($MILLION)
- FIGURE 48. HARRISON AND HETHERINGTON: REVENUE SHARE, BY SEGMENT, 2022 (%)
- FIGURE 49. HARRISON AND HETHERINGTON: REVENUE SHARE, BY REGION, 2023 (%)

