
PUBLISHER: Global Market Insights Inc. | PRODUCT CODE: 1699390

PUBLISHER: Global Market Insights Inc. | PRODUCT CODE: 1699390
Luxury Furniture Market Opportunity, Growth Drivers, Industry Trend Analysis, and Forecast 2025-2034
The Global Luxury Furniture Market was valued at USD 24.9 billion in 2024 and is projected to grow at a CAGR of 4.6% from 2025 to 2034. Rising disposable incomes, evolving consumer preferences, and an increasing focus on home improvement are key factors driving the market forward. With urbanization accelerating worldwide, particularly in developing regions, demand for high-end furniture continues to rise as consumers seek premium designs for upscale living spaces. The expansion of the global economy is fueling spending on high-quality furniture, with luxury interior design services further boosting sales. Consumers in established and emerging markets alike are prioritizing exclusivity and craftsmanship, making luxury furniture a preferred choice.
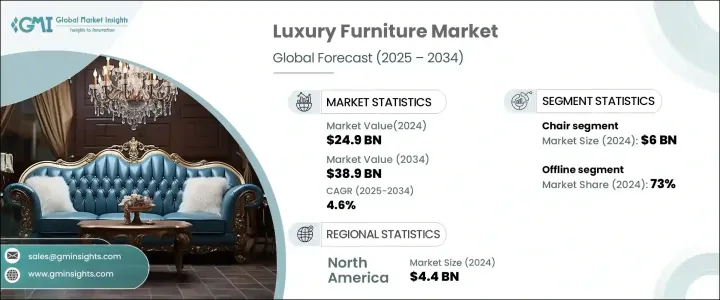
The market is segmented by type into tables, chairs, sofas & lounges, kitchen furniture, lighting, interior accessories, beds, and others. The chair segment led the market in 2024, generating USD 6 billion in revenue. The lighting category is expected to expand at a CAGR of approximately 4.8% from 2025 to 2034. Luxury furniture trends emphasize ergonomic and aesthetically appealing chairs, particularly in office and lounge settings. Consumers seek designs that seamlessly combine comfort with elegance. Sustainable materials, including reclaimed wood, recycled metals, and eco-friendly textiles, are gaining traction as brands introduce environmentally responsible collections.
| Market Scope | |
|---|---|
| Start Year | 2024 |
| Forecast Year | 2025-2034 |
| Start Value | $24.9 Billion |
| Forecast Value | $38.9 Billion |
| CAGR | 4.6% |
Tables made from premium natural materials such as walnut, oak, and marble are in high demand, offering a timeless and sophisticated appeal. The luxury bed segment continues to grow, with customers favoring high-end mattresses that enhance sleep quality and bed frames crafted from solid wood with opulent upholstery options like velvet and leather. The market is also experiencing a shift toward bespoke designs, reflecting individual preferences and the need for exclusivity in home interiors.
By distribution channel, the market is divided into online and offline sales. Offline retail accounted for 73% of the market share in 2024, as high-end showrooms, luxury furniture stores, and department stores provide an immersive shopping experience. Customers prefer the ability to see, touch, and test furniture before making a purchase, especially for high-value items. Upscale retail locations also offer personalized services, including professional design consultations and customized furniture solutions.
North America holds a significant portion of the luxury furniture market, with the United States generating approximately USD 4.4 billion in revenue in 2024, representing 79% of the regional market. The growing inclination toward superior craftsmanship and high-quality furnishings is driving sales. Increased investments in luxury residential spaces further contribute to market expansion. As more high-end homes enter the real estate sector, demand for exclusive and designer furniture continues to rise, solidifying the market's growth trajectory.
Table of Contents
Chapter 1 Methodology & Scope
- 1.1 Market scope & definitions
- 1.2 Base estimates & calculations
- 1.3 Forecast calculations.
- 1.4 Data sources
- 1.4.1 Primary
- 1.4.2 Secondary
- 1.4.2.1 Paid sources
- 1.4.2.2 Public sources
Chapter 2 Executive Summary
- 2.1 Industry synopsis, 2021-2034
Chapter 3 Industry Insights
- 3.1 Industry ecosystem analysis
- 3.1.1 Factor affecting the value chain.
- 3.1.2 Profit margin analysis.
- 3.1.3 Disruptions
- 3.1.4 Future outlook
- 3.2 Supplier landscape
- 3.3 Key news & initiatives
- 3.4 Regulatory landscape
- 3.5 Impact forces
- 3.5.1 Growth drivers
- 3.5.1.1 Rising construction activities
- 3.5.1.2 Increasing home décor and home renovation projects
- 3.5.2 Industry pitfalls & challenges
- 3.5.2.1 High development and production costs
- 3.5.2.2 Changing consumer preferences
- 3.5.1 Growth drivers
- 3.6 Growth potential analysis
- 3.7 Porter's analysis
- 3.8 PESTEL analysis
Chapter 4 Competitive Landscape, 2024
- 4.1 Introduction
- 4.2 Company market share analysis
- 4.3 Competitive positioning matrix
- 4.4 Strategic outlook matrix
Chapter 5 Market Estimates & Forecast, By Type, 2021-2034 (USD Billion) (Thousand Units)
- 5.1 Key trends
- 5.2 Table
- 5.3 Chair
- 5.4 Sofas & Lounges
- 5.5 Kitchen
- 5.6 Lightening
- 5.7 Interior accessories
- 5.8 Beds
- 5.9 Others
Chapter 6 Market Estimates & Forecast, By End Use, 2021-2034 (USD Billion) (Thousand Units)
- 6.1 Key trends
- 6.2 Residential
- 6.3 Commercial
Chapter 7 Market Estimates & Forecast, By Distribution Channel, 2021-2034 (USD Billion) (Thousand Units)
- 7.1 Key trends
- 7.2 Online
- 7.3 Offline
Chapter 8 Market Estimates & Forecast, By Region, 2021-2034 (USD Billion) (Thousand Units)
- 8.1 Key trends
- 8.2 North America
- 8.2.1 U.S.
- 8.2.2 Canada
- 8.3 Europe
- 8.3.1 UK
- 8.3.2 Germany
- 8.3.3 France
- 8.3.4 Italy
- 8.3.5 Spain
- 8.3.6 Russia
- 8.4 Asia Pacific
- 8.4.1 China
- 8.4.2 India
- 8.4.3 Japan
- 8.4.4 South Korea
- 8.4.5 Australia
- 8.5 Latin America
- 8.5.1 Brazil
- 8.5.2 Mexico
- 8.6 MEA
- 8.6.1 UAE
- 8.6.2 Saudi Arabia
- 8.6.3 South Africa
Chapter 9 Company Profiles
- 9.1 American Signature
- 9.2 Artek
- 9.3 Ashley Furniture
- 9.4 Boca do Lobo
- 9.5 Cassina
- 9.6 Herman Miller
- 9.7 HNI Corporation
- 9.8 Knoll
- 9.9 La-Z-Boy
- 9.10 Louis Poulsen
- 9.11 Roche Bobois
- 9.12 Verpan
- 9.13 Versace Home
- 9.14 Vibia
- 9.15 Vitra

