
PUBLISHER: Global Market Insights Inc. | PRODUCT CODE: 1871307

PUBLISHER: Global Market Insights Inc. | PRODUCT CODE: 1871307
Probiotics Market Opportunity, Growth Drivers, Industry Trend Analysis, and Forecast 2025 - 2034
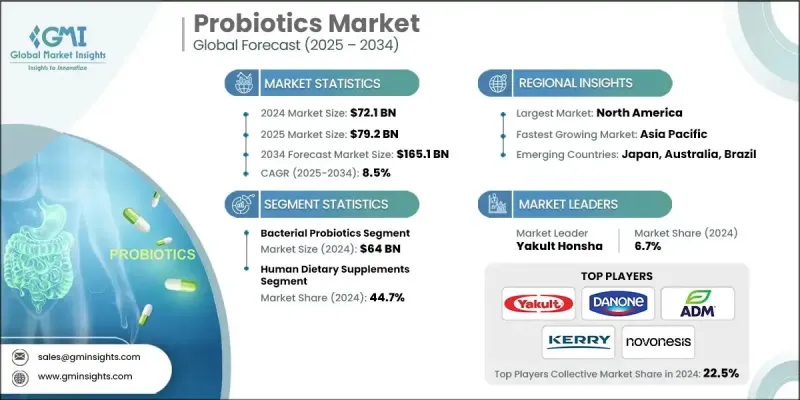
The Global Probiotics Market was valued at USD 72.1 billion in 2024 and is estimated to grow at a CAGR of 8.5% to reach USD 165.1 billion by 2034.
Probiotics are live microorganisms that, when consumed in appropriate amounts, deliver various health benefits. Growing consumer understanding of gut health, immune system support, and overall wellness has fueled the global demand for probiotic products. The market's growth is further influenced by sustainability trends, as manufacturers focus on eco-friendly raw materials and production systems that reduce dependence on finite natural resources. Advancements in manufacturing infrastructure have enabled companies to improve efficiency and minimize environmental impact, contributing to long-term industry sustainability. The modernization of production facilities has also reduced operational costs and supported continuous innovation in formulation and packaging. These developments align with global sustainability goals while encouraging investment in next-generation probiotic production technologies. North America currently leads the probiotics market, supported by strong regulatory frameworks and robust manufacturing capabilities. Meanwhile, the Asia-Pacific region is emerging as the fastest-growing market, driven by increasing consumer health awareness, rapid urbanization, and large-scale investment in innovative probiotic strain development and delivery systems.
| Market Scope | |
|---|---|
| Start Year | 2024 |
| Forecast Year | 2025-2034 |
| Start Value | $72.1 Billion |
| Forecast Value | $165.1 Billion |
| CAGR | 8.5% |
The bacterial probiotics segment generated USD 64 billion in 2024. This segment consists of multiple genera, including Lactobacillus, Bifidobacterium, Streptococcus, and emerging strains such as Akkermansia and Faecalibacterium. Although the market was once dominated by traditional lactobacillus species, scientific reclassifications have diversified the taxonomy to include genera such as lacticaseibacillus, lactiplantibacillus, and limosilactobacillus. These bacteria are clinically validated for their contributions to digestive health, immune function, and metabolic balance. Their long-standing regulatory acceptance and consistent clinical evidence continue to strengthen their market position as essential probiotic strains in the health and wellness sector.
The human dietary supplements segment held 44.7% share in 2024, owing to the preference for convenient and concentrated probiotic formats. Consumers increasingly favor capsules, powders, tablets, and liquid supplements for daily use, as they offer ease of consumption and targeted health benefits. Rising health consciousness, coupled with the growing elderly population experiencing digestive disorders, continues to fuel this segment's growth. The ongoing scientific validation of probiotics' role in digestive and immune health has strengthened their integration into daily wellness routines. Functional food and beverage applications, including yogurts, cultured drinks, and other probiotic-enriched foods, are also expanding rapidly as consumers seek natural dietary sources for probiotics.
North America Probiotics Market is expected to grow at a CAGR of 8.6% between 2025 and 2034. Growth across the region is primarily attributed to heightened consumer awareness about the link between gut health and immunity, coupled with the expanding use of probiotics in dietary supplements and functional food products. Ongoing innovations in strain development and improvements in delivery technology have enhanced product stability, effectiveness, and shelf life. These advancements allow manufacturers to create versatile probiotic products suitable for beverages, snacks, and pharmaceutical applications, thereby boosting regional market adoption and competitiveness.
Major players operating in the Global Probiotics Market include Lallemand, Danone S.A., ADM, Nestle, Kerry Group, Sabinsa Corporation, Kaneka Probiotics, Morinaga Nutritional Foods, Inc., Sanzyme Biologics, Novonesis, Probi AB, and International Flavors & Fragrances. Leading companies in the probiotics market are pursuing strategic initiatives to enhance their global market position and brand visibility. Organizations such as Nestle, ADM, and Danone S.A. are investing heavily in research and development to create novel probiotic strains with proven clinical efficacy. Strategic collaborations and acquisitions are being used to expand distribution networks and strengthen product portfolios. Many players are focusing on technological advancements in microencapsulation and fermentation to enhance probiotic stability and delivery efficiency.
Table of Contents
Chapter 1 Methodology & Scope
- 1.1 Market scope and definition
- 1.2 Research design
- 1.2.1 Research approach
- 1.2.2 Data collection methods
- 1.3 Data mining sources
- 1.3.1 Global
- 1.3.2 Regional/Country
- 1.4 Base estimates and calculations
- 1.4.1 Base year calculation
- 1.4.2 Key trends for market estimation
- 1.5 Primary research and validation
- 1.5.1 Primary sources
- 1.6 Forecast model
- 1.7 Research assumptions and limitations
Chapter 2 Executive Summary
- 2.1 Industry 3600 synopsis
- 2.2 Key market trends
- 2.2.1 Ingredient trends
- 2.2.2 Application trends
- 2.2.3 End use industry trends
- 2.2.4 Regional trends
- 2.3 TAM Analysis, 2025-2034
- 2.4 CXO perspectives: strategic imperatives
- 2.4.1 Executive decision points
- 2.4.2 Critical success factors
- 2.5 Future outlook and strategic recommendations
Chapter 3 Industry Insights
- 3.1 Industry ecosystem analysis
- 3.1.1 Supplier landscape
- 3.1.2 Profit margin
- 3.1.3 Value addition at each stage
- 3.1.4 Factor affecting the value chain
- 3.1.5 Disruptions
- 3.2 Industry impact forces
- 3.2.1 Growth drivers
- 3.2.1.1 Rising consumer health consciousness & preventive healthcare adoption
- 3.2.1.2 Increasing digestive health disorders & antibiotic resistance concerns
- 3.2.1.3 Expanding applications in functional foods & personalized nutrition
- 3.2.2 Industry pitfalls and challenges
- 3.2.2.1 Viability & stability challenges in manufacturing & storage
- 3.2.2.2 Manufacturing scalability & consistent quality assurance
- 3.2.3 Market opportunities
- 3.2.3.1 Emerging applications in mental health & gut-brain axis
- 3.2.3.2 Personalized probiotics based on microbiome analysis
- 3.2.1 Growth drivers
- 3.3 Growth potential analysis
- 3.4 Regulatory landscape
- 3.4.1 North America
- 3.4.2 Europe
- 3.4.3 Asia Pacific
- 3.4.4 Latin America
- 3.4.5 Middle East & Africa
- 3.5 Porter's analysis
- 3.6 PESTEL analysis
- 3.7 Technology and Innovation landscape
- 3.7.1 Current technological trends
- 3.7.2 Emerging technologies
- 3.8 Price trends
- 3.8.1 By region
- 3.8.2 By product
- 3.9 Future market trends
- 3.10 Patent Landscape
- 3.11 Trade statistics (HS code) ( Note: the trade statistics will be provided for key countries only)
- 3.11.1 Major importing countries
- 3.11.2 Major exporting countries
- 3.12 Sustainability and environmental aspects
- 3.12.1 Sustainable practices
- 3.12.2 Waste reduction strategies
- 3.12.3 Energy efficiency in production
- 3.12.4 Eco-friendly initiatives
- 3.13 Carbon footprint consideration
Chapter 4 Competitive Landscape, 2024
- 4.1 Introduction
- 4.2 Company market share analysis
- 4.2.1 By region
- 4.2.1.1 North America
- 4.2.1.2 Europe
- 4.2.1.3 Asia Pacific
- 4.2.1.4 LATAM
- 4.2.1.5 MEA
- 4.2.1 By region
- 4.3 Company matrix analysis
- 4.4 Competitive analysis of major market players
- 4.5 Competitive positioning matrix
- 4.6 Key developments
- 4.6.1 Mergers & acquisitions
- 4.6.2 Partnerships & collaborations
- 4.6.3 New product launches
- 4.6.4 Expansion plans
Chapter 5 Market Estimates and Forecast, By Ingredients, 2021-2034 (USD Billion) (Kilo Tons)
- 5.1 Key trends
- 5.2 Bacterial probiotics
- 5.2.1 Lactobacillus
- 5.2.2 Bifidobacterium
- 5.2.3 Bacillus
- 5.2.4 Others
- 5.3 Yeast probiotics
- 5.3.1 Saccharomyces boulardii
- 5.3.2 Saccharomyces cerevisiae
- 5.3.3 Others
Chapter 6 Market Estimates and Forecast, By Application, 2021-2034 (USD Billion) (Kilo Tons)
- 6.1 Key trends
- 6.2 Human dietary supplements
- 6.2.1 Capsule & tablet
- 6.2.2 Powder & liquid supplement
- 6.2.3 Gummy & chewable
- 6.3 Functional foods & beverages
- 6.3.1 Dairy-based probiotic products
- 6.3.2 Yogurt & fermented milk
- 6.3.3 Cheese & dairy
- 6.3.4 Plant-based & non-dairy alternatives
- 6.3.5 Probiotic beverages & functional drinks
- 6.3.6 Fortified food applications
- 6.3.7 Breakfast cereals & nutrition bars
- 6.3.8 Baked goods & confectionery
- 6.3.9 Frozen & processed foods
- 6.4 Animal nutrition & feed applications
- 6.4.1 Livestock feed additives
- 6.4.2 Poultry
- 6.4.3 Companion animal
- 6.5 Pharmaceutical & medical products
- 6.5.1 Live biotherapeutic products
- 6.5.2 Prescription probiotic medications
- 6.5.3 Medical foods & clinical nutrition
- 6.6 Others
Chapter 7 Market Estimates and Forecast, By End Use Industry, 2021-2034 (USD Billion) (Kilo Tons)
- 7.1 Key trends
- 7.2 Food & beverage manufacturing
- 7.2.1 Dairy processing
- 7.2.2 Functional food manufacturers
- 7.2.3 Organic & natural product
- 7.3 Pharmaceutical & biotechnology
- 7.4 Animal agriculture & feed
- 7.5 Consumer health & wellness
- 7.6 Others
Chapter 8 Market Estimates and Forecast, By Region, 2021-2034 (USD Billion) (Kilo Tons)
- 8.1 Key trends
- 8.2 North America
- 8.2.1 U.S.
- 8.2.2 Canada
- 8.3 Europe
- 8.3.1 Germany
- 8.3.2 UK
- 8.3.3 France
- 8.3.4 Spain
- 8.3.5 Italy
- 8.3.6 Rest of Europe
- 8.4 Asia Pacific
- 8.4.1 China
- 8.4.2 India
- 8.4.3 Japan
- 8.4.4 Australia
- 8.4.5 South Korea
- 8.4.6 Rest of Asia Pacific
- 8.5 Latin America
- 8.5.1 Brazil
- 8.5.2 Mexico
- 8.5.3 Argentina
- 8.5.4 Rest of Latin America
- 8.6 Middle East and Africa
- 8.6.1 Saudi Arabia
- 8.6.2 South Africa
- 8.6.3 UAE
- 8.6.4 Rest of Middle East and Africa
Chapter 9 Company Profiles
- 9.1 ADM
- 9.2 Novonesis
- 9.3 Danone S.A.
- 9.4 International Flavors & Fragrances
- 9.5 Kaneka Probiotics
- 9.6 Kerry Group
- 9.7 Lallemand
- 9.8 Morinaga Nutritional Foods, Inc.
- 9.9 Nestle
- 9.10 Probi AB
- 9.11 Sabinsa Corporation
- 9.12 Sanzyme Biologics

