
PUBLISHER: Global Market Insights Inc. | PRODUCT CODE: 1833675

PUBLISHER: Global Market Insights Inc. | PRODUCT CODE: 1833675
Nitrile Gloves Market Opportunity, Growth Drivers, Industry Trend Analysis, and Forecast 2025 - 2034
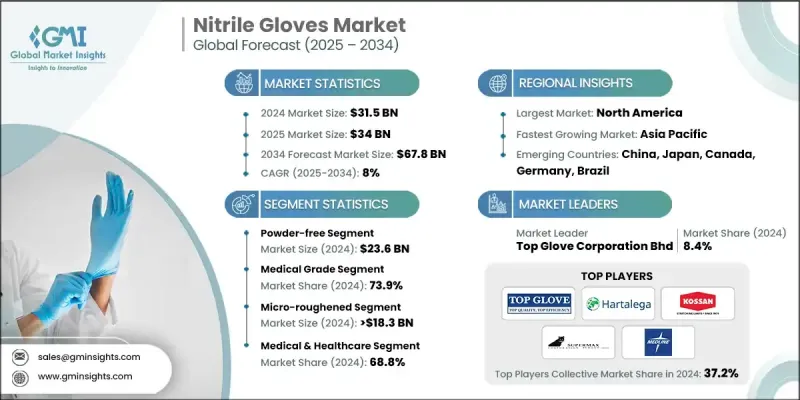
The Global Nitrile Gloves Market was valued at USD 31.5 billion in 2024 and is estimated to grow at a CAGR of 8% to reach USD 67.8 billion by 2034.
Market expansion is being fueled by rising adoption of personal protective equipment across industries, with healthcare, manufacturing, and food handling being the most prominent drivers. The surge in infectious diseases has heightened demand for protective barriers, positioning nitrile gloves as the preferred option over latex due to their chemical resistance and hypoallergenic nature. Strict regulatory requirements and a growing focus on infection control continue to enhance adoption worldwide. Additionally, the rising awareness of workplace safety and increasing industrial activities in emerging economies are contributing to steady growth. Advances in glove production technology have lowered costs and improved accessibility, while innovation in biodegradable and eco-friendly materials is opening new opportunities. With the ongoing digital transformation of healthcare and industrial practices, nitrile gloves are expected to maintain their critical role in safety and hygiene.
| Market Scope | |
|---|---|
| Start Year | 2024 |
| Forecast Year | 2025-2034 |
| Start Value | $31.5 Billion |
| Forecast Value | $67.8 Billion |
| CAGR | 8% |
The powder-free nitrile gloves segment generated USD 23.6 billion in 2024 at a CAGR of 8%, driven by growing demand for clean and safe protective solutions. Their absence of powder reduces the risk of allergic reactions and contamination, making them the preferred choice in healthcare, food processing, and industrial applications. The shift toward powder-free options reflects rising regulatory scrutiny and heightened sensitivity to infection control, pushing powdered gloves into decline.
The micro-roughened gloves segment was valued at USD 18.3 billion in 2024 and is forecast to grow at an 8% CAGR through 2034. Their textured surfaces provide superior grip and control, crucial for high-precision tasks in medical, industrial, and food service sectors. This advantage has increased their adoption compared to smooth variants, as they also minimize slipping risks, ensuring enhanced safety in critical environments.
North America Nitrile Gloves Market held a 41.1% share in 2024, supported by widespread adoption across healthcare systems, laboratories, and industrial workplaces. The region's strong regulatory framework and heightened hygiene awareness continue to stimulate demand, while advancements in glove quality and comfort are reinforcing consumer acceptance. Growth is further amplified by significant contributions from industrial and food processing sectors, where strict safety regulations are applied.
Key players operating in the Nitrile Gloves Market include Ammex, Medline Industries, YTY Group, MCR Safety, Atlantic Safety Group, Ansell, Semperit AG Holding Company, Adenna LLC, Kimberly-Clark Corporation, AMY Group, Primus Gloves (P) Ltd., Avantor, KINGFA SCI. & TECH. Company Limited, Kossan Rubber Industries Bhd, Blue Sail, Supermax Corporation Berhad, Top Glove Corporation, Unigloves (UK) Ltd, Kanam Latex, and Hartalega.
To strengthen their presence, companies in the nitrile gloves industry are focusing on expanding production capacity, enhancing product quality, and developing innovative designs such as eco-friendly and biodegradable gloves. Many manufacturers are investing in automation and advanced manufacturing technologies to optimize efficiency and reduce costs. Strategic partnerships with healthcare providers, distributors, and government agencies are also being pursued to secure long-term contracts and broaden supply networks. In addition, players are targeting emerging markets by setting up localized production facilities and expanding distribution networks to meet rising demand. Continuous investment in R&D, coupled with compliance with strict global safety standards, is helping manufacturers improve product differentiation and gain a stronger foothold in the competitive market landscape.
Table of Contents
Chapter 1 Methodology
- 1.1 Market scope and definition
- 1.2 Research design
- 1.2.1 Research approach
- 1.2.2 Data collection methods
- 1.3 Data mining sources
- 1.3.1 Global
- 1.3.2 Regional/Country
- 1.4 Base estimates and calculations
- 1.4.1 Base year calculation
- 1.4.2 Key trends for market estimation
- 1.5 Primary research and validation
- 1.5.1 Primary sources
- 1.6 Forecast model
- 1.7 Research assumptions and limitations
Chapter 2 Executive Summary
- 2.1 Industry 360° synopsis
- 2.2 Key market trends
- 2.2.1 Regional
- 2.2.2 Type
- 2.2.3 Grade
- 2.2.4 Texture
- 2.2.5 End use
- 2.3 TAM Analysis, 2025-2034
- 2.4 CXO perspectives: Strategic imperatives
- 2.4.1 Executive decision points
- 2.4.2 Critical success factors
- 2.5 Future Outlook and strategic recommendations
Chapter 3 Industry Insights
- 3.1 Industry ecosystem analysis
- 3.1.1 Supplier Landscape
- 3.1.2 Profit Margin
- 3.1.3 Value addition at each stage
- 3.1.4 Factor affecting the value chain
- 3.1.5 Disruptions
- 3.2 Industry impact forces
- 3.2.1 Growth drivers
- 3.2.2 Industry pitfalls and challenges
- 3.2.3 Market opportunities
- 3.3 Growth potential analysis
- 3.4 Regulatory landscape
- 3.4.1 North America
- 3.4.2 Europe
- 3.4.3 Asia Pacific
- 3.4.4 Latin America
- 3.4.5 Middle East & Africa
- 3.5 Porter's analysis
- 3.6 PESTEL analysis
- 3.7 Price trends
- 3.7.1 By region
- 3.7.2 By product
- 3.8 Future market trends
- 3.9 Technology and innovation landscape
- 3.9.1 Current technological trends
- 3.9.2 Emerging technologies
- 3.10 Patent landscape
- 3.11 Trade statistics (HS code)( Note: the trade statistics will be provided for key countries only)
- 3.11.1 Major importing countries
- 3.11.2 Major exporting countries
- 3.12 Sustainability and environmental aspects
- 3.12.1 Sustainable practices
- 3.12.2 Waste reduction strategies
- 3.12.3 Energy efficiency in production
- 3.12.4 Eco-friendly initiatives
Chapter 4 Competitive Landscape, 2024
- 4.1 Introduction
- 4.2 Company market share analysis
- 4.2.1 By region
- 4.2.1.1 North America
- 4.2.1.2 Europe
- 4.2.1.3 Asia Pacific
- 4.2.1.4 LATAM
- 4.2.1.5 MEA
- 4.2.1 By region
- 4.3 Company matrix analysis
- 4.4 Competitive analysis of major market players
- 4.5 Competitive positioning matrix
- 4.6 Key developments
- 4.6.1 Mergers & acquisitions
- 4.6.2 Partnerships & collaborations
- 4.6.3 New product launches
- 4.6.4 Expansion plans
Chapter 5 Market Estimates & Forecast, By Type, 2021-2034 (USD Billion) (Units)
- 5.1 Key trends
- 5.2 Powdered
- 5.3 Powder-Free
Chapter 6 Market Estimates & Forecast, By Grade, 2021-2034 (USD Billion) (Units)
- 6.1 Key trend
- 6.2 Medical grade
- 6.3 Industrial grade
- 6.4 Food grade
Chapter 7 Market Estimates & Forecast, By Texture, 2021-2034 (USD Billion) (Units)
- 7.1 Key trends
- 7.2 Smooth
- 7.3 Micro-roughened
- 7.4 Aggressively textured
Chapter 8 Market Estimates & Forecast, By End use, 2021-2034 (USD Billion) (Units)
- 8.1 Key trend
- 8.2 Medical & healthcare
- 8.3 Food & beverage
- 8.4 Automotive
- 8.5 Oil & gas
- 8.6 Construction
- 8.7 Chemical
- 8.8 Pharmaceutical
- 8.9 Metals & machinery
- 8.10 Others
Chapter 9 Market Estimates & Forecast, By Region, 2021-2034 (USD Billion) (Units)
- 9.1 Key trends
- 9.2 North America
- 9.2.1 U.S.
- 9.2.2 Canada
- 9.3 Europe
- 9.3.1 Germany
- 9.3.2 UK
- 9.3.3 France
- 9.3.4 Italy
- 9.3.5 Spain
- 9.3.6 Rest of Europe
- 9.4 Asia Pacific
- 9.4.1 China
- 9.4.2 India
- 9.4.3 Japan
- 9.4.4 Australia
- 9.4.5 South Korea
- 9.4.6 Rest of Asia Pacific
- 9.5 Latin America
- 9.5.1 Brazil
- 9.5.2 Mexico
- 9.5.3 Argentina
- 9.5.4 Rest of Latin America
- 9.6 Middle East & Africa
- 9.6.1 Saudi Arabia
- 9.6.2 South Africa
- 9.6.3 UAE
- 9.6.4 Rest of Middle East & Africa
Chapter 10 Company Profiles
- 10.1 Adenna LLC
- 10.2 Ammex
- 10.3 AMY Group
- 10.4 Ansell
- 10.5 Atlantic Safety Group
- 10.6 Avantor
- 10.7 Blue Sail.
- 10.8 Hartalega
- 10.9 Kanam Latex
- 10.10 Kimberly-Clark Corporation
- 10.11 KINGFA SCI. & TECH. COMPANY LIMITED
- 10.12 Kossan Rubber Industries Bhd
- 10.13 MCR Safety
- 10.14 Medline Industries
- 10.15 Primus Gloves (P) Ltd.
- 10.16 Semperit AG Holding Company
- 10.17 Supermax Corporation Berhad
- 10.18 Top Glove Corporation Bhd
- 10.19 Unigloves (UK) Ltd
- 10.20 YTY Group

