
PUBLISHER: Global Market Insights Inc. | PRODUCT CODE: 1844352

PUBLISHER: Global Market Insights Inc. | PRODUCT CODE: 1844352
Surgical Robots Market Opportunity, Growth Drivers, Industry Trend Analysis, and Forecast 2025 - 2034
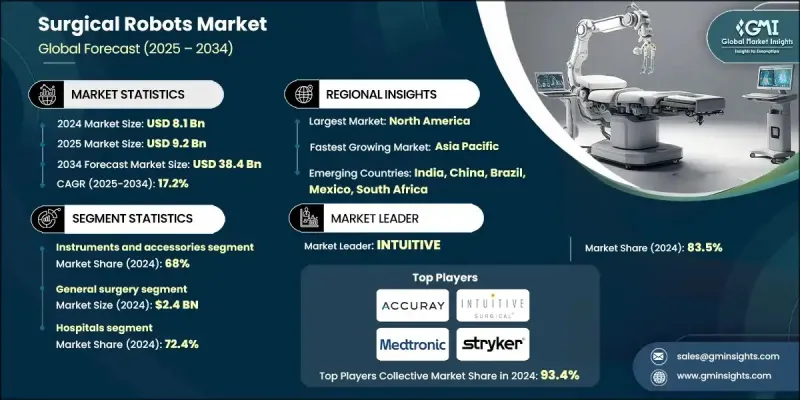
The Global Surgical Robots Market was valued at USD 8.1 billion in 2024 and is estimated to grow at a CAGR of 17.2% to reach USD 38.4 billion by 2034.
The growth is driven by the increasing demand for minimally invasive procedures, a rise in chronic disease incidence, continuous advancements in robotic technology, and greater healthcare spending. Hospitals and surgical centers are increasingly investing in robotic systems to improve surgical precision, reduce patient recovery time, and minimize procedural complications. Surgical robots, which combine robotic arms, advanced imaging, and real-time data integration, offer enhanced control, flexibility, and visibility for complex surgeries. Technological advancements such as artificial intelligence, haptic feedback, and refined imaging tools are further enhancing surgeon capabilities while decreasing fatigue. The emergence of cost-effective robotic models, particularly those with smaller footprints and flexible configurations, is expanding access in both large hospitals and smaller surgical centers. Additionally, new business models like Robotics-as-a-Service (RaaS) and leasing are enabling broader adoption by eliminating high upfront capital barriers. This shift is increasing the availability of robotic surgery across different regions and healthcare settings, ensuring long-term market momentum and broader deployment of surgical robotic systems globally.
| Market Scope | |
|---|---|
| Start Year | 2024 |
| Forecast Year | 2025-2034 |
| Start Value | $8.1 Billion |
| Forecast Value | $38.4 Billion |
| CAGR | 17.2% |
The instruments and accessories segment held 68% share in 2024. This dominance stems from the frequent and recurring use of surgical instruments and accessories in every robotic-assisted procedure. These components, unlike the main robotic systems that represent one-time purchases, require replacement after a set number of uses, creating a recurring revenue stream for manufacturers. This ongoing demand for consumables ensures consistent sales growth and supports market sustainability. Continuous product upgrades and innovation in instrument design also contribute to the segment's strong position, as healthcare providers seek the latest tools for enhanced precision and procedural outcomes.
The gynecology surgery segment is anticipated to grow at a CAGR of 17% through 2034. Rising cases of gynecologic conditions such as endometriosis, fibroids, and reproductive system cancers are increasing the need for surgical interventions. Robotic-assisted surgeries are becoming the preferred approach in this specialty due to their ability to offer reduced postoperative complications, faster recovery times, and greater surgical accuracy. These benefits are particularly important in fertility-related procedures, where precision and preservation of reproductive function are critical.
U.S. Surgical Robots Market was valued at USD 4.5 billion in 2024 and is expected to grow at a CAGR of 15.9%. The country's well-established healthcare infrastructure, combined with a high rate of technological adoption, has led to widespread integration of robotic surgery across hospitals and ambulatory centers. In the U.S., increasing incidences of lifestyle diseases such as obesity, cardiovascular disorders, and various cancers are fueling demand for surgical interventions. Healthcare providers continue to embrace robotic platforms to improve surgical precision, streamline workflows, and meet rising patient expectations, ensuring steady market growth across North America.
Key players influencing the competitive landscape of the Surgical Robots Industry include INTUITIVE, meerecompany, CMR SURGICAL, ACCURAY, Stryker, CASCINATION, Medtronic, Smith & Nephew, ELMED MEDICAL SYSTEMS, THINK SURGICAL, GLOBUS MEDICAL, ZIMMER BIOMET, Distalmotion, RENISHAW, and ASENSUS SURGICAL. These companies are driving the market forward through continued innovation and global expansion strategies. Leading manufacturers in the surgical robots market are strengthening their market presence through strategic innovation, geographic expansion, and flexible business models. A key focus remains on enhancing robotic systems with AI capabilities, real-time analytics, and improved ergonomics to optimize surgical outcomes and reduce clinician fatigue. Companies are also introducing modular and compact systems suitable for smaller operating rooms, making their products more accessible to medium-sized and regional hospitals.
Table of Contents
Chapter 1 Methodology and Scope
- 1.1 Market scope and definitions
- 1.2 Research design
- 1.2.1 Research approach
- 1.2.2 Data collection methods
- 1.3 Data mining sources
- 1.3.1 Global
- 1.3.2 Regional/country
- 1.4 Base estimates and calculations
- 1.4.1 Base year calculation
- 1.4.2 Key trends for market estimation
- 1.5 Primary research and validation
- 1.5.1 Primary sources
- 1.6 Forecast model
- 1.7 Research assumptions and limitations
Chapter 2 Executive Summary
- 2.1 Industry 3600 synopsis
- 2.2 Key market trends
- 2.2.1 Regional trends
- 2.2.2 Component trends
- 2.2.3 Application trends
- 2.2.4 End use trends
- 2.3 CXO perspectives: Strategic imperatives
- 2.3.1 Key decision points for industry executives
- 2.3.2 Critical success factors for market players
- 2.4 Future outlook and strategic recommendations
Chapter 3 Industry Insights
- 3.1 Industry ecosystem analysis
- 3.2 Industry impact forces
- 3.2.1 Growth drivers
- 3.2.1.1 Increasing prevalence of chronic diseases
- 3.2.1.2 Growing healthcare expenditures
- 3.2.1.3 Technological advancements
- 3.2.1.4 Surging adoption of surgical robots
- 3.2.1.5 Rising number of surgical procedures
- 3.2.2 Industry pitfalls and challenges
- 3.2.2.1 High cost of surgical robots
- 3.2.2.2 Regulatory challenges and safety concerns
- 3.2.3 Market opportunities
- 3.2.3.1 Expansion of telesurgery and remote proctoring services
- 3.2.3.2 Growth in emerging markets and outpatient surgical centers
- 3.2.1 Growth drivers
- 3.3 Growth potential analysis
- 3.4 Reimbursement scenario
- 3.5 Regulatory landscape
- 3.5.1 North America
- 3.5.2 Europe
- 3.5.3 Asia Pacific
- 3.6 Technology landscape
- 3.6.1 Current technological trends
- 3.6.2 Emerging technologies
- 3.7 Pricing analysis
- 3.8 Brand analysis
- 3.9 Sales model analysis
- 3.10 Value chain analysis
- 3.11 Gap analysis
- 3.12 Porter's analysis
- 3.13 PESTEL analysis
- 3.14 Future market trends
Chapter 4 Competitive Landscape, 2024
- 4.1 Introduction
- 4.2 Company matrix analysis
- 4.3 Company market share analysis
- 4.3.1 Global
- 4.3.2 North America
- 4.3.3 Europe
- 4.3.4 Asia Pacific
- 4.3.5 LAMEA
- 4.4 Competitive positioning matrix
- 4.5 Competitive analysis of major market players
- 4.6 Key developments
- 4.6.1 Mergers and acquisitions
- 4.6.2 Partnerships and collaborations
- 4.6.3 New component launches
- 4.6.4 Expansion plans
Chapter 5 Market Estimates and Forecast, By Component, 2021 - 2034 ($ Mn)
- 5.1 Key trends
- 5.2 Robot systems
- 5.3 Instruments and accessories
Chapter 6 Market Estimates and Forecast, By Application, 2021 - 2034 ($ Mn)
- 6.1 Key trends
- 6.2 General surgery
- 6.3 Gynecology surgery
- 6.4 Urologic surgery
- 6.5 Orthopedic surgery
- 6.6 Neurosurgery
- 6.7 Other applications
Chapter 7 Market Estimates and Forecast, By End Use, 2021 - 2034 ($ Mn)
- 7.1 Key trends
- 7.2 Hospitals
- 7.3 Ambulatory surgical centers
Chapter 8 Market Estimates and Forecast, By Region, 2021 - 2034 ($ Mn)
- 8.1 Key trends
- 8.2 North America
- 8.2.1 U.S.
- 8.2.2 Canada
- 8.3 Europe
- 8.3.1 Germany
- 8.3.2 UK
- 8.3.3 France
- 8.3.4 Spain
- 8.3.5 Italy
- 8.3.6 Netherlands
- 8.4 Asia Pacific
- 8.4.1 China
- 8.4.2 Japan
- 8.4.3 India
- 8.4.4 Australia
- 8.4.5 South Korea
- 8.5 Latin America
- 8.5.1 Brazil
- 8.5.2 Mexico
- 8.5.3 Argentina
- 8.6 Middle East and Africa
- 8.6.1 South Africa
- 8.6.2 Saudi Arabia
- 8.6.3 UAE
Chapter 9 Company Profiles
- 9.1 ACCURAY
- 9.2 ASENSUS SURGICAL
- 9.3 CASCINATION
- 9.4 CMR SURGICAL
- 9.5 Distalmotion
- 9.6 ELMED MEDICAL SYSTEMS
- 9.7 GLOBUS MEDICAL
- 9.8 INTUITIVE
- 9.9 Medtronic
- 9.10 meerecompany
- 9.11 RENISHAW
- 9.12 Smith & Nephew
- 9.13 Stryker
- 9.14 THINK SURGICAL
- 9.15 ZIMMER BIOMET

