
PUBLISHER: Global Market Insights Inc. | PRODUCT CODE: 1859018

PUBLISHER: Global Market Insights Inc. | PRODUCT CODE: 1859018
Respiratory Protective Equipment Market Opportunity, Growth Drivers, Industry Trend Analysis, and Forecast 2024 - 2032
The Global Respiratory Protective Equipment Market was valued at USD 9 billion in 2024 and is estimated to grow at a CAGR of 7.4% to reach USD 18.5 billion by 2034.
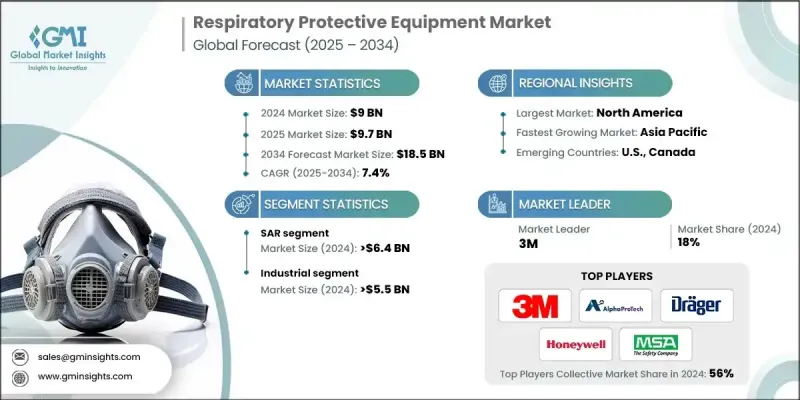
The growth is driven by heightened awareness of health risks associated with airborne contaminants and the increasing number of individuals suffering from respiratory diseases. Moreover, the demand for RPE continues to rise due to the growing number of industries and environments where workers are exposed to harmful dust, fumes, vapors, and infectious agents. Sectors such as healthcare, manufacturing, construction, and emergency services are all key drivers of this market. As workplace safety regulations tighten globally, industries are investing heavily in high-quality respiratory protection, further fueling market expansion. Respiratory protective equipment is critical for maintaining occupational health, especially in industries where hazardous substances are prevalent.
| Market Scope | |
|---|---|
| Start Year | 2024 |
| Forecast Year | 2025-2034 |
| Start Value | $9 Billion |
| Forecast Value | $18.5 Billion |
| CAGR | 7.4% |
The supplied-air respirators (SAR) segment reached USD 6.4 billion in 2024 and is expected to grow at a CAGR of 7.6% from 2025 to 2034. SARs are typically used in specialized applications such as confined spaces, hazardous chemical handling, and firefighting. Though SARs offer superior protection, their maintenance and operational complexity make them less suited for everyday industrial use compared to other types of respirators.
The industrial segment accounted for USD 5.5 billion in 2024. Industries in this segment are increasingly investing in reusable air-purifying respirators, which are cost-effective and flexible for environments where exposure to dust and chemicals is common.
U.S. Respiratory Protective Equipment Market held 86.5% share and generated USD 2.7 billion in 2024. The U.S. market remains a key driver for respiratory protective equipment due to its advanced industrial sectors and stringent safety regulations. Industries like oil and gas, aerospace, and chemical manufacturing rely on high-quality respirators to safeguard their workforce. Regulatory bodies such as OSHA and NIOSH play a crucial role by setting strict standards for respiratory protection, which has led to the development of more advanced devices, such as smart respirators with real-time monitoring capabilities.
Prominent players in the Global Respiratory Protective Equipment Industry include Honeywell International Inc., Sundstrom Safety AB, Lakeland Industries, Inc., Dragerwerk AG & Co. KGaA, RPB Safety LLC, Bullard, Mine Safety Appliances (MSA), 3M, Delta Plus Group, Alpha Pro Tech, Avon Protection Systems, The Gerson Company, and 3B Medical, Inc. To strengthen their presence, companies in the respiratory protective equipment sector are focusing on continuous innovation, especially through the integration of smart technologies and improved materials. Many firms are prioritizing the development of advanced features such as real-time monitoring, wireless connectivity, and enhanced filtration systems to meet the growing demand for safer and more efficient respirators. Additionally, they are expanding their global distribution networks and forging strategic partnerships with industries that require specialized protection, such as healthcare and hazardous environments. Companies are also investing in sustainable materials to appeal to eco-conscious consumers, further enhancing their market share in the competitive landscape.
Table of Contents
Chapter 1 Methodology
- 1.1 Market scope and definition
- 1.2 Research design
- 1.2.1 Research approach
- 1.2.2 Data collection methods
- 1.3 Data mining sources
- 1.3.1 Global
- 1.3.2 Regional/Country
- 1.4 Base estimates and calculations
- 1.4.1 Base year calculation
- 1.4.2 Key trends for market estimation
- 1.5 Primary research and validation
- 1.5.1 Primary sources
- 1.6 Forecast model
- 1.7 Research assumptions and limitations
Chapter 2 Executive Summary
- 2.1 Industry 360° synopsis, 2021 - 2034
- 2.2 Key market trends
- 2.2.1 Regional
- 2.2.2 Product
- 2.2.3 Application
- 2.3 TAM Analysis, 2025-2034
- 2.4 CXO perspectives: Strategic imperatives
- 2.4.1 Executive decision points
- 2.4.2 Critical success factors
- 2.5 Future outlook and strategic recommendations
Chapter 3 Industry Insights
- 3.1 Industry ecosystem analysis
- 3.1.1 Supplier landscape
- 3.1.2 Profit margin analysis
- 3.1.3 Cost structure
- 3.1.4 Value addition at each stage
- 3.1.5 Factor affecting the value chain
- 3.1.6 Disruptions
- 3.2 Industry impact forces
- 3.2.1 Growth drivers
- 3.2.1.1 Rising health awareness
- 3.2.1.2 Shift toward reusable respirators
- 3.2.1.3 Integration of smart technologies
- 3.2.1.4 Focus on comfort and ergonomics
- 3.2.2 Industry pitfalls and challenges
- 3.2.2.1 Supply chain disruptions
- 3.2.2.2 High equipment costs
- 3.2.3 Market opportunities
- 3.2.3.1 Healthcare sector modernization
- 3.2.3.2 Eco-friendly product development
- 3.2.3.3 Expansion in emerging economies
- 3.2.1 Growth drivers
- 3.3 Growth potential analysis
- 3.4 Regulatory landscape
- 3.4.1 North America
- 3.4.2 Europe
- 3.4.3 Asia Pacific
- 3.4.4 Latin America
- 3.4.5 Middle East & Africa
- 3.5 Porter's analysis
- 3.6 PESTEL analysis
- 3.7 Technology and innovation landscape
- 3.7.1 Current technological trends
- 3.7.2 Emerging technologies
- 3.8 Price trends
- 3.8.1 By region
- 3.8.2 By product
- 3.9 Cost breakdown analysis
- 3.10 Patent analysis
- 3.11 Sustainability and environmental aspects
- 3.11.1 Sustainable practices
- 3.11.2 Waste reduction strategies
- 3.11.3 Energy efficiency in production
- 3.11.4 Eco-friendly initiatives
- 3.12 Carbon footprint considerations
Chapter 4 Competitive Landscape, 2024
- 4.1 Introduction
- 4.2 Company market share analysis
- 4.2.1 North America
- 4.2.2 Europe
- 4.2.3 Asia Pacific
- 4.2.4 LATAM
- 4.2.5 MEA
- 4.3 Competitive analysis of major market players
- 4.4 Competitive positioning matrix
- 4.5 Strategic outlook matrix
- 4.6 Key developments
- 4.6.1 Mergers & acquisitions
- 4.6.2 Partnerships & collaborations
- 4.6.3 New product launches
- 4.6.4 Expansion plans and funding
Chapter 5 Market Estimates & Forecast, By Product, 2021 - 2034 (USD Billion, Units)
- 5.1 Key trends
- 5.1.1 APR
- 5.1.1.1 Unpowered
- 5.1.1.1.1 Disposable filtering half mask
- 5.1.1.1.2 Reusable half mask
- 5.1.1.1.3 Full-face mask
- 5.1.1.2 Powered
- 5.1.1.2.1 Half face mask
- 5.1.1.2.2 Full-face mask
- 5.1.1.2.3 Helmets, hoods & visors
- 5.1.1.1 Unpowered
- 5.1.2 SAR
- 5.1.2.1 SCBA
- 5.1.2.2 Airline respirator
- 5.1.3 Others
- 5.1.1 APR
Chapter 6 Market Estimates & Forecast, By Application, 2021 - 2034 (USD Billion, Units)
- 6.1 Key trends
- 6.2 Industrial
- 6.3 Medical & healthcare
- 6.4 Military & aviation
- 6.5 Public service
- 6.6 Consumer
Chapter 7 Market Estimates & Forecast, By Region, 2021 - 2034 (USD Billion, Units)
- 7.1 Key trends
- 7.2 North America
- 7.2.1 U.S.
- 7.2.2 Canada
- 7.3 Europe
- 7.3.1 Germany
- 7.3.2 UK
- 7.3.3 France
- 7.3.4 Italy
- 7.3.5 Spain
- 7.3.6 Rest of Europe
- 7.4 Asia Pacific
- 7.4.1 China
- 7.4.2 India
- 7.4.3 Japan
- 7.4.4 Australia
- 7.4.5 South Korea
- 7.4.6 Rest of Asia Pacific
- 7.5 Latin America
- 7.5.1 Brazil
- 7.5.2 Mexico
- 7.5.3 Argentina
- 7.5.4 Rest of Latin America
- 7.6 MEA
- 7.6.1 South Africa
- 7.6.2 Saudi Arabia
- 7.6.3 UAE
- 7.6.4 Rest of Middle East Asia
Chapter 8 Company Profiles
- 8.1 3B Medical, Inc.
- 8.2 3M
- 8.3 Alpha Pro Tech
- 8.4 Avon Protection Systems
- 8.5 Bullard
- 8.6 Delta Plus Group
- 8.7 Dragerwerk AG & Co. KGaA
- 8.8 Honeywell International Inc.
- 8.9 Lakeland Industries, Inc.
- 8.10 Mine Safety Appliances (MSA)
- 8.11 RPB Safety LLC
- 8.12 Sundstrom Safety AB
- 8.13 The Gerson Company

