
PUBLISHER: Global Market Insights Inc. | PRODUCT CODE: 1801894

PUBLISHER: Global Market Insights Inc. | PRODUCT CODE: 1801894
Floor Saw Market Opportunity, Growth Drivers, Industry Trend Analysis, and Forecast 2025 - 2034
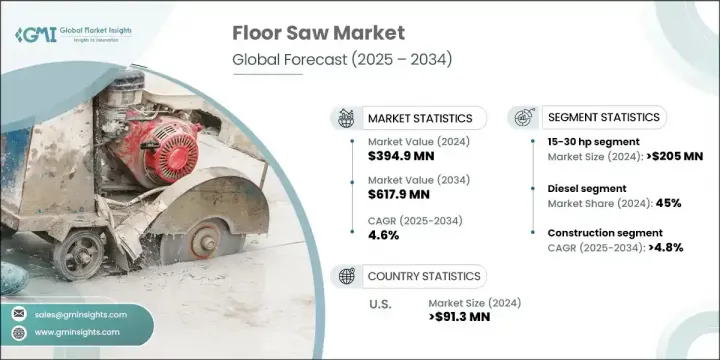
The Global Floor Saw Market was valued at USD 394.9 million in 2024 and is estimated to grow at a CAGR of 4.6% to reach USD 617.9 million by 2034. Demand continues to grow steadily, propelled by rising infrastructure development across major regions. Significant government and private sector investments in transportation networks, including roads, airports, and urban transit systems, are creating a strong need for high-performance cutting tools. Floor saws play an essential role in foundation work, pavement expansion joints, and structural repair, making them indispensable in modern construction workflows.
Rapid acceleration in residential, commercial, and industrial construction projects is also contributing to market growth. Precision, durability, and operational safety are critical in concrete and asphalt cutting, and floor saws meet these technical demands. As smart cities, transport terminals, and modern offices continue to be built at scale, especially in emerging economies, contractors are opting for floor saws that deliver both speed and efficiency. Urbanization is intensifying across regions like the Middle East, Asia Pacific, and parts of Africa, leading to greater usage of floor cutting machines in confined city spaces. The need for tools that cut through dense surfaces reliably in high-traffic areas continues to drive adoption rates globally.
| Market Scope | |
|---|---|
| Start Year | 2024 |
| Forecast Year | 2025-2034 |
| Start Value | $394.9 Million |
| Forecast Value | $617.9 Million |
| CAGR | 4.6% |
In 2024, the floor saws in the 15-30 HP category reached USD 205 million and is forecasted to grow at a CAGR of 4.8% through 2034. This mid-range power segment is widely favored due to its optimal mix of versatility and performance. Contractors often rely on this range for concrete cutting, trenching, and surface repairs because it supports both residential and commercial applications without the added operational burden of heavier, more fuel-intensive machines. The ease of handling, moderate weight, and strong cutting capacity make it a preferred choice across the mid-scale construction landscape.
The diesel-powered floor saws segment held 45% share and is projected to grow at a CAGR of 4.6% between 2025 and 2034. These machines remain the top pick for heavy-duty operations due to their superior power, higher torque, and long-running efficiency. Diesel variants are designed for intensive tasks such as deep concrete or asphalt cutting in large-scale outdoor settings. Their ability to perform under prolonged workloads with minimal downtime gives them a clear advantage in infrastructure-heavy projects where time and precision are critical. For contractors handling large highway, bridge, or airport-related cutting tasks, diesel models continue to offer the most reliable results.
United States Floor Saw Market held 77% share and reached USD 91.3 million in 2024. Growth in the US market is being driven by consistent infrastructure expansion, fueled by federally funded upgrades in highways, municipal transportation, and aviation facilities. As one of the most construction-active nations globally, the US consistently demands heavy-duty cutting tools that meet strict quality and timeline requirements. Whether it's repairing highways or developing cityscapes, the reliance on high-performance floor saws continues to rise in this region.
The leading players shaping the Floor Saw Market include Hilti, LISSMAC, Makita, Maschinenbau, Wacker Neuson, Husqvarna Construction, Atlas Copco, and STIHL Incorporated. Key industry players are focusing on product innovation, strategic collaborations, and regional expansion to strengthen their market positioning. Many are investing in R&D to enhance saw efficiency, reduce noise, and improve operator safety, while also introducing electric and hybrid models to align with evolving environmental regulations. Companies are also expanding service networks and after-sales support to increase customer retention. Strategic acquisitions and joint ventures help firms diversify their product portfolios and enter untapped markets. In addition, manufacturers are focusing on digital integration, adding smart sensors and real-time diagnostics to their floor saws, enabling predictive maintenance and optimized performance. These efforts collectively aim to deliver greater value to end users while increasing market penetration across growing construction hubs worldwide.
Table of Contents
Chapter 1 Methodology and scope
- 1.1 Market scope and definition
- 1.2 Research design
- 1.2.1 Research approach
- 1.2.2 Data collection methods
- 1.3 Data mining sources
- 1.3.1 Global
- 1.3.2 Regional/country
- 1.4 Base estimates and calculations
- 1.4.1 Base year calculation
- 1.4.2 Key trends for market estimation
- 1.5 Primary research and validation
- 1.5.1 Primary sources
- 1.6 Forecast model
- 1.7 Research assumptions and limitations
Chapter 2 Executive summary
- 2.1 Industry 3600 synopsis
- 2.2 Key market trends
- 2.2.1 Regional
- 2.2.2 By power
- 2.2.3 By cutting depth
- 2.2.4 By power source
- 2.2.5 By price
- 2.2.6 By application
- 2.2.7 By distribution channel
- 2.3 CXO perspectives: strategic imperatives
- 2.3.1 Key decision points for industry executives
- 2.3.2 Critical success factors for market players
- 2.4 Future outlook and strategic recommendations
Chapter 3 Industry insights
- 3.1 Industry ecosystem analysis
- 3.1.1 Supplier landscape
- 3.1.2 Profit margin
- 3.1.3 Value addition at each stage
- 3.1.4 Factor affecting the value chain
- 3.2 Industry impact forces
- 3.2.1 Growth drivers
- 3.2.2 Industry pitfalls & challenges
- 3.2.3 Opportunities
- 3.3 Growth potential analysis
- 3.4 Future market trends
- 3.5 Technology and innovation landscape
- 3.5.1 Current technological trends
- 3.5.2 Emerging technologies
- 3.6 Price trends
- 3.6.1 By region
- 3.6.2 By power
- 3.7 Regulatory landscape
- 3.7.1 Standards and compliance requirements
- 3.7.2 Regional regulatory frameworks
- 3.7.3 Certification standards
- 3.8 Porter’s analysis
- 3.9 PESTEL analysis
Chapter 4 Competitive landscape, 2024
- 4.1 Introduction
- 4.2 Company market share analysis
- 4.2.1 By region
- 4.2.1.1 North America
- 4.2.1.2 Europe
- 4.2.1.3 Asia Pacific
- 4.2.1.4 Latin America
- 4.2.1.5 MEA
- 4.2.1 By region
- 4.3 Company matrix analysis
- 4.4 Competitive analysis of major market players
- 4.5 Competitive positioning matrix
- 4.6 Key developments
- 4.6.1 Mergers & acquisitions
- 4.6.2 Partnerships & collaborations
- 4.6.3 New product launches
- 4.6.4 Expansion plans
Chapter 5 Market Estimates & Forecast, By Power, 2021 - 2034 ($Million, Million Units)
- 5.1 Key trends
- 5.2 Below 15 HP
- 5.3 15-30 HP
- 5.4 Above 30 HP
Chapter 6 Market Estimates & Forecast, By Cutting Depth, 2021 - 2034 ($Million, Million Units)
- 6.1 Key trends
- 6.2 Up 5 inches
- 6.3 5 - 7.5 inch
- 6.4 Above 7.5 inches
Chapter 7 Market Estimates & Forecast, By Power Source, 2021 - 2034 ($Million, Million Units)
- 7.1 Petrol
- 7.2 Diesel
- 7.3 Electric
- 7.3.1 Corded
- 7.3.2 Cordless
Chapter 8 Market Estimates & Forecast, By Price, 2021 - 2034 ($Million, Million Units)
- 8.1 Key trends
- 8.2 Low
- 8.3 Medium
- 8.4 High
Chapter 9 Market Estimates & Forecast, By Application, 2021 - 2034 ($Million, Million Units)
- 9.1 Key trends
- 9.2 Construction
- 9.3 Roadworks
- 9.4 Landscaping and hardscaping
- 9.5 Demolition
- 9.6 Others (utilities, etc.)
Chapter 10 Market Estimates & Forecast, By Distribution Channel, 2021 - 2034 ($Million, Million Units)
- 10.1 Key trends
- 10.2 Direct sales
- 10.3 Indirect sales
Chapter 11 Market Estimates & Forecast, By Region, 2021 - 2034 ($Million, Million Units)
- 11.1 Key trends
- 11.2 North America
- 11.2.1 U.S.
- 11.2.2 Canada
- 11.3 Europe
- 11.3.1 Germany
- 11.3.2 UK
- 11.3.3 France
- 11.3.4 Spain
- 11.3.5 Italy
- 11.3.6 Netherlands
- 11.4 Asia Pacific
- 11.4.1 China
- 11.4.2 Japan
- 11.4.3 India
- 11.4.4 Australia
- 11.4.5 South Korea
- 11.5 Latin America
- 11.5.1 Brazil
- 11.5.2 Mexico
- 11.5.3 Argentina
- 11.6 MEA
- 11.6.1 South Africa
- 11.6.2 Saudi Arabia
- 11.6.3 UAE
Chapter 12 Company Profiles
- 12.1 Amada Machinery America
- 12.2 Atlas Copco
- 12.3 Bycon Industry
- 12.4 Chicago Pneumatic
- 12.5 Hilti
- 12.6 Husqvarna Construction
- 12.7 IMER
- 12.8 LISSMAC Maschinenbau
- 12.9 Makita
- 12.10 Saint-Gobain
- 12.11 SIMA
- 12.12 STIHL
- 12.13 TRAXX Construction Products
- 12.14 Tyrolit
- 12.15 Wacker Neuson

