
PUBLISHER: Global Market Insights Inc. | PRODUCT CODE: 1871271

PUBLISHER: Global Market Insights Inc. | PRODUCT CODE: 1871271
Clear Aligners Market Opportunity, Growth Drivers, Industry Trend Analysis, and Forecast 2025 - 2034
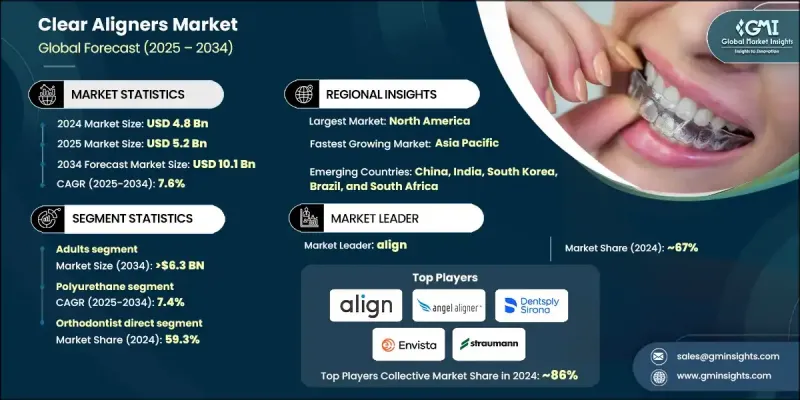
The Global Clear Aligners Market was valued at USD 4.8 billion in 2024 and is estimated to grow at a CAGR of 7.6% to reach USD 10.1 billion by 2034.
The market is experiencing strong growth due to the rising incidence of dental misalignment and increased demand for discreet orthodontic treatments. Consumers, especially adults and teenagers, are becoming more aware of aesthetic dental care options that align with both lifestyle and cosmetic expectations. Clear aligners are now a vital part of modern orthodontics, offering effective, non-intrusive alternatives to metal braces. Advanced features such as digital scanning, AI-based treatment mapping, and 3D-printed customization ensure better patient outcomes and higher satisfaction rates. Enhanced public awareness through digital platforms, alongside growing cosmetic dentistry trends, continues to reinforce demand. A shift toward convenient and nearly invisible solutions has significantly influenced patient choices, especially in urban and professional populations. High disposable incomes, growing orthodontic infrastructure, and tech-integrated treatment plans are further driving the adoption of clear aligners across global markets.
| Market Scope | |
|---|---|
| Start Year | 2024 |
| Forecast Year | 2025-2034 |
| Start Value | $4.8 Billion |
| Forecast Value | $10.1 Billion |
| CAGR | 7.6% |
The adults segment held a 64.3% share in 2024, driven by growing demand among professionals and older age groups seeking effective, subtle dental corrections. This segment continues to grow as consumers prioritize treatments that allow for minimal lifestyle disruption. Adults increasingly prefer advanced orthodontic care solutions due to greater spending capacity and improved knowledge of oral health benefits. Recent developments in clear aligner systems, such as accelerated treatment cycles and better personalization, have helped attract adults who may have previously been hesitant about orthodontic treatments due to aesthetic or comfort concerns associated with traditional braces.
The orthodontist direct channel segment held a 59.3% share in 2024 and is forecasted to reach USD 5.8 billion by 2034. This segment benefits from consumer confidence in professionally managed treatment plans, especially in cases requiring detailed diagnosis and precision. In-person orthodontic services offer greater control, customization, and ongoing support qualities that remain critical in ensuring effective treatment outcomes. As a result, patients tend to prefer this approach for more complex dental corrections where expert guidance is essential for success and long-term results.
U.S. Clear Aligners Market reached USD 2.1 billion in 2024. With a robust dental care system, strong reimbursement frameworks, and significant consumer spending capacity, the U.S. continues to be a dominant force in the global landscape. The increasing adoption of aligners in place of traditional braces is being driven by the appeal of discreet, removable orthodontic devices. The country's well-established clinical network and the presence of major brands contribute to sustained demand.
Some of the key companies operating in the Global Clear Aligners Market include 3M, Align, makeO, ASO International, Inc., BIOSAFIN, DentCare, Novoalign, KRISTELLE Klear Aligners, DenMat, Envista, K LINE, Straumann, GenioVA, Angle Aligner, and Dentsply Sirona. To strengthen their position, companies in the Global Clear Aligners Market are investing in AI-powered treatment planning platforms, expanding product portfolios with customized solutions, and enhancing 3D printing technologies for greater precision. Strategic partnerships with dental professionals and clinics help improve treatment accessibility and consumer trust. Many players are also focusing on expanding geographic reach, particularly in emerging markets with rising demand for orthodontic care. Direct-to-consumer marketing, digital engagement, and educational campaigns are being used to increase awareness.
Table of Contents
Chapter 1 Methodology and Scope
- 1.1 Market scope and definition
- 1.2 Research design
- 1.2.1 Research approach
- 1.2.2 Data collection methods
- 1.3 Data mining sources
- 1.3.1 Global
- 1.3.2 Regional/Country
- 1.4 Base estimates and calculations
- 1.4.1 Base year calculation
- 1.4.2 Key trends for market estimation
- 1.5 Primary research and validation
- 1.5.1 Primary sources
- 1.6 Forecast model
- 1.7 Research assumptions and limitations
Chapter 2 Executive Summary
- 2.1 Industry 360° synopsis
- 2.2 Key market trends
- 2.2.1 Regional trends
- 2.2.2 Age group trends
- 2.2.3 Material trends
- 2.2.4 Distribution channel trends
- 2.3 CXO perspectives: Strategic imperatives
- 2.3.1 Key decision points for industry executives
- 2.3.2 Critical success factors for market players
- 2.4 Future outlook and strategic recommendations
Chapter 3 Industry Insights
- 3.1 Industry ecosystem analysis
- 3.2 Industry impact forces
- 3.2.1 Growth drivers
- 3.2.1.1 Increasing prevalence of malocclusion and dental disorders.
- 3.2.1.2 Rising demand for aesthetic and discreet orthodontic solutions.
- 3.2.1.3 Advancements in technology
- 3.2.1.4 Expanding awareness and acceptance among adults and teens.
- 3.2.2 Industry pitfalls & challenges
- 3.2.2.1 High treatment costs limiting affordability in price-sensitive markets.
- 3.2.3 Market opportunities
- 3.2.3.1 Surge in e-commerce and direct-to-consumer orthodontic models
- 3.2.3.2 Expansion into emerging markets
- 3.2.1 Growth drivers
- 3.3 Growth potential analysis
- 3.4 Reimbursement scenario
- 3.5 Regulatory landscape
- 3.6 Technological landscape
- 3.6.1 Current technologies
- 3.6.2 Emerging technologies
- 3.7 Future market trends
- 3.8 Value chain analysis
- 3.9 Consumer behavior analysis
- 3.10 Brand analysis
- 3.11 Start-up scenario
- 3.12 Investment landscape
- 3.13 Pricing analysis, 2024
- 3.14 Porter's analysis
- 3.15 PESTEL analysis
- 3.16 Gap analysis
Chapter 4 Competitive Landscape, 2024
- 4.1 Introduction
- 4.2 Company matrix analysis
- 4.3 Company market share analysis
- 4.3.1 North America
- 4.3.2 Europe
- 4.3.3 Asia Pacific
- 4.3.4 LAMEA
- 4.4 Competitive analysis of major market players
- 4.5 Competitive positioning matrix
- 4.6 Key developments
- 4.6.1 Mergers & acquisitions
- 4.6.2 Partnerships & collaborations
- 4.6.3 New product launches
- 4.6.4 Expansion plans
Chapter 5 Market Estimates and Forecast, By Age Group, 2021 - 2034 ($ Mn, Units)
- 5.1 Key trends
- 5.2 Adults
- 5.3 Teens
Chapter 6 Market Estimates and Forecast, By Materials, 2021 - 2034 ($ Mn, Units)
- 6.1 Key trends
- 6.2 Polyurethane
- 6.3 Plastic polyethylene terephthalate glycol (PETG)
- 6.4 Other materials
Chapter 7 Market Estimates and Forecast, By Distribution Channel, 2021 - 2034 ($ Mn, Units)
- 7.1 Key trends
- 7.2 Orthodontist direct
- 7.3 General dentist
- 7.4 Direct-to-consumer
Chapter 8 Market Estimates and Forecast, By Region, 2021 - 2034 ($ Mn, Units)
- 8.1 Key trends
- 8.2 North America
- 8.2.1 U.S.
- 8.2.2 Canada
- 8.3 Europe
- 8.3.1 Germany
- 8.3.2 UK
- 8.3.3 France
- 8.3.4 Spain
- 8.3.5 Italy
- 8.3.6 Netherlands
- 8.4 Asia Pacific
- 8.4.1 China
- 8.4.2 Japan
- 8.4.3 India
- 8.4.4 Australia
- 8.4.5 South Korea
- 8.5 Latin America
- 8.5.1 Brazil
- 8.5.2 Mexico
- 8.5.3 Argentina
- 8.6 Middle East and Africa
- 8.6.1 South Africa
- 8.6.2 Saudi Arabia
- 8.6.3 UAE
Chapter 9 Company Profiles
- 9.1 3M
- 9.2 align
- 9.3 angle aligner
- 9.4 ASO International, Inc.
- 9.5 BIOSAFIN
- 9.6 DenMat
- 9.7 DentCare
- 9.8 Dentsply Sirona
- 9.9 Envista
- 9.10 GENIOVA
- 9.11 K LINE
- 9.12 KRISTELLE Klear Aligners
- 9.13 makeO
- 9.14 novoalign
- 9.15 straumann

