
PUBLISHER: Global Market Insights Inc. | PRODUCT CODE: 1892836

PUBLISHER: Global Market Insights Inc. | PRODUCT CODE: 1892836
Pet Insurance Market Opportunity, Growth Drivers, Industry Trend Analysis, and Forecast 2026 - 2035
The Global Pet Insurance Market was valued at USD 14.2 billion in 2025 and is estimated to grow at a CAGR of 12.8% to reach USD 46.8 billion by 2035.
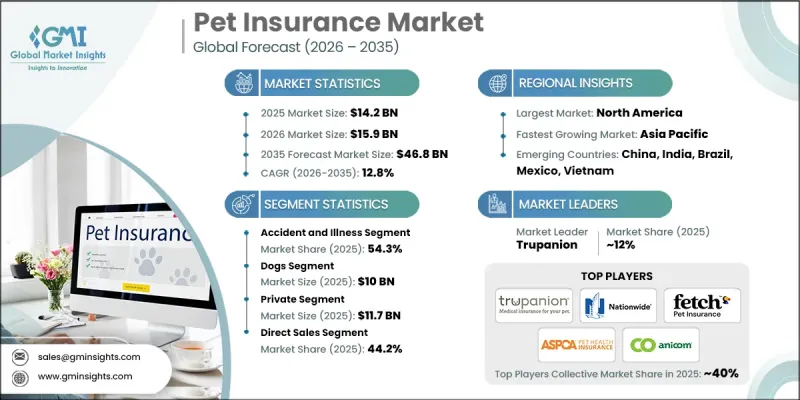
The market expansion is driven by the increasing number of pet owners worldwide, growing awareness of rising veterinary care expenses, and the ongoing trend of pet humanization. These factors are prompting pet owners to seek financial protection against unexpected medical costs, fueling the adoption of pet insurance. Pet insurance provides coverage for veterinary treatments, including illness, accidents, surgeries, and preventive care, helping owners manage costs and ensuring better healthcare for their pets. As veterinary expenses continue to rise and consumer demand for customizable plans grows, insurance providers are innovating their offerings with wellness add-ons, telehealth services, and flexible reimbursement options. Leading insurers, such as Trupanion, Nationwide, and Petplan, are pivotal in expanding digital platforms, strengthening distribution networks, and improving customer engagement, supporting sustained growth in this evolving market.
| Market Scope | |
|---|---|
| Start Year | 2025 |
| Forecast Year | 2026-2035 |
| Start Value | $14.2 Billion |
| Forecast Value | $46.8 Billion |
| CAGR | 12.8% |
The basic wellness care segment is expected to grow at a CAGR of 13.1% during 2026-2035. Growth is driven by rising demand for preventive services, including vaccinations, routine check-ups, and dental care, aligning with the increasing trend of proactive pet health management and cost-effective recurring care.
The dogs segment generated USD 10 billion in 2025 and is anticipated to grow at a CAGR of 12.7% from 2026 to 2035. Dogs dominate the market due to their large global population and the significant cultural emphasis on canine health. They are more susceptible to lifestyle-related illnesses and hereditary conditions, including joint, heart, and weight-related issues, which increases long-term care costs and drives insurance adoption.
North America Pet Insurance Market held a 39.6% share in 2025. The region benefits from high pet ownership, increased awareness of pet healthcare, and widespread adoption of comprehensive insurance plans. Countries such as the U.S. and Canada exhibit significant insurance penetration due to elevated veterinary costs and a cultural trend toward treating pets as family members. The region's digital-first insurers and well-established distribution networks further support market growth.
Key players in the Pet Insurance Market include Trupanion, Nationwide, Petplan, Anicom, ASPCA Pet Health Insurance, Embrace Pet Insurance Agency, Fetch by The Dodo, Figo Pet Insurance, Hartville Group, Health for Pet, Hollard, Lemonade Insurance, Petfirst Healthcare, ProtectaPet, Royal & Sun Alliance, Spot Pet Insurance, and The Oriental Insurance Company. Companies in the Global Pet Insurance Market are strengthening their presence by expanding digital platforms for seamless policy management and telehealth integration, improving customer experience and engagement. Strategic partnerships with veterinary clinics enhance distribution networks and credibility. Providers are diversifying product portfolios with wellness plans, preventive care packages, and flexible reimbursement models to cater to different pet owner segments. Investments in targeted marketing campaigns and loyalty programs increase brand recognition and retention, while data analytics and AI-powered underwriting enable better risk assessment and pricing strategies, ensuring competitive positioning and sustainable growth.
Table of Contents
Chapter 1 Methodology and Scope
- 1.1 Market scope and definition
- 1.2 Research design
- 1.2.1 Research approach
- 1.2.2 Data collection methods
- 1.3 Data mining sources
- 1.3.1 Global
- 1.3.2 Regional/Country
- 1.4 Base estimates and calculations
- 1.4.1 Base year calculation
- 1.4.2 Key trends for market estimation
- 1.5 Primary research and validation
- 1.5.1 Primary sources
- 1.6 Forecast model
- 1.7 Research assumptions and limitations
Chapter 2 Executive Summary
- 2.1 Industry 3600 synopsis
- 2.2 Key market trends
- 2.2.1 Regional trends
- 2.2.2 Policy coverage trends
- 2.2.3 Animal trends
- 2.2.4 Insurance provider trends
- 2.2.5 Sales channel trends
- 2.3 CXO perspectives: Strategic imperatives
- 2.3.1 Key decision points for industry executives
- 2.3.2 Critical success factors for market players
- 2.4 Future outlook and strategic recommendations
Chapter 3 Industry Insights
- 3.1 Industry ecosystem analysis
- 3.2 Industry impact forces
- 3.2.1 Growth drivers
- 3.2.1.1 Rising pet ownership globally
- 3.2.1.2 Rising veterinary care cost
- 3.2.1.3 Growing trend of pet humanization
- 3.2.1.4 Increasing awareness of pet insurance
- 3.2.2 Industry pitfalls and challenges
- 3.2.2.1 High premiums and limited coverage options
- 3.2.2.2 Lack of standardized pet health codes for reimbursement
- 3.2.3 Market opportunities
- 3.2.3.1 Integration of telehealth and wellness add-ons
- 3.2.3.2 Expansion into emerging markets
- 3.2.1 Growth drivers
- 3.3 Growth potential analysis
- 3.4 Technology landscape
- 3.4.1 Current technological trends
- 3.4.2 Emerging technologies
- 3.5 Regulatory landscape
- 3.5.1 North America
- 3.5.2 Europe
- 3.5.3 Asia Pacific
- 3.6 Pet population statistics
- 3.6.1 Dog population, by country
- 3.6.2 Cat population, by country
- 3.7 Pricing analysis of top 10 insurers, by animals
- 3.7.1 Cats
- 3.7.1.1 Pricing analysis of top 10 insurers, by cats
- 3.7.1.2 Cost of popular cat breed
- 3.7.2 Dogs
- 3.7.2.1 Pricing analysis of top 10 insurers, by dogs
- 3.7.2.2 Cost of popular dog breed
- 3.7.1 Cats
- 3.8 Common condition/illness
- 3.8.1 Cats
- 3.8.2 Dogs
- 3.9 Consumer demographic analysis
- 3.9.1 Gender
- 3.9.2 Household income
- 3.9.3 Household pet ownership
- 3.10 Average insurance premium, 2021 - 2025
- 3.11 Pet insurance penetration rate, 2025
- 3.12 Reimbursement process for claim settlement
- 3.13 Trends and penetration rate of employers offering pet insurance
- 3.14 Distribution channel analysis
- 3.15 Porter's analysis
- 3.16 PESTEL analysis
Chapter 4 Competitive Landscape, 2025
- 4.1 Introduction
- 4.2 Company market share analysis
- 4.3 Company matrix analysis
- 4.4 Competitive analysis of major market players
- 4.5 Competitive positioning matrix
- 4.6 Key developments
- 4.6.1 Merger and acquisition
- 4.6.2 Partnership and collaboration
- 4.6.3 New product launches
- 4.6.4 Expansion plans
Chapter 5 Market Estimates and Forecast, By Policy Coverage, 2022 - 2035 ($ Mn)
- 5.1 Key trends
- 5.2 Accident only
- 5.3 Accident and illness
- 5.4 Basic wellness care
- 5.5 Other policy coverages
Chapter 6 Market Estimates and Forecast, By Animal, 2022 - 2035 ($ Mn)
- 6.1 Key trends
- 6.2 Cats
- 6.3 Dogs
- 6.4 Other animals
Chapter 7 Market Estimates and Forecast, By Insurance Provider, 2022 - 2035 ($ Mn)
- 7.1 Key trends
- 7.2 Public
- 7.3 Private
Chapter 8 Market Estimates and Forecast, By Sales Channel, 2022 - 2035 ($ Mn)
- 8.1 Key trends
- 8.2 Direct sales
- 8.3 Agency sales
- 8.4 Broker sales
- 8.5 Bancassurance
- 8.6 Other sale channels
Chapter 9 Market Estimates and Forecast, By Region, 2022 - 2035 ($ Mn)
- 9.1 Key trends
- 9.2 North America
- 9.2.1 U.S.
- 9.2.2 Canada
- 9.3 Europe
- 9.3.1 Germany
- 9.3.2 UK
- 9.3.3 France
- 9.3.4 Spain
- 9.3.5 Italy
- 9.4 Asia Pacific
- 9.4.1 China
- 9.4.2 India
- 9.4.3 Japan
- 9.4.4 Australia
- 9.4.5 South Korea
- 9.5 Latin America
- 9.5.1 Brazil
- 9.5.2 Mexico
- 9.5.3 Argentina
- 9.6 Middle East and Africa
- 9.6.1 South Africa
- 9.6.2 Saudi Arabia
- 9.6.3 UAE
Chapter 10 Company Profiles
- 10.1 Anicom
- 10.2 ASPCA Pet Health Insurance
- 10.3 Embrace Pet Insurance Agency
- 10.4 Fetch by The Dodo
- 10.5 Figo Pet Insurance
- 10.6 Hartville Group
- 10.7 Health for Pet
- 10.8 Hollard
- 10.9 Lemonade Insurance
- 10.10 Nationwide
- 10.11 Petfirst Healthcare
- 10.12 Petplan
- 10.13 ProtectaPet
- 10.14 Royal & Sun Alliance
- 10.15 Spot Pet Insurance
- 10.16 The Oriental Insurance Company
- 10.17 Trupanion

