
PUBLISHER: Global Market Insights Inc. | PRODUCT CODE: 1892762

PUBLISHER: Global Market Insights Inc. | PRODUCT CODE: 1892762
Edge Computing Market Opportunity, Growth Drivers, Industry Trend Analysis, and Forecast 2026 - 2035
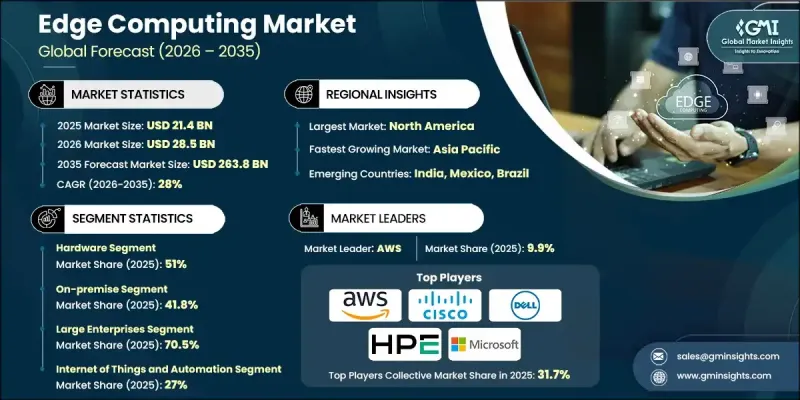
The Global Edge Computing Market was valued at USD 21.4 billion in 2025 and is estimated to grow at a CAGR of 28% to reach USD 263.8 billion by 2035.
Businesses are increasingly shifting from centralized IT infrastructures to distributed processing models, making edge computing essential for real-time data processing at the device level. Industry analysts project that nearly 180 ZB of new data will be generated worldwide by 2025, driving the need for localized computing rather than relying solely on distant cloud or data center resources. Edge computing is enabling industries such as manufacturing and industrial automation to achieve enhanced operational visibility, predictive maintenance, and reduced downtime. Telecommunications providers are rapidly expanding Multi-Access Edge Computing (MEC) infrastructure to support rising demands for high-speed data and video traffic, while industrial organizations continue to invest in IoT-enabled facilities to optimize production and operational efficiency across distributed networks.
| Market Scope | |
|---|---|
| Start Year | 2025 |
| Forecast Year | 2026-2035 |
| Start Value | $21.4 Billion |
| Forecast Value | $263.8 Billion |
| CAGR | 28% |
In 2025, the hardware segment held a 51% share and is expected to grow at a CAGR of 26.5% through 2035. The rising number of connected devices, projected to reach 29 billion globally by 2030, is driving demand for processing units, storage modules, and network hardware at the point of use. Software platforms are also set to expand rapidly due to the growing need for real-time analytics, orchestration systems, and cybersecurity tools across edge networks.
The on-premises segment accounted for a 41.8% share in 2025 and is growing at a CAGR of 24.3% from 2026 to 2035, as localized infrastructure adoption increases across industries, leveraging IIoT, production line optimization, and real-time asset monitoring.
United States Edge Computing Market held an 87% share, generating USD 7 billion in 2025. The expansion of 5G services in the US is driving edge compute adoption across sectors such as transportation, manufacturing, healthcare, and public safety. Companies are increasingly implementing predictive maintenance, automation, and asset monitoring technologies to improve operational efficiency and reduce downtime.
Key players operating in the Global Edge Computing Market include Intel, IBM, Dell, HPE, Microsoft, Cisco, AWS, Oracle, NVIDIA, and Google Cloud. Companies in the Global Edge Computing Market are strengthening their position by investing heavily in R&D to develop high-performance hardware, secure software platforms, and integrated edge-to-cloud solutions. Strategic partnerships and collaborations with telecom providers and industrial IoT vendors allow them to expand deployment networks and reach diverse verticals. Firms offer managed services, low-latency computing solutions, and scalable-edge infrastructure to attract enterprise clients. Additionally, innovation in AI-driven analytics, real-time monitoring, and orchestration platforms enables companies to differentiate themselves and create long-term customer loyalty while addressing increasing demand for localized computing solutions across multiple industries.
Table of Contents
Chapter 1 Methodology
- 1.1 Market scope and definition
- 1.2 Research design
- 1.2.1 Research approach
- 1.2.2 Data collection methods
- 1.3 Data mining sources
- 1.3.1 Global
- 1.3.2 Regional/Country
- 1.4 Base estimates and calculations
- 1.4.1 Base year calculation
- 1.4.2 Key trends for market estimation
- 1.5 Primary research and validation
- 1.5.1 Primary sources
- 1.6 Forecast model
- 1.7 Research assumptions and limitations
Chapter 2 Executive Summary
- 2.1 Industry 360° synopsis, 2022 - 2035
- 2.2 Key market trends
- 2.2.1 Regional
- 2.2.2 Component
- 2.2.3 Deployment
- 2.2.4 Organization Size
- 2.2.5 Application
- 2.2.6 End Use
- 2.3 TAM Analysis, 2026-2035
- 2.4 CXO perspectives: Strategic imperatives
- 2.4.1 Executive decision points
- 2.4.2 Critical success factors
- 2.5 Future outlook and strategic recommendations
Chapter 3 Industry Insights
- 3.1 Industry ecosystem analysis
- 3.1.1 Supplier landscape
- 3.1.2 Profit margin analysis
- 3.1.3 Cost structure
- 3.1.4 Value addition at each stage
- 3.1.5 Factor affecting the value chain
- 3.1.6 Disruptions
- 3.2 Industry impact forces
- 3.2.1.1 Growth drivers
- 3.2.1.2 Rising adoption of real time data processing
- 3.2.1.3 Expansion of industrial Internet of Things
- 3.2.1.4 Growth in multi-access edge deployments
- 3.2.1.5 Increase in analytics-based workloads
- 3.2.2 Industry pitfalls and challenges
- 3.2.2.1 High infrastructure and integration costs
- 3.2.2.2 Limited standardization across vendors
- 3.2.3 Market opportunities
- 3.2.3.1 Growth in smart city projects
- 3.2.3.2 Expansion of private enterprise networks
- 3.2.3.3 Advancement in artificial intelligence at the edge
- 3.3 Growth potential analysis
- 3.4 Regulatory landscape
- 3.4.1 North America
- 3.4.1.1 Federal communications commission (FCC) guidelines
- 3.4.1.2 National institute of standards and technology (NIST) cybersecurity framework
- 3.4.1.3 Data privacy and protection regulations
- 3.4.2 Europe
- 3.4.2.1 EU data protection regulations
- 3.4.2.2 GDPR compliance for edge systems
- 3.4.2.3 EU AI act
- 3.4.2.4 Cybersecurity act
- 3.4.2.5 EU digital services regulations
- 3.4.3 Asia Pacific
- 3.4.3.1 China cybersecurity law
- 3.4.3.2 Personal information protection law (PIPL)
- 3.4.3.3 Data security law
- 3.4.3.4 India IT act and digital rules
- 3.4.3.5 Japan act on the protection of personal information (APPI)
- 3.4.4 Latin America
- 3.4.4.1 Brazil general data protection law (LGPD)
- 3.4.4.2 Argentina personal data protection act
- 3.4.4.3 Mexico federal law on protection of personal data
- 3.4.5 Middle East & Africa
- 3.4.5.1 UAE data protection law
- 3.4.5.2 Saudi national cybersecurity authority regulations
- 3.4.5.3 South Africa protection of personal information act (POPIA)
- 3.4.1 North America
- 3.5 Porter's analysis
- 3.6 PESTEL analysis
- 3.7 Technology and innovation landscape
- 3.7.1 Current technological trends
- 3.7.2 Emerging technologies
- 3.8 Pricing analysis
- 3.8.1 By region
- 3.8.2 By product
- 3.9 Cost breakdown analysis
- 3.9.1 Hardware and edge device costs
- 3.9.2 Software and platform licensing costs
- 3.9.3 Operational and maintenance costs
- 3.9.4 Regulatory compliance and security costs
- 3.9.5 Connectivity and energy costs
- 3.10 Patent analysis
- 3.11 Sustainability and environmental aspects
- 3.11.1 Sustainable practices
- 3.11.2 Waste reduction strategies
- 3.11.3 Energy efficiency in production
- 3.11.4 Eco-friendly Initiatives
- 3.11.5 Carbon footprint considerations
- 3.12 Use cases
- 3.13 Best case scenarios
- 3.14 Investment and funding landscape
- 3.14.1 Venture capital and private equity trends in edge computing
- 3.14.2 Government grants and incentives for edge deployments
- 3.14.3 Investment hotspots by region and sector
Chapter 4 Competitive Landscape, 2025
- 4.1 Introduction
- 4.2 Company market share analysis
- 4.2.1 North America
- 4.2.2 Europe
- 4.2.3 Asia Pacific
- 4.2.4 LATAM
- 4.2.5 MEA
- 4.3 Competitive analysis of major market players
- 4.4 Competitive positioning matrix
- 4.5 Strategic outlook matrix
- 4.6 Key developments
- 4.6.1 Mergers & acquisitions
- 4.6.2 Partnerships & collaborations
- 4.6.3 New Product Launches
- 4.6.4 Expansion Plans and funding
Chapter 5 Market Estimates & Forecast, By Component, 2022 2035 (USD Mn)
- 5.1 Key trends
- 5.2 Hardware
- 5.2.1 Edge Servers
- 5.2.2 Networking Equipment
- 5.2.3 Storage Devices
- 5.3 Software
- 5.3.1 Edge Computing Platform
- 5.3.2 Application Software
- 5.4 Services
- 5.4.1 Professional services
- 5.4.2 Managed services
Chapter 6 Market Estimates & Forecast, By Deployment, 2022 - 2035 (USD Mn)
- 6.1 Key trends
- 6.2 On-premise
- 6.3 Cloud-based
- 6.4 Hybrid
Chapter 7 Market Estimates & Forecast, By Organization Size, 2022 - 2035 (USD Mn)
- 7.1 Key trends
- 7.2 Large Enterprises
- 7.3 Small & Medium Enterprises (SMEs)
Chapter 8 Market Estimates & Forecast, By Application, 2022 - 2035 (USD Mn)
- 8.1 Key trends
- 8.2 Industrial IoT & Automation
- 8.3 Smart Cities
- 8.4 Video Surveillance & Analytics
- 8.5 Content Delivery
- 8.6 Augmented Reality (AR) & Virtual Reality (VR)
- 8.7 Autonomous & Connected Vehicles
- 8.8 Remote Monitoring
- 8.9 Smart Retail
- 8.10 Telemedicine & Healthcare Edge
- 8.11 Others
Chapter 9 Market Estimates & Forecast, By End Use, 2022 - 2035 (USD Mn)
- 9.1 Key trends
- 9.2 BFSI
- 9.3 Energy & Utilities
- 9.4 Telecommunication & IT
- 9.5 Healthcare
- 9.6 Retail & E-commerce
- 9.7 Media & Entertainment
- 9.8 Government & Public Sector
- 9.9 Automotive
- 9.10 Manufacturing
- 9.11 Agriculture
- 9.12 Others
Chapter 10 Market Estimates & Forecast, By Region, 2022 - 2035 (USD Mn)
- 10.1 Key trends
- 10.2 North America
- 10.2.1 US
- 10.2.2 Canada
- 10.3 Europe
- 10.3.1 Germany
- 10.3.2 UK
- 10.3.3 France
- 10.3.4 Italy
- 10.3.5 Spain
- 10.3.6 Russia
- 10.3.7 Nordics
- 10.3.8 Netherlands
- 10.3.9 Sweden
- 10.4 Asia Pacific
- 10.4.1 China
- 10.4.2 India
- 10.4.3 Japan
- 10.4.4 Australia
- 10.4.5 South Korea
- 10.4.6 Singapore
- 10.4.7 Thailand
- 10.4.8 Indonesia
- 10.4.9 Vietnam
- 10.5 Latin America
- 10.5.1 Brazil
- 10.5.2 Mexico
- 10.5.3 Argentina
- 10.6 MEA
- 10.6.1 South Africa
- 10.6.2 Saudi Arabia
- 10.6.3 UAE
- 10.6.4 Turkey
Chapter 11 Company Profiles
- 11.1 Global Players
- 11.1.1 AWS
- 11.1.2 Cisco
- 11.1.3 Dell
- 11.1.4 Google Cloud
- 11.1.5 HPE
- 11.1.6 IBM
- 11.1.7 Intel
- 11.1.8 Microsoft
- 11.1.9 NVIDIA
- 11.1.10 Oracle
- 11.2 Regional Players
- 11.2.1 Atos
- 11.2.2 Fujitsu
- 11.2.3 Huawei
- 11.2.4 NEC
- 11.2.5 ZTE
- 11.3 Emerging Players / Disruptors
- 11.3.1 Avassa
- 11.3.2 ClearBlade
- 11.3.3 Edge Impulse
- 11.3.4 Hailo
- 11.3.5 Vapor IO
- 11.3.6 ZEDEDA

