
PUBLISHER: Global Market Insights Inc. | PRODUCT CODE: 1698569

PUBLISHER: Global Market Insights Inc. | PRODUCT CODE: 1698569
Electric Vehicle Charging Station Market Opportunity, Growth Drivers, Industry Trend Analysis, and Forecast 2025-2034
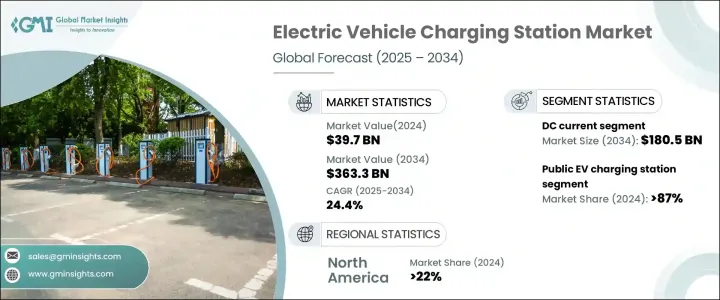
The Global Electric Vehicle Charging Station Market reached USD 39.7 billion in 2024 and is projected to grow at a CAGR of 24.4% from 2025 to 2034. The rapid adoption of electric vehicles, supportive government policies, and advancements in charging technologies are key drivers of this growth. Increasing demand for fast-charging infrastructure is prompting automakers and energy providers to collaborate on large-scale charging networks.
Governments worldwide are expanding incentives and subsidies to accelerate deployment. Regulatory initiatives are shaping the industry by mandating widespread charging infrastructure. The integration of IoT and artificial intelligence optimizes load management and enhances grid integration. However, interoperability remains a significant challenge due to diverse charging standards and protocols across different regions. The industry is also shifting toward renewable energy integration, with many charging stations incorporating solar power and battery storage to improve sustainability.
| Market Scope | |
|---|---|
| Start Year | 2024 |
| Forecast Year | 2025-2034 |
| Start Value | $39.7 Billion |
| Forecast Value | $363.3 Billion |
| CAGR | 24.4% |
The market for electric vehicle charging stations stood at USD 25.7 billion in 2022 and USD 30.7 billion in 2023 before reaching USD 39.7 billion in 2024. The segment includes AC and DC charging, with DC charging dominating the market and expected to surpass USD 180.5 billion by 2034. The transition toward DC fast charging is accelerating, particularly in commercial and highway applications. These chargers significantly reduce charging time, making them ideal for long-distance travel and commercial fleets. However, the high cost of deploying DC fast chargers remains a barrier due to expensive equipment, advanced grid integration, and infrastructure requirements. The estimated investment for a single DC fast charging station ranges between USD 62,160 and USD 248,640.
AC charging, while slower, remains crucial for residential and workplace use due to affordability and widespread availability. Approximately 80% of electric vehicle charging occurs at home, making AC chargers essential for daily commuting. Level 1 and Level 2 AC chargers are widely used in households, offices, and public areas. Public AC charging stations must meet a minimum output power requirement of 7.4 kW.
Public charging stations accounted for over 87% of the market share in 2024 and are expected to grow at more than 26% annually until 2034. Expansion efforts are particularly focused on urban areas, highways, and commercial centers to support the increasing EV fleet. Charging point installations have surged in recent years, alleviating range anxiety and facilitating long-distance travel. The funding landscape for public charging infrastructure is evolving, with significant investments from both governments and private entities. The U.S. government has committed USD 5 billion to expand EV charging infrastructure through 2026.
Despite these advancements, challenges persist, including high installation costs, land acquisition expenses, and grid capacity limitations. Installation costs for fast-charging stations vary between USD 20,836 and USD 104,180. Residential and workplace charging remains the preferred choice due to cost-effectiveness, with home charging being up to 50% cheaper than public stations. Ongoing technological advancements, including automated billing, smart grid integration, and interoperability requirements, will enhance the efficiency of EV charging networks. By 2025, all public charging stations will be required to comply with interoperability regulations, ensuring seamless access for EV users.
North America held over 22% of the market revenue in 2024, with its share expected to increase further by 2034. The U.S. EV charging station market grew from USD 400 million in 2022 to USD 500 million in 2023 and USD 700 million in 2024. Federal and state-level funding initiatives are fueling this growth. The National Electric Vehicle Infrastructure Formula Program allocates USD 5 billion to develop an interconnected charging network across all states. The U.S. government has committed USD 7.5 billion to building a nationwide EV charging infrastructure of 500,000 chargers, ensuring a robust and accessible network for electric vehicle users.
Table of Contents
Chapter 1 Methodology & Scope
- 1.1 Market scope & definitions
- 1.2 Market estimates & forecast parameters
- 1.3 Forecast calculation
- 1.4 Data sources
- 1.4.1 Primary
- 1.4.2 Secondary
- 1.4.2.1 Paid
- 1.4.2.2 Public
Chapter 2 Executive Summary
- 2.1 Industry synopsis, 2021 - 2034
Chapter 3 Industry Insights
- 3.1 Industry ecosystem analysis
- 3.2 Regulatory landscape
- 3.3 Industry impact forces
- 3.3.1 Growth drivers
- 3.3.2 Industry pitfalls & challenges
- 3.4 Growth potential analysis
- 3.5 Porter's analysis
- 3.5.1 Bargaining power of suppliers
- 3.5.2 Bargaining power of buyers
- 3.5.3 Threat of new entrants
- 3.5.4 Threat of substitutes
- 3.6 PESTEL analysis
Chapter 4 Competitive Landscape, 2024
- 4.1 Introduction
- 4.2 Strategic outlook
- 4.3 Innovation & sustainability landscape
Chapter 5 Market Size and Forecast, By Current, 2021 – 2034 (Units, USD Billion)
- 5.1 Key trends
- 5.2 AC
- 5.2.1 Level 1
- 5.2.2 Level 2
- 5.3 DC
- 5.3.1 DC Fast
- 5.3.2 Others
Chapter 6 Market Size and Forecast, By Charging Site, 2021 – 2034 (Units, USD Billion)
- 6.1 Key trends
- 6.2 Public
- 6.3 Private
Chapter 7 Market Size and Forecast, By Region, 2021 – 2034 (Units, USD Billion)
- 7.1 Key trends
- 7.2 North America
- 7.2.1 U.S.
- 7.2.2 Canada
- 7.2.3 Mexico
- 7.3 Europe
- 7.3.1 Norway
- 7.3.2 Germany
- 7.3.3 France
- 7.3.4 Netherlands
- 7.3.5 UK
- 7.3.6 Sweden
- 7.4 Asia Pacific
- 7.4.1 China
- 7.4.2 Japan
- 7.4.3 India
- 7.4.4 South Korea
- 7.4.5 Singapore
- 7.5 Middle East & Africa
- 7.5.1 Saudi Arabia
- 7.5.2 UAE
- 7.5.3 South Africa
- 7.6 Latin America
- 7.6.1 Brazil
- 7.6.2 Argentina
Chapter 8 Company Profiles
- 8.1 ABB
- 8.2 Blink Charging
- 8.3 CHAEVI
- 8.4 ChargePoint
- 8.5 Delta Electronics
- 8.6 Eaton
- 8.7 Elli
- 8.8 EVBox
- 8.9 GreenWay Infrastructure
- 8.10 Hyundai Motor
- 8.11 Leviton Manufacturing
- 8.12 NIO
- 8.13 Nissan Motor
- 8.14 Schneider Electric
- 8.15 Siemens
- 8.16 SK Signet
- 8.17 Tesla
- 8.18 VinFast
- 8.19 Volta
- 8.20 Zunder

