
PUBLISHER: Global Market Insights Inc. | PRODUCT CODE: 1755347

PUBLISHER: Global Market Insights Inc. | PRODUCT CODE: 1755347
SCR Power Controller Market Opportunity, Growth Drivers, Industry Trend Analysis, and Forecast 2025 - 2034
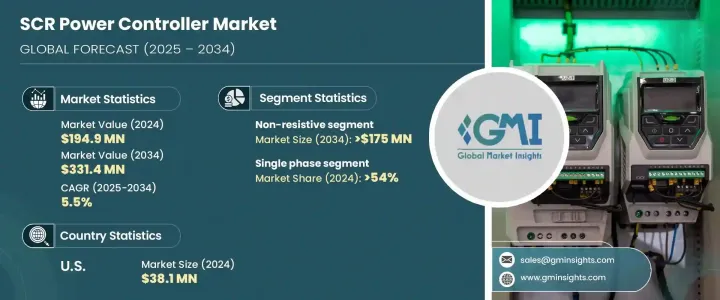
The Global SCR Power Controller Market was valued at USD 194.9 million in 2024 and is estimated to grow at a CAGR of 5.5% to reach USD 331.4 million by 2034. This upward trend is largely driven by the growing emphasis on energy efficiency and the expanding integration of automation technologies across industrial operations. Companies are increasingly relying on automation to boost productivity, streamline workflows, and achieve greater precision in process control. These shifts are playing a critical role in shaping the future of power regulation systems like SCR controllers.
Regulatory bodies are also introducing stricter mandates to improve industrial performance, which is prompting manufacturers to invest in modern solutions. These controllers, known for their precise thermal management, are gaining popularity as they align with stringent energy usage policies. Additionally, innovations in semiconductor materials and efficient production practices are helping lower manufacturing costs while enhancing controller functionality. The improved integration of SCR controllers with automation systems is optimizing operational efficiency and power control, which further supports market expansion.
| Market Scope | |
|---|---|
| Start Year | 2024 |
| Forecast Year | 2025-2034 |
| Start Value | $194.9 Million |
| Forecast Value | $331.4 Million |
| CAGR | 5.5% |
The evolving demand dynamics are not just limited to system performance. With industrial sectors embracing smart technologies, the need for responsive and adaptable power controllers is intensifying. Companies are adapting to this environment by adopting solutions that allow better management of power loads and ensure continuous operation without thermal inefficiencies. The market is also witnessing increased interest from manufacturers who aim to future-proof their infrastructure by incorporating intelligent, energy-optimized control systems.
Based on load type, the market is categorized into resistive and non-resistive segments. Among these, the non-resistive segment is gaining significant traction and is expected to exceed USD 175 million in revenue by 2034. This growth is influenced by the continual expansion of industrial operations and heightened investment in automation infrastructure. In an environment where speed, precision, and energy savings are paramount, non-resistive SCR controllers are becoming an integral component in diverse industrial applications.
From a phase-based perspective, the market is divided into single-phase and three-phase systems. The single-phase segment currently leads the industry, holding a dominant market share of over 54% in 2024. This segment is anticipated to grow steadily throughout the forecast period due to its widespread usage in compact industrial setups and low-to-medium power applications. The development of small-scale manufacturing units, especially in developing economies, is providing new growth avenues for single-phase controllers.
As industrial growth accelerates in both emerging and established economies, the rising demand for components with low current ratings is expected to further bolster market adoption. At the same time, shifting consumer preferences, fueled by higher disposable incomes and increased demand for packaged and processed goods, are amplifying the need for automated solutions across manufacturing sectors. These trends are paving the way for higher deployment of SCR power controllers, which are known for delivering reliable and consistent thermal regulation.
In terms of regional performance, the SCR power controller market in the United States is showing consistent growth. It was valued at USD 35.3 million in 2022, rose to USD 36.7 million in 2023, and reached USD 38.1 million in 2024. The market outlook remains positive due to growing industrial investments and a strong emphasis on process optimization. Various sectors-including chemicals, semiconductors, pharmaceuticals, and food production-are increasingly relying on modern control systems to meet the dual objectives of product quality and operational efficiency. The move toward precise heating solutions is reinforcing the adoption of SCR controllers.
The pressure to meet energy efficiency benchmarks and reduce carbon emissions is pushing manufacturers to replace traditional heating systems with more advanced SCR-based alternatives. This shift is particularly evident in North America, where industrial users are modernizing their operations to align with sustainability goals. The regional market is evolving quickly as businesses prioritize automation and digitization in response to global transformation trends.
Leading manufacturers are actively pursuing innovation strategies to maintain their competitive edge in the SCR power controller market. These strategies include technological upgrades, automation integration, and customer-centric product development. As digital transformation accelerates, artificial intelligence and machine learning are beginning to play a larger role in the automation of power control systems. These technologies are helping companies analyze complex data and optimize performance parameters in real time. Industries such as semiconductor processing, industrial heating, and chemical manufacturing are poised to benefit from these advancements, further solidifying the market's long-term growth prospects.
Table of Contents
Chapter 1 Methodology & Scope
- 1.1 Market definitions
- 1.2 Base estimates & calculations
- 1.3 Forecast calculation
- 1.4 Data sources
- 1.4.1 Primary
- 1.4.2 Secondary
- 1.4.2.1 Paid
- 1.4.2.2 Public
Chapter 2 Executive Summary
- 2.1 Industry synopsis, 2021 - 2034
Chapter 3 Industry Insights
- 3.1 Industry ecosystem analysis
- 3.2 Regulatory landscape
- 3.3 Industry impact forces
- 3.3.1 Growth drivers
- 3.3.2 Industry pitfalls & challenges
- 3.4 Growth potential analysis
- 3.5 Porter's analysis
- 3.5.1 Bargaining power of suppliers
- 3.5.2 Bargaining power of buyers
- 3.5.3 Threat of new entrants
- 3.5.4 Threat of substitutes
- 3.6 PESTEL analysis
Chapter 4 Competitive Landscape, 2025
- 4.1 Introduction
- 4.2 Company market share analysis, 2024
- 4.3 Strategic initiative
- 4.4 Competitive benchmarking
- 4.5 Strategic dashboard
- 4.6 Innovation & sustainability landscape
Chapter 5 Market Size and Forecast, By Load, 2021 - 2034, (USD Million)
- 5.1 Key trends
- 5.2 Resistive
- 5.3 Non-resistive
Chapter 6 Market Size and Forecast, By Phase, 2021 - 2034, (USD Million)
- 6.1 Key trends
- 6.2 Single phase
- 6.3 Three phase
Chapter 7 Market Size and Forecast, By Control method, 2021 - 2034, (USD Million)
- 7.1 Key trends
- 7.2 Integrated cycle switching
- 7.3 Phase angle control
Chapter 8 Market Size and Forecast, By Current rating, 2021 - 2034, (USD Million)
- 8.1 Key trends
- 8.2 ≤ 50 A
- 8.3 > 50 A to 500 A
- 8.4 > 500 A to 1,000 A
- 8.5 ≥ 1,000 A
Chapter 9 Market Size and Forecast, By End Use, 2021 - 2034, (USD Million)
- 9.1 Key trends
- 9.2 Semiconductor
- 9.3 Food & beverages
- 9.4 Metals
- 9.5 Plastics
- 9.6 Glass
- 9.7 Oil & gas
- 9.8 Others
Chapter 10 Market Size and Forecast, By Region, 2021 - 2034, (USD Million)
- 10.1 Key trends
- 10.2 North America
- 10.2.1 U.S.
- 10.2.2 Canada
- 10.2.3 Mexico
- 10.3 Europe
- 10.3.1 Germany
- 10.3.2 France
- 10.3.3 UK
- 10.3.4 Italy
- 10.3.5 Spain
- 10.3.6 Turkey
- 10.4 Asia Pacific
- 10.4.1 China
- 10.4.2 India
- 10.4.3 Japan
- 10.4.4 Australia
- 10.4.5 South Korea
- 10.5 Middle East & Africa
- 10.5.1 UAE
- 10.5.2 Saudi Arabia
- 10.5.3 Egypt
- 10.5.4 Nigeria
- 10.5.5 South Africa
- 10.6 Latin America
- 10.6.1 Brazil
- 10.6.2 Argentina
- 10.6.3 Chile
Chapter 11 Company Profiles
- 11.1 ABB
- 11.2 Advanced Energy
- 11.3 Ametek
- 11.4 Avatar Instruments
- 11.5 Cd Automation
- 11.6 Chromalox
- 11.7 Control Concepts
- 11.8 Eurotherm
- 11.9 Gefran
- 11.10 Gino
- 11.11 Jumo Process Control
- 11.12 Lumel
- 11.13 Omron
- 11.14 Reo
- 11.15 RKC Instrument
- 11.16 Sichuan Yingjie Electric
- 11.17 Siemens
- 11.18 Spang Power Electronics
- 11.19 Vishay Intertechnology
- 11.20 Watlow Electric Manufacturing

