
PUBLISHER: Global Market Insights Inc. | PRODUCT CODE: 1833679

PUBLISHER: Global Market Insights Inc. | PRODUCT CODE: 1833679
U.S. Home Infusion Therapy Market Opportunity, Growth Drivers, Industry Trend Analysis, and Forecast 2025 - 2034
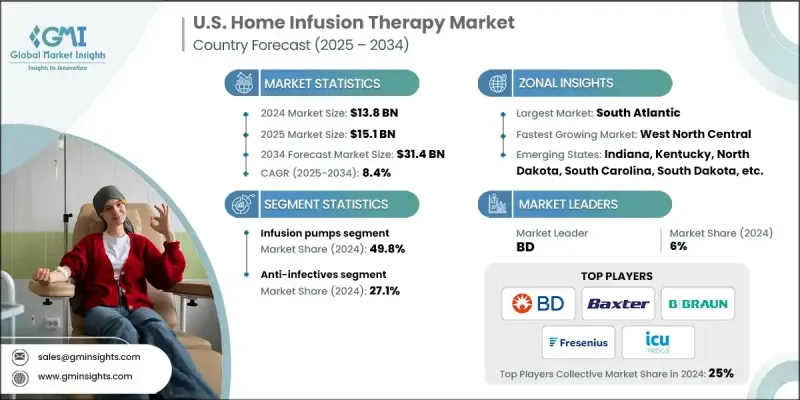
U.S. home infusion therapy market was estimated at USD 13.8 billion in 2024 and is expected to grow from USD 15.1 billion in 2025 to USD 31.4 billion by 2034, at a CAGR of 8.4%, according to the latest report published by Global Market Insights Inc.
Chronic illnesses such as cancer, diabetes, congestive heart failure, and immune deficiencies are on the rise in the U.S. Many of these conditions require long-term or recurring infusion therapies, making home infusion a more convenient and cost-effective option for patients.
| Market Scope | |
|---|---|
| Start Year | 2024 |
| Forecast Year | 2025-2034 |
| Start Value | $13.8 Billion |
| Forecast Value | $31.4 Billion |
| CAGR | 8.4% |
Rising Adoption of the Infusion Pumps Segment
The infusion pumps segment in the U.S. home infusion therapy market held a significant share in 2024, driven by the growing demand for controlled and precise drug delivery in home care settings. These devices offer convenience, safety, and automation, making them especially valuable for chronic conditions requiring long-term infusion, such as cancer or autoimmune diseases. With technological innovations focusing on portability, wireless monitoring, and integration with electronic health records, the infusion pump segment has seen a noticeable uptick in adoption.
Increasing Demand for Anti-Infectives
The anti-infectives segment generated sustainable revenues in 2024, owing to the high incidence of infections that require intravenous antibiotic treatment. This segment includes a range of therapies targeting bacterial, fungal, and viral infections, often administered to patients recovering from surgery or managing complex infections like osteomyelitis and sepsis. The convenience of receiving anti-infective therapy at home not only reduces hospital stays but also improves patient compliance.
South Atlantic to Emerge as a Lucrative Region
South Atlantic home infusion therapy market held a substantial share in 2024, fueled by a large aging population, a high prevalence of chronic diseases, and a well-established healthcare infrastructure that supports home-based services. Increasing awareness about the benefits of home infusion, along with favorable insurance coverage in this region, has further propelled market adoption.
Prominent players operating in the U.S. home infusion therapy industry include DAIWHA, TERUMO, MOOG, AMSINO, ICU Medical, BD, CONTEC, AVANOS, B. Braun, JMS, McKESSON, LEPU MEDICAL, Fresenius, ERENLER MEDIKAL, Baxter.
To strengthen their foothold in the U.S. home infusion therapy market, companies are deploying a mix of strategic initiatives focused on both organic growth and partnerships. Many players are expanding their service portfolios through the integration of advanced infusion devices and remote monitoring solutions that improve patient outcomes and operational efficiency. Acquisitions and mergers have also played a key role, allowing firms to broaden their geographic reach and gain access to established referral networks. Additionally, providers are investing in staff training, home care logistics, and compliance infrastructure to meet evolving regulatory standards. Customizing treatment plans and offering patient-centric care have further helped differentiate their services in a competitive market landscape.
Table of Contents
Chapter 1 Methodology and Scope
- 1.1 Market scope and definition
- 1.2 Research design
- 1.2.1 Research approach
- 1.2.2 Data collection methods
- 1.3 Data mining sources
- 1.3.1 Country
- 1.3.2 Zonal/State
- 1.4 Base estimates and calculations
- 1.4.1 Base year calculation
- 1.4.2 Key trends for market estimation
- 1.5 Primary research and validation
- 1.5.1 Primary sources
- 1.6 Forecast model
- 1.7 Research assumptions and limitations
Chapter 2 Executive Summary
- 2.1 Industry 360° synopsis
- 2.2 Key market trends
- 2.2.1 Zonal trends
- 2.2.2 Product trends
- 2.2.3 Application trends
- 2.3 CXO perspectives: Strategic imperatives
- 2.3.1 Key decision points for industry executives
- 2.3.2 Critical success factors for market players
- 2.4 Future outlook and strategic recommendations
Chapter 3 Industry Insights
- 3.1 Industry ecosystem analysis
- 3.2 Industry impact forces
- 3.2.1 Growth drivers
- 3.2.1.1 Growing hospital acquired infections
- 3.2.1.2 Rising prevalence of chronic diseases
- 3.2.1.3 Advancements in technology
- 3.2.1.4 Growing geriatric population
- 3.2.1.5 Increasing preference towards at-home healthcare solutions
- 3.2.2 Industry pitfalls and challenges
- 3.2.2.1 Safety concerns and risk of failure associated with home infusion devices
- 3.2.3 Market opportunities
- 3.2.3.1 Increasing adoption of intravenous immunoglobulin (IVIG) therapy
- 3.2.3.2 Growing demand for personalized care
- 3.2.1 Growth drivers
- 3.3 Growth potential analysis
- 3.4 Regulatory landscape
- 3.5 Technology and innovation landscape
- 3.5.1 Current technological trends
- 3.5.2 Emerging technologies
- 3.5.2.1 Smart infusion devices and automation
- 3.5.2.2 Remote monitoring and telehealth integration
- 3.5.2.3 Wearable and portable infusion technologies
- 3.6 Reimbursement scenario
- 3.6.1 Impact of reimbursement policies on market growth
- 3.7 Pricing analysis, by zone, 2024
- 3.8 List of key hospitals/clinics offering home infusion therapy
- 3.9 Number of home infusion therapy patients, by age, 2021 - 2024
- 3.9.1 0 - 16
- 3.9.2 17 - 29
- 3.9.3 30 - 49
- 3.9.4 50 - 64
- 3.9.5 65+
- 3.10 Trends in home infusion therapy industry
- 3.11 Consumer behaviour analysis
- 3.12 Investment landscape
- 3.13 Epidemiological scenario
- 3.14 Porter's analysis
- 3.15 PESTEL analysis
- 3.16 Gap analysis
- 3.17 Future prospects for home infusion therapy industry
Chapter 4 Competitive Landscape, 2024
- 4.1 Introduction
- 4.2 Company market share analysis
- 4.3 Company matrix analysis
- 4.4 Competitive analysis of major market players
- 4.5 Competitive positioning matrix
- 4.6 Key developments
- 4.6.1 Mergers and acquisitions
- 4.6.2 Partnerships and collaborations
- 4.6.3 New product launches
- 4.6.4 Expansion plans
Chapter 5 Market Estimates and Forecast, By Product, 2021 - 2034 ($ Mn)
- 5.1 Key trends
- 5.2 Infusion pumps
- 5.3 Intravenous sets
- 5.4 IV cannulas
- 5.5 Needleless connectors
Chapter 6 Market Estimates and Forecast, By Application, 2021 - 2034 ($ Mn)
- 6.1 Key trends
- 6.2 Anti-infectives
- 6.3 Hydration therapy
- 6.4 Chemotherapy
- 6.5 Enteral nutrition
- 6.6 Parenteral nutrition
- 6.7 Specialty pharmaceuticals
- 6.8 Other applications
Chapter 7 Market Estimates and Forecast, By Zone, 2021 - 2034 ($ Mn)
- 7.1 Key trends
- 7.2 East North Central
- 7.2.1 Illinois
- 7.2.2 Indiana
- 7.2.3 Michigan
- 7.2.4 Ohio
- 7.2.5 Wisconsin
- 7.3 West South Central
- 7.3.1 Arkansas
- 7.3.2 Louisiana
- 7.3.3 Oklahoma
- 7.3.4 Texas
- 7.4 South Atlantic
- 7.4.1 Delaware
- 7.4.2 Florida
- 7.4.3 Georgia
- 7.4.4 Maryland
- 7.4.5 North Carolina
- 7.4.6 South Carolina
- 7.4.7 Virginia
- 7.4.8 West Virginia
- 7.4.9 Washington, D.C.
- 7.5 Northeast
- 7.5.1 Connecticut
- 7.5.2 Maine
- 7.5.3 Massachusetts
- 7.5.4 New Hampshire
- 7.5.5 Rhode Island
- 7.5.6 Vermont
- 7.5.7 New Jersey
- 7.5.8 New York
- 7.5.9 Pennsylvania
- 7.6 East South Central
- 7.6.1 Alabama
- 7.6.2 Kentucky
- 7.6.3 Mississippi
- 7.6.4 Tennessee
- 7.7 West North Central
- 7.7.1 Iowa
- 7.7.2 Kansas
- 7.7.3 Minnesota
- 7.7.4 Missouri
- 7.7.5 Nebraska
- 7.7.6 North Dakota
- 7.7.7 South Dakota
- 7.8 Pacific Central
- 7.8.1 Alaska
- 7.8.2 California
- 7.8.3 Hawaii
- 7.8.4 Oregon
- 7.8.5 Washington
- 7.9 Mountain States
- 7.9.1 Arizona
- 7.9.2 Colorado
- 7.9.3 Utah
- 7.9.4 Nevada
- 7.9.5 New Mexico
- 7.9.6 Idaho
- 7.9.7 Montana
- 7.9.8 Wyoming
Chapter 8 Company Profiles
- 8.1 Key players
- 8.1.1 B. Braun
- 8.1.2 Baxter
- 8.1.3 BD
- 8.1.4 Fresenius
- 8.1.5 ICU Medical
- 8.1.6 LEPU MEDICAL
- 8.1.7 McKESSON
- 8.1.8 MOOG
- 8.1.9 TERUMO
- 8.2 Emerging players
- 8.2.1 AMSINO
- 8.2.2 AVANOS
- 8.2.3 CONTEC
- 8.2.4 DAIWHA
- 8.2.5 ERENLER MEDIKAL
- 8.2.6 JMS

