
PUBLISHER: Global Market Insights Inc. | PRODUCT CODE: 1667200

PUBLISHER: Global Market Insights Inc. | PRODUCT CODE: 1667200
Activated Carbon Fiber (ACF) Market Opportunity, Growth Drivers, Industry Trend Analysis, and Forecast 2025 - 2034
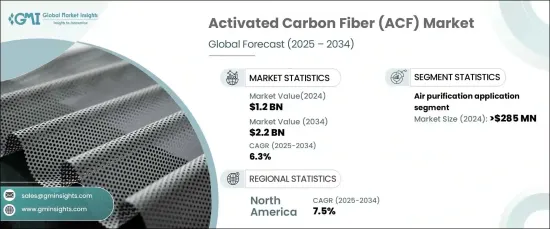
The Global Activated Carbon Fiber Market reached USD 1.2 billion in 2024 and is projected to grow at a CAGR of 6.3% between 2025 and 2034. The rising focus on water treatment, driven by strict government regulations and increasing public health concerns, is fueling market growth. With rapid industrialization and dwindling water resources, the need for effective wastewater treatment solutions is more critical than ever. Contaminants from industrial and domestic sources, including solid, liquid, and gaseous pollutants, pose significant environmental risks, which further accelerates demand for ACF-based solutions.
Polyacrylonitrile (PAN) based ACF is expected to witness robust growth owing to its superior tensile strength and versatility. As a thermoplastic semi-crystalline polymer, PAN undergoes processes such as carbonization, controlled activation, and stabilization to produce high-quality ACF. Its durability and efficiency make it ideal for applications such as capacitors, catalyst carriers, and filtration systems. The increasing need for catalyst carriers, combined with advancements in supercapacitor technologies, is further driving demand for PAN-based materials.
| Market Scope | |
|---|---|
| Start Year | 2024 |
| Forecast Year | 2025-2034 |
| Start Value | $1.2 Billion |
| Forecast Value | $2.2 Billion |
| CAGR | 6.3% |
Air purification applications accounted for significant revenue in 2024, highlighting the growing importance of ACF in addressing air quality concerns. Global air pollution regulations are prompting industries to adopt advanced filtration technologies, with ACF filters proving effective in absorbing pollutants like nitrogen oxides (NOx). The adoption of ACF-based air filtration systems across sectors such as transportation, industrial units, and residential settings is contributing significantly to market expansion.
North America is anticipated to record notable growth, with a projected CAGR of 7.5% through 2034. The region's thriving chemical and petroleum industries are key drivers for ACF demand, particularly for chemical recovery and solvent purification systems. Increasing investments in environmental protection, coupled with a shift toward sustainable solutions, further bolster adoption. The U.S. remains a major consumer of ACF, particularly in water treatment and air purification applications. The presence of established manufacturers and extensive distribution networks across North America further strengthens the market outlook.
The activated carbon fiber market is set to expand steadily, driven by environmental concerns, advancements in material technologies, and the growing adoption of sustainable industrial solutions. The rising need for efficient water and air treatment systems across industries positions ACF as a critical component in achieving environmental and regulatory compliance globally.
Table of Contents
Chapter 1 Methodology & Scope
- 1.1 Market scope & definition
- 1.2 Base estimates & calculations
- 1.3 Forecast calculation
- 1.4 Data sources
- 1.4.1 Primary
- 1.4.2 Secondary
- 1.4.2.1 Paid sources
- 1.4.2.2 Public sources
Chapter 2 Executive Summary
- 2.1 Industry synopsis, 2021-2034
Chapter 3 Industry Insights
- 3.1 Industry ecosystem analysis
- 3.1.1 Factor affecting the value chain
- 3.1.2 Profit margin analysis
- 3.1.3 Disruptions
- 3.1.4 Future outlook
- 3.1.5 Manufacturers
- 3.1.6 Distributors
- 3.2 Supplier landscape
- 3.3 Profit margin analysis
- 3.4 Key news & initiatives
- 3.5 Regulatory landscape
- 3.6 Impact forces
- 3.6.1 Growth drivers
- 3.6.1.1 North America: Increasing demand for wastewater treatment
- 3.6.1.2 Europe: Emerging application of activated carbon fiber in air purification
- 3.6.1.3 Asia Pacific: Increasing environmental concerns related to air and water pollution
- 3.6.2 Industry pitfalls & challenges
- 3.6.2.1 High product cost and fluctuation in raw material availability
- 3.6.1 Growth drivers
- 3.7 Growth potential analysis
- 3.8 Porter’s analysis
- 3.9 PESTEL analysis
Chapter 4 Competitive Landscape, 2024
- 4.1 Introduction
- 4.2 Company market share analysis
- 4.3 Competitive positioning matrix
- 4.4 Strategic outlook matrix
Chapter 5 Market Size and Forecast, By Material, 2021-2034 (USD Billion) (Kilo Tons)
- 5.1 Key trends
- 5.2 Cellulose based
- 5.3 Polyacrylonitrile (PAN) based
- 5.4 Phenolic resin based
- 5.5 Pitch based
- 5.6 Others
Chapter 6 Market Size and Forecast, By Application, 2021-2034 (USD Billion) (Kilo Tons)
- 6.1 Key trends
- 6.2 Air purification
- 6.3 Water treatment
- 6.4 Chemical recovery
- 6.5 Catalyst carrier
- 6.6 Others
Chapter 7 Market Size and Forecast, By Region, 2021-2034 (USD Billion) (Kilo Tons)
- 7.1 Key trends
- 7.2 North America
- 7.2.1 U.S.
- 7.2.2 Canada
- 7.3 Europe
- 7.3.1 UK
- 7.3.2 Germany
- 7.3.3 France
- 7.3.4 Italy
- 7.3.5 Spain
- 7.3.6 Russia
- 7.4 Asia Pacific
- 7.4.1 China
- 7.4.2 India
- 7.4.3 Japan
- 7.4.4 South Korea
- 7.4.5 Australia
- 7.5 Latin America
- 7.5.1 Brazil
- 7.5.2 Mexico
- 7.6 MEA
- 7.6.1 South Africa
- 7.6.2 Saudi Arabia
- 7.6.3 UAE
Chapter 8 Company Profiles
- 8.1 Anshan Sinocarb Carbon Fibers
- 8.2 Awa Paper & Technological Company
- 8.3 Evertech Envisafe Ecology
- 8.4 Gun Ei Chemical Industry
- 8.5 Hangzhou Nature Technology
- 8.6 HP Materials Solutions
- 8.7 Jiangsu Kejing Carbon Fiber
- 8.8 Jiangsu Sutong Carbon Fiber
- 8.9 Jiangsu Tongkang Activated Carbon Fiber
- 8.10 Kuraray
- 8.11 OJSC – Open Joint Stock Company
- 8.12 Osaka Gas Chemical
- 8.13 Toyobo
- 8.14 Unitika

