
PUBLISHER: Global Market Insights Inc. | PRODUCT CODE: 1913465

PUBLISHER: Global Market Insights Inc. | PRODUCT CODE: 1913465
Asia Pacific Ceramic Fiber Market Opportunity, Growth Drivers, Industry Trend Analysis, and Forecast 2026 - 2035
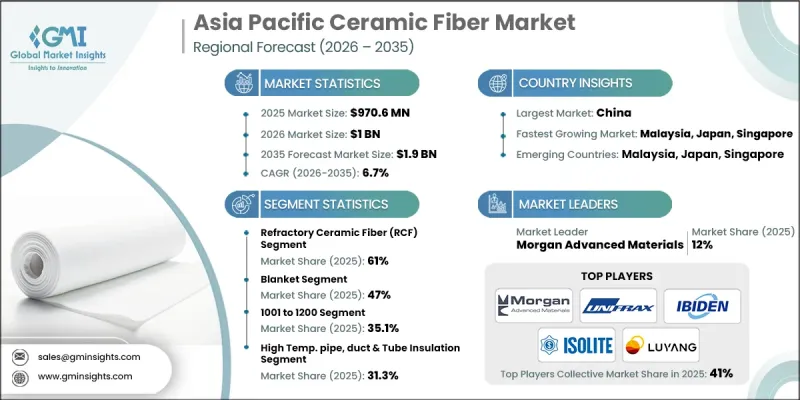
Asia Pacific Ceramic Fiber Market was valued at USD 970.6 million in 2025 and is estimated to grow at a CAGR of 6.7% to reach USD 1.9 billion by 2035.
Manufacturers are increasingly adopting ceramic fibers over traditional dense refractories to reduce heat loss, optimize fuel usage, and comply with decarbonization initiatives. The region is transitioning from conventional refractory ceramic fibers (RCF) to low-bio-persistent alternatives such as alkaline earth silicate (AES) and polycrystalline wool (PCW), driven by stringent occupational health and safety regulations in countries including Japan, South Korea, and China. Energy efficiency, retrofitting of furnaces and kilns, and faster thermal cycling are key factors fueling the adoption of lightweight ceramic fiber linings, reflecting the growing emphasis on sustainable and efficient industrial operations across the region.
| Market Scope | |
|---|---|
| Start Year | 2025 |
| Forecast Year | 2026-2035 |
| Start Value | $970.6 Million |
| Forecast Value | $1.9 Billion |
| CAGR | 6.7% |
The refractory ceramic fiber (RCF) segment accounted for 61% share in 2025 and is expected to grow at a CAGR of 6.1% through 2035. While the industry increasingly favors AES and PCW for new installations, high-purity RCF remains critical for legacy furnaces and chemically aggressive environments in steel, glass, and petrochemical industries. RCF with zirconia offers particularly high-temperature resistance, making it indispensable for challenging industrial conditions.
Among product forms, the blankets segment held 47% share in 2025, projected to grow at a CAGR of 6.3% through 2035. Blankets are preferred for furnace, kiln, and duct linings due to ease of handling, fast installation, and adaptability for retrofits. For large continuous process furnaces, modules are increasingly specified for their prefabricated, anchored systems, which enhance alignment, improve lining integrity, reduce hot spots, and enable predictable maintenance cycles.
China Ceramic Fiber Market generated USD 340.9 million in 2025. The country's extensive industrial base in steel, cement, glass, and petrochemicals, along with ongoing efficiency upgrades and energy-saving policies, drives adoption of blankets, modules, and high-spec AES and PCW products.
Key companies operating in the Asia Pacific Ceramic Fiber Market include Morgan Advanced Materials, Unifrax LLC, Luyang Energy-Saving Materials Co., Ltd., IBIDEN Co., Ltd., Isolite Insulating Products Co., Ltd., RATH Group, Nutec Group, Toshiba Materials Co., Ltd., Thermo Ceramic Fibres, Yeso Insulating Products Co., Ltd., HarbisonWalker International, and Hiltex Semi Products B.V. To strengthen their presence, companies in the Asia Pacific Ceramic Fiber Market are focusing on expanding production capacities and upgrading product offerings to meet stricter safety and environmental regulations. Strategic investments in research and development enable the introduction of AES and PCW products with higher thermal performance and energy efficiency. Firms are also pursuing collaborations with industrial clients for customized solutions, offering installation support and retrofitting services.
Table of Contents
Chapter 1 Methodology & Scope
- 1.1 Market scope and definition
- 1.2 Research design
- 1.2.1 Research approach
- 1.2.2 Data collection methods
- 1.3 Data mining sources
- 1.3.1 Asia Pacific
- 1.3.2 Country
- 1.4 Base estimates and calculations
- 1.4.1 Base year calculation
- 1.4.2 Key trends for market estimation
- 1.5 Primary research and validation
- 1.5.1 Primary sources
- 1.6 Forecast model
- 1.7 Research assumptions and limitations
Chapter 2 Executive Summary
- 2.1 Industry 3600 synopsis
- 2.2 Key market trends
- 2.2.1 Regional
- 2.2.2 Product
- 2.2.3 Form
- 2.2.4 Temperature
- 2.2.5 Application
- 2.3 TAM Analysis, 2026-2035
- 2.4 CXO perspectives: Strategic imperatives
- 2.4.1 Executive decision points
- 2.4.2 Critical success factors
- 2.5 Future Outlook and Strategic Recommendations
Chapter 3 Industry Insights
- 3.1 Industry ecosystem analysis
- 3.1.1 Supplier landscape
- 3.1.2 Profit margin
- 3.1.3 Value addition at each stage
- 3.1.4 Factor affecting the value chain
- 3.1.5 Disruptions
- 3.2 Industry impact forces
- 3.2.1 Growth drivers
- 3.2.1.1 Rapid industrialization in metals and cement
- 3.2.1.2 Rising energy costs and efficiency regulations
- 3.2.1.3 Growth in petrochemical and power generation base
- 3.2.2 Industry pitfalls and challenges
- 3.2.2.1 Health, safety and environmental compliance risks
- 3.2.2.2 Volatile alumina and silica raw material prices
- 3.2.3 Market opportunities
- 3.2.3.1 Industrial decarbonization and waste-heat recovery projects
- 3.2.3.2 Expansion of high-spec AES and PCW products
- 3.2.1 Growth drivers
- 3.3 Growth potential analysis
- 3.4 Regulatory landscape
- 3.4.1 China
- 3.4.2 India
- 3.4.3 Japan
- 3.4.4 Australia
- 3.4.5 Others
- 3.5 Porter's analysis
- 3.6 PESTEL analysis
- 3.7 Price trends
- 3.7.1 By country
- 3.7.2 By Product
- 3.8 Future market trends
- 3.9 Technology and Innovation landscape
- 3.9.1 Current technological trends
- 3.9.2 Emerging technologies
- 3.10 Patent Landscape
- 3.11 Trade statistics (HS code) (Note: the trade statistics will be provided for key countries only)
- 3.11.1 Major importing countries
- 3.11.2 Major exporting countries
- 3.12 Sustainability and environmental aspects
- 3.12.1 Sustainable practices
- 3.12.2 Waste reduction strategies
- 3.12.3 Energy efficiency in production
- 3.12.4 Eco-friendly initiatives
- 3.13 Carbon footprint consideration
Chapter 4 Competitive Landscape, 2025
- 4.1 Introduction
- 4.2 Company market share analysis
- 4.2.1 By Country
- 4.3 Company matrix analysis
- 4.4 Competitive analysis of major market players
- 4.5 Competitive positioning matrix
- 4.6 Key developments
- 4.6.1 Mergers & acquisitions
- 4.6.2 Partnerships & collaborations
- 4.6.3 New Product Launches
- 4.6.4 Expansion Plans
Chapter 5 Market Estimates and Forecast, By Product, 2022-2035 (USD Million) (Kilo Tons)
- 5.1 Key trends
- 5.2 Refractory ceramic fiber (RCF)
- 5.2.1 Standard RCF
- 5.2.2 High-purity RCF
- 5.2.3 Zirconia-containing RCF
- 5.3 Alkaline earth silicate (AES)
- 5.3.1 Low-bio-persistence AES fiber
- 5.3.2 High-temperature AES fiber
- 5.4 Others (PCW)
- 5.4.1 Standard polycrystalline wool
- 5.4.2 High-alumina polycrystalline wool
Chapter 6 Market Estimates and Forecast, By Form, 2022-2035 (USD Million) (Kilo Tons)
- 6.1 Key trends
- 6.2 Blanket
- 6.3 Module
- 6.4 Board
- 6.5 Paper
- 6.6 Others
Chapter 7 Market Estimates and Forecast, By Temperature, 2022-2035 (USD Million) (Kilo Tons)
- 7.1 Key trends
- 7.2 Up to 1000
- 7.3 1001 to 1200
- 7.4 1201 to 1400
- 7.5 Over 1400
Chapter 8 Market Estimates and Forecast, By Application, 2022-2035 (USD Million) (Kilo Tons)
- 8.1 Key trends
- 8.2 Expansion joint fiber barriers
- 8.2.1 Furnace and kiln expansion joints
- 8.2.2 Duct and flue expansion seals
- 8.3 High temperature pipe, duct & tube insulation
- 8.3.1 Process piping insulation
- 8.3.2 Exhaust and flue gas duct insulation
- 8.4 Industry furnace base seal
- 8.4.1 Reheating furnace base seals
- 8.4.2 Heat-treatment furnace base seals
- 8.5 Fire dampers/ceiling diffusers
- 8.6 High temperature gasketing & packing
- 8.7 Others
Chapter 9 Market Estimates and Forecast, By country, 2022-2035 (USD Million) (Kilo Tons)
- 9.1 Key trends
- 9.2 Japan
- 9.3 India
- 9.4 Australia
- 9.5 Indonesia
- 9.6 Malaysia
- 9.7 South Korea
- 9.8 Vietnam
- 9.9 Thailand
- 9.10 Philippines
- 9.11 China
- 9.12 Taiwan
- 9.13 Singapore
- 9.14 Rest of APAC
Chapter 10 Company Profiles
- 10.1 Morgan Advanced Materials
- 10.2 Unifrax LLC
- 10.3 Luyang Energy-Saving Materials Co., Ltd.
- 10.4 IBIDEN Co., Ltd.
- 10.5 Isolite Insulating Products Co., Ltd.
- 10.6 RATH Group
- 10.7 Nutec Group
- 10.8 Toshiba Materials Co., Ltd.
- 10.9 Thermo Ceramic Fibres
- 10.10 Yeso Insulating Products Co., Ltd.
- 10.11 HarbisonWalker International
- 10.12 Hiltex Semi Products B.V.

