
PUBLISHER: Global Market Insights Inc. | PRODUCT CODE: 1801936

PUBLISHER: Global Market Insights Inc. | PRODUCT CODE: 1801936
Computer Vision Systems Market Opportunity, Growth Drivers, Industry Trend Analysis, and Forecast 2025 - 2034
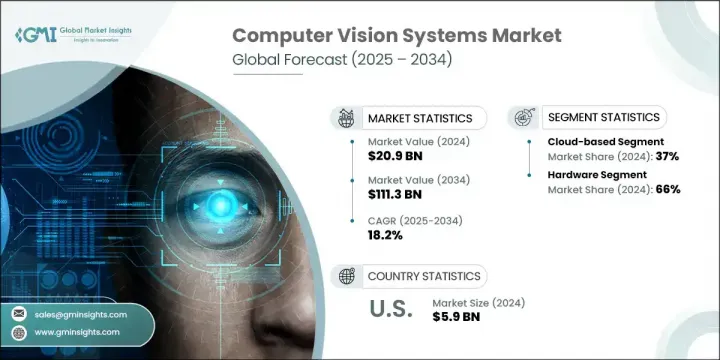
The Global Computer Vision Systems Market was valued at USD 20.9 billion in 2024 and is estimated to grow at a CAGR of 18.2% to reach USD 111.3 billion by 2034. Rapid advances in artificial intelligence, deep learning, and sensor technologies are fueling the expansion of computer vision applications across multiple sectors. Industries such as manufacturing, automotive, and retail are seeing strong adoption of vision systems to improve automation, enhance quality control, and boost safety. Healthcare is utilizing these technologies for diagnostics and patient monitoring, while security is benefiting from real-time threat recognition.
Urban infrastructure management and precision agriculture are also tapping into these systems to streamline operations. In energy and electronics, computer vision helps optimize monitoring and device interactivity. Advanced algorithms now enhance image clarity, transforming low-resolution data into high-resolution outputs, which opens up possibilities for applications that demand high precision, including autonomous navigation and medical diagnostics.
| Market Scope | |
|---|---|
| Start Year | 2024 |
| Forecast Year | 2025-2034 |
| Start Value | $20.9 Billion |
| Forecast Value | $111.3 Billion |
| CAGR | 18.2% |
The rise of Industry 4.0 and smart environments continues to accelerate demand for intelligent visual systems. With the integration of cloud computing, edge processing, and IoT technologies, real-time data analysis and scalability have become accessible to enterprises. Improved machine learning models are also increasing the reliability and performance of these systems.
The cloud-based computer vision platforms held 37% share in 2024 and is anticipated to grow at a CAGR of 19% between 2025 and 2034. Their popularity stems from scalability, cost efficiency, and the ability to deploy complex processing tasks without heavy local infrastructure. Businesses are leveraging the cloud to process visual data at scale, incorporate advanced learning models, and deploy vision tools across diverse environments in a streamlined way.
The hardware segment held 66% share and is expected to grow at a CAGR of 18% through 2034. Essential to the core function of vision systems, hardware components like high-performance cameras, processors, memory, storage, and display units are being customized for various sectors including industrial manufacturing, automotive technologies, and healthcare diagnostics. The combination of artificial intelligence with dedicated hardware is advancing tasks such as facial recognition, automated inspection, and visual tracking.
US Computer Vision Systems Market held 90% share in 2024, contributing USD 5.9 billion. The country benefits from a robust tech ecosystem and early adoption across several high-growth sectors. A surge in applications ranging from autonomous mobility and smart production lines to medical imaging and surveillance has boosted demand. Widespread digital transformation and sophisticated telecom infrastructure further support cloud and edge deployment models. Additionally, the retail space is leveraging vision systems for real-time inventory tracking and personalized user interactions, intensifying automation initiatives across businesses.
The leading players shaping the Global Computer Vision Systems Market include Google, Intel, Teledyne, NVIDIA, Amazon Web Services, Microsoft, and IBM. Major players in the computer vision systems market are focusing on innovation, ecosystem partnerships, and strategic expansion to gain a competitive edge. Companies are channeling investment into research and development to advance AI-driven vision capabilities, particularly for autonomous systems and real-time analytics. Strategic acquisitions are being made to strengthen domain-specific expertise and accelerate product development. Expanding cloud infrastructure and launching edge-compatible vision platforms are helping players reach clients with varying scalability needs. Customization of solutions for key verticals like healthcare, retail, automotive, and manufacturing is another core tactic.
Table of Contents
Chapter 1 Methodology
- 1.1 Market scope and definition
- 1.2 Research design
- 1.2.1 Research approach
- 1.2.2 Data collection methods
- 1.3 Data mining sources
- 1.3.1 Global
- 1.3.2 Regional/Country
- 1.4 Base estimates and calculations
- 1.4.1 Base year calculation
- 1.4.2 Key trends for market estimation
- 1.5 Primary research and validation
- 1.5.1 Primary sources
- 1.6 Forecast model
- 1.7 Research assumptions and limitations
Chapter 2 Executive Summary
- 2.1 Industry 360° synopsis, 2021 - 2034
- 2.2 Key market trends
- 2.2.1 Regional
- 2.2.2 Deployment Mode
- 2.2.3 Component
- 2.2.4 Application
- 2.2.5 Industry vertical
- 2.3 TAM Analysis, 2025-2034
- 2.4 CXO perspectives: Strategic imperatives
- 2.4.1 Executive decision points
- 2.4.2 Critical success factors
- 2.5 Future outlook and strategic recommendations
Chapter 3 Industry Insights
- 3.1 Market introduction and evolution
- 3.1.1 Historical development of computer vision technology
- 3.1.2 Current market landscape
- 3.1.3 Future outlook and emerging trends
- 3.2 Supplier landscape
- 3.2.1 Raw material and component suppliers
- 3.2.2 Hardware manufacturers
- 3.2.3 Software developers
- 3.2.4 System integrators
- 3.2.5 End users
- 3.3 Profit margin analysis
- 3.4 Technology & innovation landscape
- 3.4.1 Deep learning and neural networks
- 3.4.2 3D computer vision
- 3.4.3 Edge AI for computer vision
- 3.4.4 Augmented reality integration
- 3.4.5 Computer vision in display technology
- 3.4.6 Neuromorphic computing for vision applications
- 3.4.7 Quantum computing implications for computer vision
- 3.4.8 Synthetic data generation for training
- 3.5 Display industry-specific computer vision applications
- 3.5.1 Automated optical inspection (AOI) for displays
- 3.5.2 Defect detection in display manufacturing
- 3.5.3 Color calibration and quality control
- 3.5.4 Smart display interaction technologies
- 3.5.5 Computer vision for micro LED and OLED manufacturing
- 3.5.6 In-line process monitoring for display production
- 3.5.7 Panel uniformity assessment systems
- 3.5.8 Automated visual inspection for flexible displays
- 3.6 Industry ecosystem analysis
- 3.6.1 Vendor matrix
- 3.6.2 Distribution channel analysis
- 3.6.3 Strategic partnerships and collaborations
- 3.6.4 Industry associations and consortiums
- 3.6.5 Research and academic institutions
- 3.7 Patent analysis
- 3.7.1 Patent applications and grants by region
- 3.7.2 Key patents in display-related computer vision
- 3.7.3 Patent trend analysis
- 3.7.4 Patent litigation landscape
- 3.7.5 Emerging patent areas in display vision systems
- 3.8 Key news & initiatives
- 3.9 Regulatory landscape
- 3.9.1 Data protection regulations
- 3.9.2 Industry standards for computer vision
- 3.9.3 Regional regulatory landscape
- 3.9.4 Compliance requirements for different verticals
- 3.9.5 Future regulatory developments
- 3.10 Case studies
- 3.10.1 Computer vision in display manufacturing
- 3.10.2 Quality control applications in electronics industry
- 3.10.3 Smart retail implementation success stories
- 3.10.4 Healthcare applications of computer vision
- 3.10.5 Automotive display integration cases
- 3.11 Investment and funding landscape
- 3.11.1 Venture capital investments
- 3.11.2 Private equity funding
- 3.11.3 Corporate investments and M&A activity
- 3.11.4 Government and public funding
- 3.11.5 Investment trends by region
- 3.12 Cost structure analysis
- 3.12.1 Hardware component costs
- 3.12.2 Software development and licensing costs
- 3.12.3 Implementation and integration costs
- 3.12.4 Maintenance and support costs
- 3.12.5 Total cost of ownership analysis
- 3.13 Future technology roadmap
- 3.13.1 Short-term developments (1-2 Years)
- 3.13.2 Medium-term developments (3-5 Years)
- 3.13.3 Long-term developments (5+ Years)
- 3.13.4 Technology convergence opportunities
- 3.14 Industry best practices
- 3.14.1 Development and implementation methodologies
- 3.14.2 Quality assurance and testing frameworks
- 3.14.3 Data management and privacy practices
- 3.14.4 ROI optimization strategies
- 3.15 Market entry strategies
- 3.15.1 New product development
- 3.15.2 Strategic partnerships and alliances
- 3.15.3 Mergers and acquisitions
- 3.15.4 Regional expansion strategies
- 3.16 Sustainability and ESG analysis
- 3.16.1 Environmental impact of computer vision technologies
- 3.16.2 Social implications and ethical considerations
- 3.16.3 Governance and compliance frameworks
- 3.16.4 Sustainable development goals alignment
- 3.17 Impact forces
- 3.17.1 Growth drivers
- 3.17.1.1 Rising demand for quality inspection and automation
- 3.17.1.2 Growing integration of AI and ML technologies
- 3.17.1.3 Increasing applications in smart manufacturing
- 3.17.1.4 Advancements in deep learning algorithms
- 3.17.1.5 Proliferation of edge computing devices
- 3.17.1.6 Growing demand for contactless solutions
- 3.17.2 Industry pitfalls & challenges
- 3.17.2.1 High implementation costs
- 3.17.2.2 Technical complexity and integration challenges
- 3.17.2.3 Data privacy and security concerns
- 3.17.2.4 Limited standardization across industries
- 3.17.2.5 Computational resource requirements
- 3.17.3 Market opportunities
- 3.17.3.1 Integration with edge computing and IoT
- 3.17.3.2 Emerging applications in display manufacturing
- 3.17.3.3 Growth in retail and healthcare sectors
- 3.17.3.4 Expansion in APAC region
- 3.17.3.5 Advancements in sensor technologies
- 3.17.3.6 Cross-industry applications and solutions
- 3.17.4 Market Challenges
- 3.17.4.1 Accuracy and reliability issues
- 3.17.4.2 Skilled workforce shortage
- 3.17.4.3 Regulatory and compliance challenges
- 3.17.4.4 Environmental factors affecting performance
- 3.17.4.5 Scalability and deployment challenges
- 3.17.1 Growth drivers
- 3.18 Growth potential analysis
- 3.19 Porter’s analysis
- 3.20 PESTEL analysis
Chapter 4 Competitive Landscape, 2024
- 4.1 Market share analysis
- 4.1.1 Global market share by key players
- 4.1.2 Regional market share distribution
- 4.1.3 Tier analysis of market players
- 4.2 Competitive benchmarking
- 4.2.1 Product portfolio analysis
- 4.2.2 Business strategy analysis
- 4.2.3 R&D investment comparison
- 4.2.4 Technological capabilities assessment
- 4.3 Strategic initiatives
- 4.3.1 New product launches and innovations
- 4.3.2 Mergers and acquisitions
- 4.3.3 Partnerships and collaborations
- 4.3.4 Expansion strategies
- 4.4 Competitive dashboard
- 4.4.1 Market positioning matrix
- 4.4.2 Performance comparison matrix
- 4.4.3 Strategic developments heatmap
- 4.5 SWOT analysis of key players
- 4.5.1 Strengths and weaknesses analysis
- 4.5.2 Opportunities and threats analysis
- 4.6 Competitive positioning matrix
- 4.6.1 Leaders
- 4.6.2 Challengers
- 4.6.3 Innovators
- 4.6.4 Emerging players
- 4.7 Vendor landscape
- 4.7.1 List of distributors and channel partners
- 4.7.2 Key buying criteria
- 4.7.3 Pricing models and strategies
- 4.8 Display industry-specific competitive analysis
- 4.8.1 Computer vision solutions for display manufacturing
- 4.8.2 Quality control systems providers
- 4.8.3 Smart display technology competitors
Chapter 5 Market Estimates & Forecast, By Deployment Mode, 2021-2034 ($Bn)
- 5.1 Key trends
- 5.2 Cloud-based
- 5.2.1 Public cloud
- 5.2.2 Private cloud
- 5.2.3 Hybrid cloud
- 5.3 On-premises
- 5.3.1 Enterprise deployment
- 5.3.2 Industrial deployment
- 5.4 Edge-based
- 5.4.1 Edge computing devices
- 5.4.2 IoT-integrated systems
- 5.4.3 Smart cameras and sensors
Chapter 6 Market Estimates & Forecast, By Component, 2021-2034 ($Bn)
- 6.1 Key trends
- 6.2 Hardware
- 6.2.1 Cameras And Image Sensors
- 6.2.1.1 Industrial Cameras
- 6.2.1.2 Smart Cameras
- 6.2.1.3 3D Cameras
- 6.2.1.4 Infrared Cameras
- 6.2.2 Processors And Computing Units
- 6.2.2.1 CPUs
- 6.2.2.2 GPUs
- 6.2.2.3 FPGAs
- 6.2.2.4 ASICs
- 6.2.2.5 Edge AI Processors
- 6.2.3 Memory And Storage
- 6.2.4 Display Units
- 6.2.5 Others
- 6.2.1 Cameras And Image Sensors
- 6.3 Software
- 6.3.1 Computer Vision Platforms
- 6.3.2 Deep Learning Frameworks
- 6.3.3 Image Processing Software
- 6.3.4 Analytics Software
- 6.3.5 Custom Applications
- 6.4 Services
- 6.4.1 Professional Services
- 6.4.1.1 Consulting Services
- 6.4.1.2 Integration And Implementation
- 6.4.1.3 Training And Support
- 6.4.2 Managed services
- 6.4.2.1 Cloud-based services
- 6.4.2.2 On-premise services
- 6.4.1 Professional Services
Chapter 7 Market Estimates & Forecast, By Application, 2021-2034 ($Bn)
- 7.1 Key trends
- 7.2 Facial recognition
- 7.2.1 Security and surveillance
- 7.2.2 Access control
- 7.2.3 Emotion recognition
- 7.2.4 Marketing and customer analytics
- 7.3 Image classification
- 7.3.1 Product categorization
- 7.3.2 Content moderation
- 7.3.3 Medical image analysis
- 7.3.4 Industrial classification
- 7.4 Object detection
- 7.4.1 Retail Inventory management
- 7.4.2 Manufacturing defect detection
- 7.4.3 Security applications
- 7.4.4 Autonomous systems
- 7.5 Object tracking
- 7.5.1 Surveillance and security
- 7.5.2 Sports analytics
- 7.5.3 Retail customer tracking
- 7.5.4 Manufacturing process monitoring
- 7.6 Optical Character Recognition (OCR)
- 7.6.1 Document digitization
- 7.6.2 License plate recognition
- 7.6.3 Text recognition in manufacturing
- 7.6.4 Retail applications
- 7.7 Image Segmentation
- 7.7.1 Medical image segmentation
- 7.7.2 Industrial applications
- 7.7.3 Retail applications
- 7.7.4 Autonomous vehicles
- 7.8 Automated optical inspection
- 7.8.1 Display panel inspection
- 7.8.2 PCB inspection
- 7.8.3 Semiconductor inspection
- 7.8.4 Consumer electronics quality control
- 7.9 3D vision and depth sensing
- 7.9.1 Augmented reality applications
- 7.9.2 Robotics and automation
- 7.9.3 Smart manufacturing
- 7.9.4 Automotive applications
- 7.10 Gesture recognition
- 7.10.1 Consumer electronics
- 7.10.2 Automotive HMI
- 7.10.3 Healthcare applications
- 7.10.4 Smart home controls
- 7.11 Others
Chapter 8 Market Estimates & Forecast, By Industry Vertical, 2021-2034 ($Bn)
- 8.1 Key trends
- 8.2 Manufacturing
- 8.2.1 Electronics and semiconductor
- 8.2.1.1 Display manufacturing
- 8.2.1.2 PCB assembly
- 8.2.1.3 Semiconductor production
- 8.2.1.4 Consumer electronics
- 8.2.2 Automotive
- 8.2.3 Aerospace and defense
- 8.2.4 Pharmaceuticals
- 8.2.5 Food and beverage
- 8.2.6 Others
- 8.2.1 Electronics and semiconductor
- 8.3 Healthcare
- 8.3.1 Medical imaging and diagnostics
- 8.3.2 Patient monitoring
- 8.3.3 Surgical assistance
- 8.3.4 Healthcare administration
- 8.3.5 Others
- 8.4 Retail
- 8.4.1 Inventory management
- 8.4.2 Customer analytics
- 8.4.3 Self-checkout systems
- 8.4.4 Digital signage and smart displays
- 8.4.5 Others
- 8.5 Automotive
- 8.5.1 Advanced Driver Assistance Systems (ADAS)
- 8.5.2 Autonomous vehicles
- 8.5.3 In-cabin monitoring
- 8.5.4 Smart cockpit displays
- 8.5.5 Others
- 8.6 Security and surveillance
- 8.6.1 Public safety
- 8.6.2 Retail security
- 8.6.3 Industrial security
- 8.6.4 Residential security
- 8.6.5 Others
- 8.7 Agriculture
- 8.7.1 Crop monitoring
- 8.7.2 Livestock management
- 8.7.3 Precision farming
- 8.7.4 Others
- 8.8 Smart cities
- 8.8.1 Traffic management
- 8.8.2 Public safety
- 8.8.3 Infrastructure monitoring
- 8.8.4 Energy management
- 8.8.5 Others
- 8.9 Consumer electronics
- 8.9.1 Smartphones and tablets
- 8.9.2 Smart TVs and displays
- 8.9.3 AR/VR devices
- 8.9.4 Smart home devices
- 8.9.5 Others
- 8.10 Energy and utilities
- 8.10.1 Power grid monitoring
- 8.10.2 Renewable energy systems
- 8.10.3 Infrastructure inspection
- 8.10.4 Others
- 8.11 Others
Chapter 9 Market Estimates & Forecast, By Region, 2021-2034 ($Bn)
- 9.1 Key trends
- 9.2 North America
- 9.2.1 U.S.
- 9.2.2 Canada
- 9.3 Europe
- 9.3.1 UK
- 9.3.2 Germany
- 9.3.3 France
- 9.3.4 Italy
- 9.3.5 Spain
- 9.3.6 Russia
- 9.3.7 Nordics
- 9.4 Asia Pacific
- 9.4.1 China
- 9.4.2 India
- 9.4.3 Japan
- 9.4.4 South Korea
- 9.4.5 ANZ
- 9.4.6 Southeast Asia
- 9.5 Latin America
- 9.5.1 Brazil
- 9.5.2 Mexico
- 9.5.3 Argentina
- 9.6 MEA
- 9.6.1 South Africa
- 9.6.2 Saudi Arabia
- 9.6.3 UAE
Chapter 10 Company Profiles
- 10.1 Global Technology Leaders
- 10.1.1 NVIDIA
- 10.1.2 Intel
- 10.1.3 Microsoft
- 10.1.4 IBM
- 10.1.5 Google
- 10.1.6 Qualcomm
- 10.1.7 Sony
- 10.2 Industrial Vision and Automation Specialists
- 10.2.1 Cognex
- 10.2.2 Keyence
- 10.2.3 Basler
- 10.2.4 Omron
- 10.2.5 Teledyne
- 10.3 AI and Vision Software Innovators
- 10.3.1 Clarifai
- 10.3.2 Matterport
- 10.3.3 Visionatics
- 10.3.4 SmartCow
- 10.3.5 ZH-AOI
- 10.4 Semiconductor and Component Suppliers
- 10.4.1 MediaTek
- 10.4.2 Himax
- 10.4.3 Renesas Electronics
- 10.4.4 AUO Display Plus (ADP)
- 10.5 Edge Computing and Embedded Vision Companies
- 10.5.1 Aetina
- 10.5.2 Advantech
- 10.5.3 AAEON
- 10.5.4 Neousys

