
PUBLISHER: Global Market Insights Inc. | PRODUCT CODE: 1913360

PUBLISHER: Global Market Insights Inc. | PRODUCT CODE: 1913360
Compression Therapy Market Opportunity, Growth Drivers, Industry Trend Analysis, and Forecast 2026 - 2035
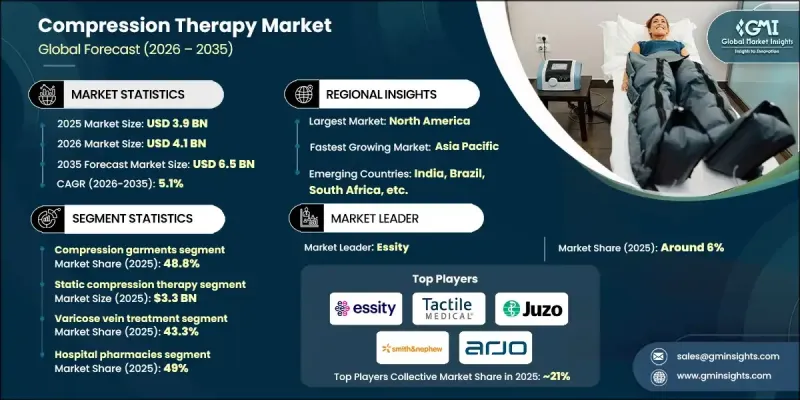
The Global Compression Therapy Market was valued at USD 3.9 billion in 2025 and is estimated to grow at a CAGR of 5.1% to reach USD 6.5 billion by 2035.
The market is fueled by the rising prevalence of venous disorders, increased awareness of available treatment options, and a growing number of sports-related injuries and accidents. Expansion in home healthcare solutions, rising demand for non-invasive therapies, and a surge in orthopedic and post-surgical procedures are further driving growth. Technological innovations in devices, improved materials, and patient-centric designs are enhancing treatment efficacy. Athletes and rehabilitation professionals increasingly prefer compression therapy for faster recovery and improved mobility. As professional and recreational sports participation grows, the adoption of compression solutions for healing, performance, and injury prevention is expected to provide sustained momentum across medical and sports medicine applications globally.
| Market Scope | |
|---|---|
| Start Year | 2025 |
| Forecast Year | 2026-2035 |
| Start Value | $3.9 Billion |
| Forecast Value | $6.5 Billion |
| CAGR | 5.1% |
The compression garments segment held 48.8% share in 2025. These garments, including stockings, sleeves, and tights, provide graduated pressure, highest at the ankle and gradually reducing upward, to enhance blood circulation, reduce swelling, and prevent clot formation. Rising cases of lymphedema, deep vein thrombosis (DVT), and postoperative recovery needs are driving segmental demand. Modern designs emphasize comfort, breathability, and aesthetics, ensuring higher patient compliance and prolonged use.
The static compression therapy segment reached USD 3.3 billion in 2025. This therapy delivers continuous pressure through garments, wraps, or bandages over affected areas, improving lymphatic drainage and blood flow. It is widely applied in chronic venous disorders, post-surgical recovery, and injury rehabilitation to accelerate healing and restore mobility.
North America Compression Therapy Market held 32.1% share in 2025. The region benefits from advanced healthcare infrastructure, strong insurance reimbursement policies, and widespread acceptance of non-invasive treatment options. High prevalence of venous disorders, lymphedema, and DVT, along with an aging population and rising obesity rates, continues to drive demand for compression garments and pneumatic devices in both clinical and home care settings.
Key companies operating in the Global Compression Therapy Market include Tactile Medical, Smith+Nephew, ALCARE, Arjo, Bio Compression Systems, Cardinal Health, ConvaTec, Enovis, Essity, HARTMANN, Juzo, Medi, SANYLEG, SIGVARIS GROUP, and Solventum. Companies in the Global Compression Therapy Market are strengthening their position through several strategic initiatives. They focus on continuous product innovation, integrating smart technologies and advanced materials to improve comfort, durability, and therapeutic effectiveness. Geographic expansion enables access to emerging markets, while collaborations with healthcare providers and rehabilitation centers enhance product adoption. Firms are also emphasizing affordability and customizable solutions to cater to diverse patient needs.
Table of Contents
Chapter 1 Methodology and Scope
- 1.1 Market scope and definition
- 1.2 Research design
- 1.2.1 Research approach
- 1.2.2 Data collection methods
- 1.3 Data mining sources
- 1.3.1 Global
- 1.3.2 Regional/Country
- 1.4 Base estimates and calculations
- 1.4.1 Base year calculation
- 1.4.2 Key trends for market estimation
- 1.5 Primary research and validation
- 1.5.1 Primary sources
- 1.6 Forecast model
- 1.7 Research assumptions and limitations
Chapter 2 Executive Summary
- 2.1 Industry 360° synopsis
- 2.2 Key market trends
- 2.2.1 Regional trends
- 2.2.2 Product trends
- 2.2.3 Technology trends
- 2.2.4 Application trends
- 2.2.5 Distribution channel trends
- 2.3 CXO perspectives: Strategic imperatives
- 2.3.1 Key decision points for industry executives
- 2.3.2 Critical success factors for market players
- 2.4 Future outlook and strategic recommendations
Chapter 3 Industry Insights
- 3.1 Industry ecosystem analysis
- 3.2 Industry impact forces
- 3.2.1 Growth drivers
- 3.2.1.1 Increase in the number of sports injuries and accidents
- 3.2.1.2 Surge in orthopedic and post-surgical procedures
- 3.2.1.3 Rising prevalence of venous disorders
- 3.2.1.4 Growing awareness among patients regarding treatment options
- 3.2.1.5 Recent technological advancements
- 3.2.2 Industry pitfalls and challenges
- 3.2.2.1 Availability of alternative treatments
- 3.2.2.2 Reduced compliance due to wearer discomfort
- 3.2.2.3 Side effects associated with the use of compression therapy
- 3.2.3 Opportunities
- 3.2.3.1 Development of smart textiles and IoT-enabled compression wear
- 3.2.1 Growth drivers
- 3.3 Growth potential analysis
- 3.4 Regulatory landscape
- 3.4.1 North America
- 3.4.2 Europe
- 3.4.3 Asia Pacific
- 3.4.4 LAMEA
- 3.5 Technology and innovation landscape
- 3.5.1 Current technological trends
- 3.5.2 Emerging technologies
- 3.6 Value chain analysis
- 3.7 Reimbursement scenario
- 3.8 Consumer behavioral insights
- 3.9 Pricing analysis
- 3.10 Environmental and sustainability considerations
- 3.11 Policy landscape
- 3.12 Porter's analysis
- 3.13 PESTEL analysis
- 3.14 Gap analysis
- 3.15 Future market trends
Chapter 4 Competitive Landscape, 2025
- 4.1 Introduction
- 4.2 Company matrix analysis
- 4.3 Company market share analysis
- 4.3.1 Global
- 4.3.2 North America
- 4.3.3 Europe
- 4.3.4 Asia Pacific
- 4.3.5 LAMEA
- 4.4 Competitive analysis of major market players
- 4.5 Competitive positioning matrix
- 4.6 Key developments
- 4.6.1 Mergers & acquisitions
- 4.6.2 Partnerships & collaborations
- 4.6.3 New product launches
- 4.6.4 Expansion plans
Chapter 5 Market Estimates and Forecast, By Product, 2022 - 2035 ($ Mn)
- 5.1 Key trends
- 5.2 Compression garments
- 5.2.1 Compression bandages
- 5.2.2 Compression stockings
- 5.2.2.1 Compression class I
- 5.2.2.2 Compression class II
- 5.2.2.3 Compression class III
- 5.2.3 Other compression garments
- 5.3 Compression braces
- 5.4 Compression tapes
- 5.5 Compression pumps
Chapter 6 Market Estimates and Forecast, By Technology, 2022 - 2035 ($ Mn)
- 6.1 Key trends
- 6.2 Static compression therapy
- 6.3 Dynamic compression therapy
Chapter 7 Market Estimates and Forecast, By Application, 2022 - 2035 ($ Mn)
- 7.1 Key trends
- 7.2 Varicose veins treatment
- 7.3 Deep vein thrombosis treatment
- 7.4 Lymphedema treatment
- 7.5 Leg ulcer treatment
- 7.6 Other applications
Chapter 8 Market Estimates and Forecast, By Distribution Channel, 2022 - 2035 ($ Mn)
- 8.1 Key trends
- 8.2 Hospital pharmacies
- 8.3 Retail pharmacies
- 8.4 Online pharmacies
Chapter 9 Market Estimates and Forecast, By Region, 2022 - 2035 ($ Mn)
- 9.1 Key trends
- 9.2 North America
- 9.2.1 U.S.
- 9.2.2 Canada
- 9.3 Europe
- 9.3.1 Germany
- 9.3.2 UK
- 9.3.3 France
- 9.3.4 Spain
- 9.3.5 Italy
- 9.3.6 Netherlands
- 9.4 Asia Pacific
- 9.4.1 China
- 9.4.2 Japan
- 9.4.3 India
- 9.4.4 Australia
- 9.4.5 South Korea
- 9.5 Latin America
- 9.5.1 Brazil
- 9.5.2 Mexico
- 9.5.3 Argentina
- 9.6 MEA
- 9.6.1 South Africa
- 9.6.2 Saudi Arabia
- 9.6.3 UAE
Chapter 10 Company Profiles
- 10.1 ALCARE
- 10.2 Arjo
- 10.3 Bio Compression Systems
- 10.4 Cardinal Health
- 10.5 ConvaTec
- 10.6 Enovis
- 10.7 essity
- 10.8 HARTMANN
- 10.9 Juzo
- 10.10 medi
- 10.11 SANYLEG
- 10.12 SIGVARIS GROUP
- 10.13 Smith+Nephew
- 10.14 Solventum
- 10.15 Tactile Medical

