
PUBLISHER: Global Market Insights Inc. | PRODUCT CODE: 1667005

PUBLISHER: Global Market Insights Inc. | PRODUCT CODE: 1667005
Traction Battery Market Opportunity, Growth Drivers, Industry Trend Analysis, and Forecast 2025 - 2034
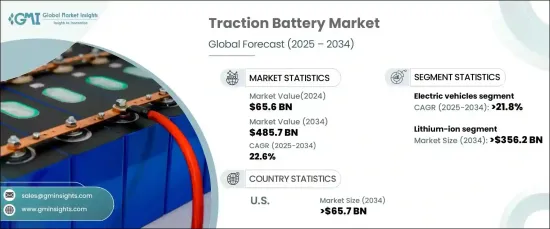
The Global Traction Battery Market, valued at USD 65.6 billion in 2024, is projected to grow at a robust CAGR of 22.6% from 2025 to 2034. Traction batteries are gaining prominence as a critical component of renewable energy systems, especially for their role in enhancing energy efficiency and grid reliability. These batteries support clean energy transitions by serving dual purposes-powering vehicles and acting as energy storage solutions. Their integration is vital for regions focusing on renewable energy infrastructure and sustainable energy management practices.
Advancements in technology are driving the evolution of the traction battery market, with innovations in battery materials and chemistries significantly improving performance. Lithium-ion batteries currently lead the market due to their high energy density, durability, and efficiency. Emerging technologies, such as solid-state batteries, offer enhanced safety features and faster charging, positioning them as a strong alternative for future applications. Manufacturers are also exploring sustainable solutions by developing batteries with silicon anodes and cobalt-free cathodes, which aim to reduce costs and minimize environmental impact.
| Market Scope | |
|---|---|
| Start Year | 2024 |
| Forecast Year | 2025-2034 |
| Start Value | $65.6 Billion |
| Forecast Value | $485.7 Billion |
| CAGR | 22.6% |
By battery chemistry, the lithium-ion segment is expected to experience remarkable growth, reaching a market size of USD 356.2 billion by 2034. This growth is fueled by increasing demand for advanced battery solutions across industries, especially for sustainable energy applications. The superior performance of lithium-ion batteries, combined with ongoing research into cost-efficient and environmentally friendly designs, strengthens their position in the market.
In terms of application, the traction battery market is witnessing significant expansion in the transportation sector. The shift toward sustainable mobility solutions has driven higher adoption of these batteries as stricter emission policies and increased awareness of eco-friendly alternatives gain momentum. The consistent improvement in battery technology, including better energy storage capacity, faster charging, and enhanced lifespan, supports the growing need for efficient energy solutions in the transportation sector.
Regionally, the U.S. is expected to dominate the traction battery market, surpassing USD 65.7 billion by 2034. A strong focus on sustainable energy strategies, coupled with favorable government initiatives and technological innovations, is propelling market growth. The development of advanced battery technologies continues to enhance energy efficiency and align with broader environmental goals.
Table of Contents
Chapter 1 Methodology & Scope
- 1.1 Market definition
- 1.2 Base estimates & calculations
- 1.3 Forecast calculation
- 1.4 Data sources
- 1.4.1 Primary
- 1.4.2 Secondary
- 1.4.2.1 Paid
- 1.4.2.2 Public
Chapter 2 Executive Summary
- 2.1 Industry synopsis, 2021 – 2034
Chapter 3 Industry Insights
- 3.1 Industry ecosystem analysis
- 3.2 Regulatory landscape
- 3.3 Industry impact forces
- 3.3.1 Growth drivers
- 3.3.2 Industry pitfalls & challenges
- 3.4 Growth potential analysis
- 3.5 Porter's analysis
- 3.5.1 Bargaining power of suppliers
- 3.5.2 Bargaining power of buyers
- 3.5.3 Threat of new entrants
- 3.5.4 Threat of substitutes
- 3.6 PESTEL analysis
Chapter 4 Competitive landscape, 2024
- 4.1 Strategic dashboard
- 4.2 Innovation & sustainability landscape
Chapter 5 Market Size and Forecast, By Chemistry, 2021 – 2034 (USD Million)
- 5.1 Key trends
- 5.2 Lead acid
- 5.3 Lithium-ion
- 5.4 Nickel-based
- 5.5 Others
Chapter 6 Market Size and Forecast, By Application, 2021 – 2034 (USD Million)
- 6.1 Key trends
- 6.2 Electric vehicles
- 6.2.1 BEV
- 6.2.2 PHEV
- 6.3 Industrial
- 6.3.1 Forklifts
- 6.3.2 Railroads
- 6.3.3 Others
- 6.4 E-bike
- 6.4.1 E-scooters
- 6.4.2 E-motorcycles
Chapter 7 Market Size and Forecast, By Region, 2021 – 2034 (USD million)
- 7.1 Key trends
- 7.2 North America
- 7.2.1 U.S.
- 7.2.2 Canada
- 7.2.3 Mexico
- 7.3 Europe
- 7.3.1 UK
- 7.3.2 France
- 7.3.3 Germany
- 7.3.4 Italy
- 7.3.5 Russia
- 7.3.6 Spain
- 7.4 Asia Pacific
- 7.4.1 China
- 7.4.2 Australia
- 7.4.3 India
- 7.4.4 Japan
- 7.4.5 South Korea
- 7.5 Middle East & Africa
- 7.5.1 Saudi Arabia
- 7.5.2 UAE
- 7.5.3 Turkey
- 7.5.4 South Africa
- 7.5.5 Egypt
- 7.6 Latin America
- 7.6.1 Brazil
- 7.6.2 Argentina
Chapter 8 Company Profiles
- 8.1 Aliant Battery
- 8.2 Amara Raja Batteries
- 8.3 BYD
- 8.4 Camel Group
- 8.5 Ecovolta
- 8.6 EnerSys
- 8.7 Exide Industries
- 8.8 Farasis Energy
- 8.9 Guoxuan High-tech Power Energy
- 8.10 Hitachi Energy
- 8.11 Hoppecke Batteries
- 8.12 LG Energy
- 8.13 Midac
- 8.14 Mutlu
- 8.15 Panasonic
- 8.16 Samsung
- 8.17 Sunwoda Electronic
- 8.18 Toshiba

