
PUBLISHER: Global Market Insights Inc. | PRODUCT CODE: 1892791

PUBLISHER: Global Market Insights Inc. | PRODUCT CODE: 1892791
Non-woven Abrasives Market Opportunity, Growth Drivers, Industry Trend Analysis, and Forecast 2026 - 2035
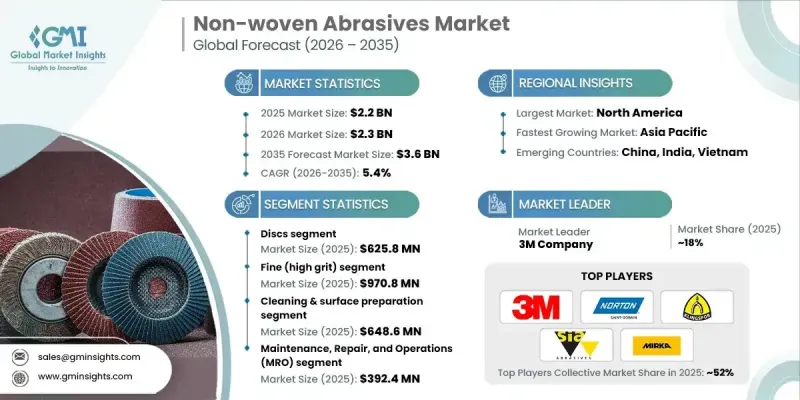
The Global Non-woven Abrasives Market was valued at USD 2.2 billion in 2025 and is estimated to grow at a CAGR of 5.4% to reach USD 3.6 billion by 2035.
Non-woven abrasives are engineered, three-dimensional products created by combining synthetic fibers, bonding resins, and abrasive minerals into open-web structures that ensure consistent finishing performance across industrial and consumer applications. These products use nylon, polyester, or synthetic fiber matrices embedded with aluminum oxide, silicon carbide, or ceramic abrasive grains, bonded with resin systems to guarantee uniform mineral distribution and controlled cutting action. The portfolio includes hand pads, belts, discs, sheets, rolls, wheels, brushes, and specialty formats, with grit grades ranging from coarse (40-80) to ultra-fine (600+). Precision manufacturing processes, including fiber web formation, resin saturation, mineral coating, curing, and converting, deliver consistent density, conformability, and load resistance. Advancements in synthetic fiber engineering, mineral technology, and bonding chemistries have improved conformability and surface contact, enabling superior finishing on complex geometries and contoured surfaces.
| Market Scope | |
|---|---|
| Start Year | 2025 |
| Forecast Year | 2026-2035 |
| Start Value | $2.2 Billion |
| Forecast Value | $3.6 Billion |
| CAGR | 5.4% |
The discs segment generated USD 625.8 million in 2025, maintaining demand due to their versatility, compatibility with various power tools, and ability to conform to curved surfaces. Available in multiple diameters, grit grades, and mounting types, discs are widely used in metalworking, aluminum preparation, and composite processing across manufacturing and maintenance operations.
The fine (high grit) abrasives segment reached USD 970.8 million in 2025, driven by their importance in surface polishing, aesthetic finishing, and precision manufacturing. Representing nearly 45% of the market value, high-grit products enable controlled material removal with minimal surface damage, supporting applications in automotive refinishing, stainless steel polishing, and decorative surface treatments. Grit equivalents from 180 to 600+ ensure effective finishing for clearcoat blending, chrome finishing, and mirror-polish operations in quality-driven facilities.
U.S. Non-woven Abrasives Market reached USD 551.5 million in 2025. Growth is driven by the country's established automotive and aerospace industries, advanced metalworking, and fabrication sectors. Emphasis on precision finishing for automated manufacturing, surface preparation, and maintenance operations, combined with robust professional-grade product adoption, strengthens market demand. Major manufacturers such as 3M, Saint-Gobain, and PFERD maintain production facilities and extensive distribution networks in the U.S., while emerging requirements in electric vehicle manufacturing further boost demand for specialized abrasives designed for aluminum and composite materials.
Key players in the Global Non-woven Abrasives Market include Saint-Gobain Abrasives / Norton, 3M Company, PFERD Inc., Klingspor Abrasives, Sia Abrasives Industries AG, Mirka Ltd., Osborn International / Osborn LLC, DEWALT (Stanley Black & Decker), Hermes Abrasives, Weiler Abrasives, RHODIUS Abrasives, Nihon Kenshi Co., Ltd., Walter Surface Technologies, Carborundum Universal Limited (CUMI), and ARC Abrasives, Inc. Companies in the Non-woven Abrasives Market strengthen their market presence by investing in R&D to develop advanced fiber matrices, engineered abrasive minerals, and innovative bonding chemistries. They focus on expanding product portfolios to cater to diverse industrial applications while enhancing grit uniformity and conformability. Strategic collaborations with OEMs, industrial distributors, and specialty manufacturers enable broader market reach.
Table of Contents
Chapter 1 Methodology & Scope
- 1.1 Market scope and definition
- 1.2 Research design
- 1.2.1 Research approach
- 1.2.2 Data collection methods
- 1.3 Data mining sources
- 1.3.1 Global
- 1.3.2 Regional/Country
- 1.4 Base estimates and calculations
- 1.4.1 Base year calculation
- 1.4.2 Key trends for market estimation
- 1.5 Primary research and validation
- 1.5.1 Primary sources
- 1.6 Forecast model
- 1.7 Research assumptions and limitations
Chapter 2 Executive Summary
- 2.1 Industry 3600 synopsis
- 2.2 Key market trends
- 2.2.1 Product
- 2.2.2 Abrasive Grade
- 2.2.3 Application
- 2.2.4 End use
- 2.2.5 Distribution Channel
- 2.2.6 Regional
- 2.3 TAM Analysis, 2025-2035
- 2.4 CXO perspectives: Strategic imperatives
- 2.4.1 Executive decision points
- 2.4.2 Critical success factors
- 2.5 Future outlook and strategic recommendations
Chapter 3 Industry Insights
- 3.1 Industry ecosystem analysis
- 3.1.1 Supplier landscape
- 3.1.2 Profit margin
- 3.1.3 Value addition at each stage
- 3.1.4 Factor affecting the value chain
- 3.1.5 Disruptions
- 3.2 Industry impact forces
- 3.2.1 Growth drivers
- 3.2.2 Industry pitfalls and challenges
- 3.2.3 Market opportunities
- 3.3 Growth potential analysis
- 3.4 Regulatory landscape
- 3.4.1 North America
- 3.4.2 Europe
- 3.4.3 Asia Pacific
- 3.4.4 Latin America
- 3.4.5 Middle East & Africa
- 3.5 Porter's analysis
- 3.6 PESTEL analysis
- 3.7 Technology and innovation landscape
- 3.7.1 Current technological trends
- 3.7.2 Emerging technologies
- 3.8 Price trends
- 3.8.1 By region
- 3.8.2 By product
- 3.9 Future market trends
- 3.10 Technology and innovation landscape
- 3.10.1 Current technological trends
- 3.10.2 Emerging technologies
- 3.11 Patent landscape
- 3.12 Trade statistics (HS code) ( Note: the trade statistics will be provided for key countries only)
- 3.12.1 Major importing countries
- 3.12.2 Major exporting countries
- 3.13 Sustainability and environmental aspects
- 3.13.1 Sustainable practices
- 3.13.2 Waste reduction strategies
- 3.13.3 Energy efficiency in production
- 3.13.4 Eco-friendly initiatives
- 3.14 Carbon footprint consideration
Chapter 4 Competitive Landscape, 2025
- 4.1 Introduction
- 4.2 Company market share analysis
- 4.2.1 By region
- 4.2.1.1 North America
- 4.2.1.2 Europe
- 4.2.1.3 Asia Pacific
- 4.2.1.4 LATAM
- 4.2.1.5 MEA
- 4.2.1 By region
- 4.3 Company matrix analysis
- 4.4 Competitive analysis of major market players
- 4.5 Competitive positioning matrix
- 4.6 Key developments
- 4.6.1 Mergers & acquisitions
- 4.6.2 Partnerships & collaborations
- 4.6.3 New product launches
- 4.6.4 Expansion plans
Chapter 5 Market Estimates and Forecast, By Product, 2022-2035 (USD Billion) (Tons)
- 5.1 Key trends
- 5.2 Hand pads
- 5.3 Belts
- 5.4 Discs
- 5.5 Sheets & rolls
- 5.6 Wheels
- 5.7 Brushes
- 5.8 Specialty abrasives
Chapter 6 Market Estimates and Forecast, By Abrasive Grade, 2022-2035 (USD Billion) (Tons)
- 6.1 Key trends
- 6.2 Coarse (low grit)
- 6.3 Medium (medium grit)
- 6.4 Fine (high grit)
Chapter 7 Market Estimates and Forecast, By Application, 2022-2035 (USD Billion) (Tons)
- 7.1 Key trends
- 7.2 Cleaning & surface preparation
- 7.3 Deburring & edge rounding
- 7.4 Surface conditioning & blending
- 7.5 Sanding & shaping
- 7.6 Finishing & polishing
Chapter 8 Market Estimates and Forecast, By End Use, 2022-2035 (USD Billion) (Tons)
- 8.1 Key trends
- 8.2 Household
- 8.3 Maintenance, repair, and operations (MRO)
- 8.4 Marine
- 8.5 Metalworking
- 8.6 Automotive
- 8.7 Aerospace
- 8.8 Woodworking
- 8.9 Construction
- 8.10 Electronics
- 8.11 Others
Chapter 9 Market Estimates and Forecast, By Distribution Channel, 2022-2035 (USD Billion) (Tons)
- 9.1 Key trends
- 9.2 Direct sales
- 9.3 Online retailers
- 9.4 Hardware stores
- 9.5 Industrial supply stores
- 9.6 Others
Chapter 10 Market Estimates and Forecast, By Region, 2022-2035 (USD Billion) (Tons)
- 10.1 Key trends
- 10.2 North America
- 10.2.1 U.S.
- 10.2.2 Canada
- 10.3 Europe
- 10.3.1 Germany
- 10.3.2 UK
- 10.3.3 France
- 10.3.4 Spain
- 10.3.5 Italy
- 10.3.6 Rest of Europe
- 10.4 Asia Pacific
- 10.4.1 China
- 10.4.2 India
- 10.4.3 Japan
- 10.4.4 Australia
- 10.4.5 South Korea
- 10.4.6 Rest of Asia Pacific
- 10.5 Latin America
- 10.5.1 Brazil
- 10.5.2 Mexico
- 10.5.3 Argentina
- 10.5.4 Rest of Latin America
- 10.6 Middle East and Africa
- 10.6.1 Saudi Arabia
- 10.6.2 South Africa
- 10.6.3 UAE
- 10.6.4 Rest of Middle East and Africa
Chapter 11 Company Profiles
- 11.1 3M Company
- 11.2 Saint-Gobain Abrasives / Norton
- 11.3 Klingspor Abrasives
- 11.4 Sia Abrasives Industries AG
- 11.5 Mirka Ltd.
- 11.6 Carborundum Universal Limited (CUMI)
- 11.7 PFERD Inc. / PFERD GmbH & Co. KG
- 11.8 Osborn International / Osborn LLC
- 11.9 DEWALT (Stanley Black & Decker)
- 11.10 Hermes Abrasives (Hermes Schleifmittel GmbH)
- 11.11 Weiler Abrasives
- 11.12 RHODIUS Abrasives
- 11.13 Nihon Kenshi Co., Ltd.
- 11.14 Walter Surface Technologies
- 11.15 ARC Abrasives, Inc.

