
PUBLISHER: Global Market Insights Inc. | PRODUCT CODE: 1699405

PUBLISHER: Global Market Insights Inc. | PRODUCT CODE: 1699405
Clinical Trials Market Opportunity, Growth Drivers, Industry Trend Analysis, and Forecast 2025-2034
The Global Clinical Trials Market was valued at USD 59 billion in 2024 and is projected to grow at a CAGR of 5.2% between 2025 and 2034. The rising demand for advanced treatment options, coupled with increasing investments in drug development, is driving market expansion. As chronic diseases such as cancer, diabetes, and cardiovascular conditions become more prevalent, pharmaceutical and biotechnology companies are ramping up their efforts to introduce innovative therapies. The surge in clinical research activity reflects a broader shift toward precision medicine and targeted treatments, further fueling growth in the clinical trials sector. Additionally, technological advancements such as artificial intelligence (AI), big data analytics, and decentralized trials are transforming clinical research, making trials more efficient and cost-effective. Regulatory support for fast-track drug approvals and increased collaboration between research institutions and healthcare providers are also contributing to market expansion. With an increasing focus on patient-centric approaches and adaptive trial designs, the clinical trials market is set to witness significant evolution in the coming years.
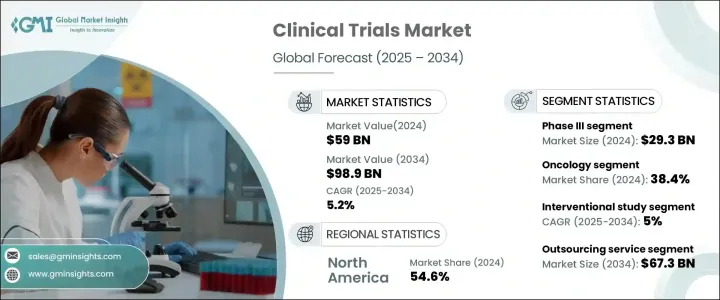
The clinical trials market is segmented by phase into Phase I, II, III, and IV. Among these, Phase III dominates the sector, accounting for USD 29.3 billion in 2024. These large-scale trials are critical for validating a drug's safety and efficacy before regulatory approval. Given their complexity and the need for diverse patient populations, Phase III studies are conducted across multiple locations to generate comprehensive clinical data. As companies push forward with novel drug formulations and biosimilars, the demand for extensive Phase III trials continues to rise, reinforcing this segment's leading position in the market.
| Market Scope | |
|---|---|
| Start Year | 2024 |
| Forecast Year | 2025-2034 |
| Start Value | $59 Billion |
| Forecast Value | $98.9 Billion |
| CAGR | 5.2% |
Based on study design, clinical trials are categorized into interventional, observational, and expanded access studies. The interventional study segment led the market in 2024 and is anticipated to grow at a CAGR of 5% from 2025 to 2034. These studies play a pivotal role in determining the efficacy of new medical interventions by actively involving participants in controlled treatment protocols. By eliminating recall bias and offering a structured evaluation of treatment outcomes, interventional trials provide the highest level of clinical evidence. As a result, pharmaceutical companies and regulatory bodies increasingly rely on these studies to accelerate drug approvals and enhance treatment standards.
North America Clinical Trials Market held a 54.6% share in 2024, maintaining its dominance due to a high concentration of pharmaceutical and biotechnology companies. With the growing complexity of drug development, particularly in precision medicine and biologics, companies across the region are investing heavily in clinical trials to bring next-generation treatments to market. Strong regulatory frameworks, well-established research infrastructure, and increased funding for clinical studies further support North America's leadership in the sector. As demand for innovative therapies escalates, the region is poised for continued growth, reinforcing its pivotal role in global clinical research.
Table of Contents
Chapter 1 Methodology and Scope
- 1.1 Market scope and definitions
- 1.2 Research design
- 1.2.1 Research approach
- 1.2.2 Data collection methods
- 1.3 Base estimates and calculations
- 1.3.1 Base year calculation
- 1.3.2 Key trends for market estimation
- 1.4 Forecast model
- 1.5 Primary research and validation
- 1.5.1 Primary sources
- 1.5.2 Data mining sources
Chapter 2 Executive Summary
- 2.1 Industry 3600 synopsis
Chapter 3 Industry Insights
- 3.1 Industry ecosystem analysis
- 3.2 Industry impact forces
- 3.2.1 Growth drivers
- 3.2.1.1 Increasing prevalence of chronic diseases across the globe
- 3.2.1.2 Growing demand for outsourcing clinical trials to CROs
- 3.2.1.3 Rise in government and non-government funding for clinical trials
- 3.2.1.4 Growing opportunities for conducting clinical trials in countries of Asia Pacific
- 3.2.2 Industry pitfalls and challenges
- 3.2.2.1 Lack of skilled workforce in clinical research
- 3.2.2.2 Infrastructural barriers in developing countries
- 3.2.2.3 Challenges faced in North America and Europe for conducting clinical trials
- 3.2.1 Growth drivers
- 3.3 Growth potential analysis
- 3.4 Clinical trials volume analysis
- 3.4.1 Clinical trials volume analysis, by region, 2021 - 2024
- 3.4.2 Clinical trials volume analysis, by phase of development, 2021 - 2024
- 3.4.3 Clinical trials volume analysis, by indication, 2021 - 2024
- 3.5 Regulatory landscape
- 3.5.1 U.S.
- 3.5.2 Europe
- 3.5.3 Asia Pacific
- 3.5.3.1 Singapore
- 3.5.3.2 Malaysia
- 3.5.3.3 Indonesia
- 3.5.3.4 Thailand
- 3.5.3.5 South Korea
- 3.5.3.6 Philippines
- 3.6 Clinical trials - Asia Pacific advantage
- 3.7 Porters analysis
- 3.8 PESTEL analysis
Chapter 4 Competitive Landscape, 2024
- 4.1 Introduction
- 4.2 Company matrix analysis
- 4.3 Merger and acquisition landscape
- 4.4 Competitive analysis of major market players
- 4.5 Competitive positioning matrix
- 4.6 Strategy dashboard
Chapter 5 Market Estimates and Forecast, By Phase, 2021 – 2034 ($ Mn)
- 5.1 Key trends
- 5.2 Phase I
- 5.3 Phase II
- 5.4 Phase III
- 5.5 Phase IV
Chapter 6 Market Estimates and Forecast, By Study Design, 2021 – 2034 ($ Mn)
- 6.1 Key trends
- 6.2 Interventional study
- 6.3 Observational study
- 6.4 Expanded access study
Chapter 7 Market Estimates and Forecast, By Service Type, 2021 – 2034 ($ Mn)
- 7.1 Key trends
- 7.2 Outsourcing service
- 7.3 In-house service
Chapter 8 Market Estimates and Forecast, By Therapeutic Area, 2021 – 2034 ($ Mn)
- 8.1 Key trends
- 8.2 Autoimmune disease
- 8.3 Oncology
- 8.4 Cardiology
- 8.5 Infectious disease
- 8.6 Dermatology
- 8.7 Ophthalmology
- 8.8 Neurology
- 8.9 Hematology
- 8.10 Other therapeutic areas
Chapter 9 Market Estimates and Forecast, By Region, 2021 – 2034 ($ Mn)
- 9.1 Key trends
- 9.2 North America
- 9.2.1 U.S.
- 9.2.2 Canada
- 9.3 Europe
- 9.3.1 Germany
- 9.3.2 UK
- 9.3.3 France
- 9.3.4 Spain
- 9.3.5 Italy
- 9.3.6 Poland
- 9.3.7 Netherlands
- 9.3.8 Switzerland
- 9.4 Asia Pacific
- 9.4.1 China
- 9.4.2 Japan
- 9.4.3 India
- 9.4.4 Australia
- 9.4.5 South Korea
- 9.4.6 Singapore
- 9.4.7 Malaysia
- 9.4.8 Indonesia
- 9.4.9 Thailand
- 9.4.10 Philippines
- 9.5 Latin America
- 9.5.1 Brazil
- 9.5.2 Mexico
- 9.5.3 Argentina
- 9.6 Middle East and Africa
- 9.6.1 Saudi Arabia
- 9.6.2 South Africa
- 9.6.3 UAE
Chapter 10 Company Profiles
- 10.1 Charles River Laboratories
- 10.2 Clinipace
- 10.3 Eli Lilly and Company
- 10.4 ICON
- 10.5 IQVIA
- 10.6 Laboratory Corporation of America Holdings (Covance Inc)
- 10.7 Medpace
- 10.8 Merck & Co
- 10.9 Parexel International Corporation
- 10.10 Pfizer
- 10.11 SGS SA
- 10.12 Syneos Health
- 10.13 The Emmes Company
- 10.14 Thermo Fisher Scientific (PPD)
- 10.15 Veeda Clinical Research
- 10.16 Worldwide Clinical Trials
- 10.17 WuXi AppTech

