
PUBLISHER: Global Market Insights Inc. | PRODUCT CODE: 1801914

PUBLISHER: Global Market Insights Inc. | PRODUCT CODE: 1801914
PEM Electrolyzer Market Opportunity, Growth Drivers, Industry Trend Analysis, and Forecast 2025 - 2034
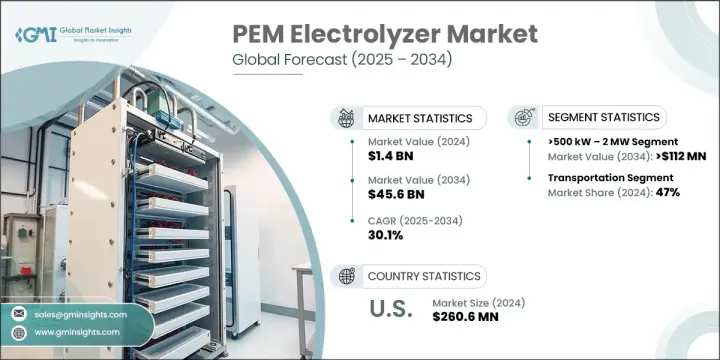
The Global PEM Electrolyzer Market was valued at USD 1.4 billion in 2024 and is estimated to grow at a CAGR of 30.1% to reach USD 45.6 billion by 2034. This growth is largely fueled by the accelerating demand for clean hydrogen across industrial, transport, and power sectors. As global industries seek to lower carbon emissions, the shift toward low-carbon feedstock is becoming imperative, especially in energy-intensive sectors like refining, steel, and ammonia production.
Proton exchange membrane (PEM) electrolyzers are gaining significant traction due to their ability to deliver high-purity hydrogen efficiently and their compatibility with fluctuating energy inputs, particularly from renewable sources. Supportive policies, emission reduction mandates, and large-scale public-private investments in hydrogen infrastructure are creating favorable conditions for widespread adoption. Upgrades in gas pipeline infrastructure and distribution networks are expected to bring down the cost of hydrogen delivery, further promoting the adoption of PEM systems.
| Market Scope | |
|---|---|
| Start Year | 2024 |
| Forecast Year | 2025-2034 |
| Start Value | $1.4 Billion |
| Forecast Value | $45.6 Billion |
| CAGR | 30.1% |
PEM electrolyzers function by splitting water into hydrogen and oxygen using electricity via a proton exchange membrane. Their operational flexibility across variable loads makes them ideal for integration with renewable energy sources such as wind and solar, allowing for reliable green hydrogen production across multiple sectors.
The >500 kW - 2 MW capacity range is projected to exceed USD 112 million in value by 2034. This growth is fueled by the segment's scalability and increasing use in mid-scale industrial hydrogen production. These systems are especially favored in facilities requiring backup power, fueling stations, and medium-scale industrial operations due to their efficient footprint and adaptability. Their balance of size and output makes them an ideal solution for emerging applications in renewable energy integration, power reliability, and on-site fuel generation.
The transportation segment held a 47% share and is forecasted to grow at a CAGR of 24% through 2034. Increasing deployment of fuel cell electric vehicles, alongside rapid developments in hydrogen refueling infrastructure, continues to strengthen demand for PEM electrolyzers in mobility solutions. Their ability to produce high-purity hydrogen makes them essential for transportation networks focused on sustainability and emission reduction, supporting large-scale green mobility goals.
Europe PEM Electrolyzer Market will reach USD 17.5 billion by 2034, driven by considerable investments and strong regulatory backing for hydrogen development. The region is pushing forward with widespread infrastructure implementation to support hydrogen production and use across multiple sectors. These efforts align with broader decarbonization targets, with public and private funding accelerating hydrogen-related deployment and integration at scale.
Key companies shaping the Global PEM Electrolyzer Market include Siemens Energy, Plug Power, Air Products & Chemicals, Cummins, and Nel ASA. To expand their market reach and reinforce competitive positioning, PEM electrolyzer manufacturers are adopting several focused strategies. Companies are scaling their manufacturing capacities to meet growing global demand and lowering production costs through process innovation. Strategic partnerships with utility providers and renewable energy developers are helping align electrolyzer deployment with clean power generation. Businesses are also investing in R&D to enhance membrane durability, reduce energy consumption, and boost system efficiency. Additionally, firms are entering long-term supply agreements and joint ventures to secure raw material access and strengthen their hydrogen value chain presence globally.
Table of Contents
Chapter 1 Methodology & Scope
- 1.1 Research design
- 1.2 Base estimates & calculations
- 1.3 Forecast model
- 1.4 Primary research & validation
- 1.4.1 Primary sources
- 1.4.2 Data mining sources
- 1.5 Market definitions
Chapter 2 Executive Summary
- 2.1 Industry 3600 synopsis, 2021 - 2034
- 2.2 Business trends
- 2.3 Capacity trends
- 2.4 Application trends
- 2.5 Regional trends
Chapter 3 Industry Insights
- 3.1 Industry ecosystem
- 3.2 Price trend analysis, 2021-2034
- 3.2.1 By production method
- 3.2.2 By region
- 3.3 Cost structure analysis
- 3.4 Regulatory landscape
- 3.5 Industry impact forces
- 3.5.1 Growth drivers
- 3.5.2 Industry pitfalls & challenges
- 3.6 Growth potential analysis
- 3.7 Porter's analysis
- 3.7.1 Bargaining power of suppliers
- 3.7.2 Bargaining power of buyers
- 3.7.3 Threat of new entrants
- 3.7.4 Threat of substitutes
- 3.8 PESTEL analysis
- 3.8.1 Political factors
- 3.8.2 Economic factors
- 3.8.3 Social factors
- 3.8.4 Technological factors
- 3.8.5 Legal factors
- 3.8.6 Environmental factors
Chapter 4 Competitive landscape, 2025
- 4.1 Introduction
- 4.2 Company market share analysis, by region, 2024
- 4.2.1 North America
- 4.2.2 Europe
- 4.2.3 Asia Pacific
- 4.2.4 Rest of World
- 4.3 Strategic dashboard
- 4.4 Strategic initiatives
- 4.5 Company benchmarking
- 4.6 Innovation & technology landscape
Chapter 5 Market Size and Forecast, By Capacity, 2021 - 2034 (USD Million & MW)
- 5.1 Key trends
- 5.2 ≤ 500 kW
- 5.3 > 500 kW - 2 MW
- 5.4 > 2 MW - 5 MW
- 5.5 Above 5 MW
Chapter 6 Market Size and Forecast, By Application, 2021 - 2034 (USD Million & MW)
- 6.1 Key trends
- 6.2 Power generation
- 6.3 Transportation
- 6.4 Industry energy
- 6.5 Industry feedstock
- 6.6 Building heating & power
- 6.7 Others
Chapter 7 Market Size and Forecast, By Region, 2021 - 2034 (USD Million & MW)
- 7.1 Key trends
- 7.2 North America
- 7.2.1 U.S.
- 7.2.2 Canada
- 7.3 Europe
- 7.3.1 Germany
- 7.3.2 UK
- 7.3.3 France
- 7.3.4 Italy
- 7.3.5 Netherlands
- 7.3.6 Denmark
- 7.3.7 Spain
- 7.3.8 Norway
- 7.4 Asia Pacific
- 7.4.1 China
- 7.4.2 Japan
- 7.4.3 India
- 7.4.4 Australia
- 7.5 Rest of World
Chapter 8 Company Profiles
- 8.1 Air Liquide
- 8.2 Air Products and Chemicals
- 8.3 Bosch GmbH
- 8.4 Cummins
- 8.5 Elogen
- 8.6 Erre Due
- 8.7 Giner
- 8.8 GreenH
- 8.9 H2B2
- 8.10 Hygear
- 8.11 Hystar
- 8.12 ITM Power
- 8.13 LARSEN & TOUBRO LIMITED
- 8.14 Mcphy energy
- 8.15 Nel ASA
- 8.16 Next hydrogen
- 8.17 Ohmium
- 8.18 Ostermeier H2ydrogen Solutions
- 8.19 Plug Power
- 8.20 Siemens Energy

