
PUBLISHER: Global Market Insights Inc. | PRODUCT CODE: 1667173

PUBLISHER: Global Market Insights Inc. | PRODUCT CODE: 1667173
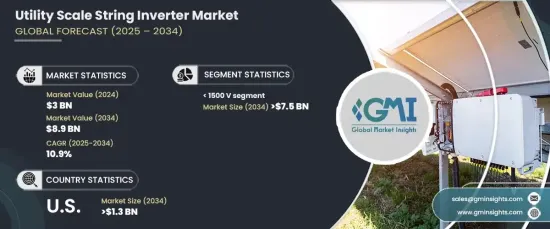
Utility Scale String Inverter Market Opportunity, Growth Drivers, Industry Trend Analysis, and Forecast 2025 - 2034
The Global Utility Scale String Inverter Market was valued at USD 3 billion in 2024 and is projected to expand at a CAGR of 10.9% from 2025 to 2034. These inverters are critical in large-scale solar photovoltaic (PV) systems, converting the direct current (DC) power generated by solar panels into alternating current (AC), which is suitable for the electric grid. As solar technology continues to evolve, the market for utility-scale string inverters is gaining significant traction. Factors such as government incentives, declining costs, and a growing awareness of environmentally friendly energy sources are accelerating adoption. Additionally, the shift toward self-generated electricity and the rise of distributed generation systems are opening up new growth avenues in the solar power industry.
Ongoing advancements in technology are further fueling the market's growth. Manufacturers are investing in innovations aimed at enhancing the performance, efficiency, and reliability of utility-scale string inverters. A key focus is the development of inverters with integrated monitoring and diagnostic features, which improve system performance while minimizing maintenance costs. Another important trend is the integration of energy storage systems with these inverters, which is becoming a key factor in boosting their market presence. With increasing demand for more sustainable and efficient energy solutions, the utility-scale string inverter market is positioned for continued growth.
| Market Scope | |
|---|---|
| Start Year | 2024 |
| Forecast Year | 2025-2034 |
| Start Value | $3 Billion |
| Forecast Value | $8.9 Billion |
| CAGR | 10.9% |
The market is divided into two key voltage segments: 1500 V and >=1500 V. The 1500 V segment is expected to surpass USD 7.5 billion by 2034, driven by its low maintenance needs, making it a preferred choice for large-scale solar projects. The increasing focus on affordable and dependable energy solutions for applications under 1500 V is expected to propel this segment. The global move toward renewable energy is further fostering the adoption of these inverters, especially as more large-scale solar projects are being initiated worldwide.
In the United States, the market for utility-scale string inverters is anticipated to exceed USD 1.3 billion by 2034. This growth is attributed to the country's strong push for renewable energy, with government programs supporting investments in solar technologies. With a focus on reducing costs and building a more decentralized and resilient energy grid, the demand for efficient solar energy solutions, including inverters, is steadily rising.
In the Asia Pacific region, countries like China, India, Japan, and Australia are setting ambitious renewable energy targets to reduce their dependence on fossil fuels. The demand for utility-scale string inverters is growing as these countries increase the deployment of solar energy systems, especially in emerging economies where industrialization and urbanization are driving up electricity demand. As a result, utility-scale string inverters are becoming an essential component of the energy mix in the region.
Table of Contents
Chapter 1 Methodology & Scope
- 1.1 Research Design
- 1.2 Base estimates & calculations
- 1.3 Forecast model
- 1.4 Primary research & validation
- 1.4.1 Primary sources
- 1.4.2 Data mining sources
- 1.5 Market Definitions
Chapter 2 Executive Summary
- 2.1 Industry synopsis, 2021 – 2034
Chapter 3 Industry Insights
- 3.1 Industry ecosystem
- 3.2 Regulatory landscape
- 3.3 Industry impact forces
- 3.3.1 Growth drivers
- 3.3.2 Industry pitfalls & challenges
- 3.4 Growth potential analysis
- 3.5 Porter's analysis
- 3.5.1 Bargaining power of suppliers
- 3.5.2 Bargaining power of buyers
- 3.5.3 Threat of new entrants
- 3.5.4 Threat of substitutes
- 3.6 PESTEL analysis
Chapter 4 Competitive landscape, 2024
- 4.1 Introduction
- 4.2 Strategic dashboard
- 4.3 Innovation & technology landscape
Chapter 5 Market Size and Forecast, By Nominal Output Voltage, 2021 – 2034 (USD Billion & MW)
- 5.1 Key trends
- 5.2 < 1500 V
- 5.3 ≥ 1500 V
Chapter 6 Market Size and Forecast, By Region, 2021 – 2034 (USD Billion & MW)
- 6.1 Key trends
- 6.2 North America
- 6.2.1 U.S.
- 6.2.2 Canada
- 6.3 Europe
- 6.3.1 Germany
- 6.3.2 Italy
- 6.3.3 Netherlands
- 6.3.4 UK
- 6.3.5 France
- 6.4 Asia Pacific
- 6.4.1 China
- 6.4.2 Australia
- 6.4.3 India
- 6.4.4 Japan
- 6.4.5 South Korea
- 6.5 Middle East & Africa
- 6.5.1 Israel
- 6.5.2 Saudi Arabia
- 6.5.3 UAE
- 6.5.4 South Africa
- 6.6 Latin America
- 6.6.1 Brazil
- 6.6.2 Mexico
- 6.6.3 Chile
Chapter 7 Company Profiles
- 7.1 Darfon Electronics
- 7.2 Delta Electronics
- 7.3 Eaton
- 7.4 Fronius International
- 7.5 GoodWe
- 7.6 Growatt
- 7.7 Hitachi Hi-Rel Power Electronics
- 7.8 Huawei Technologies
- 7.9 Panasonic Corporation
- 7.10 Schneider Electric
- 7.11 Sofar Solar
- 7.12 Siemens
- 7.13 Sineng Electric
- 7.14 SMA Solar Technology
- 7.15 SolarEdge Technologies
- 7.16 Sungrow

