
PUBLISHER: Global Market Insights Inc. | PRODUCT CODE: 1716530

PUBLISHER: Global Market Insights Inc. | PRODUCT CODE: 1716530
Nutritional Bars Market Opportunity, Growth Drivers, Industry Trend Analysis, and Forecast 2025 - 2034
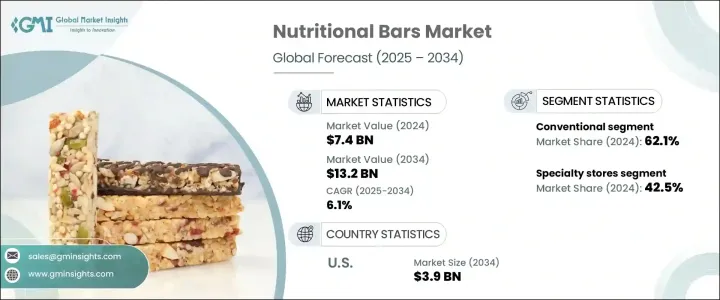
The Global Nutritional Bars Market reached USD 7.4 billion in 2024 and is projected to expand at a CAGR of 6.1% between 2025 and 2034, driven by the surging demand for healthier, on-the-go snacking options. With the rising focus on fitness, wellness, and balanced lifestyles, consumers are actively seeking convenient snacks that offer functional benefits without compromising on taste. As health awareness grows globally, people are turning to nutritional bars as an ideal alternative to traditional high-calorie snacks and processed foods. The increasing preference for protein-rich, low-sugar, gluten-free, and organic products has redefined consumer expectations, encouraging brands to deliver innovative products that align with evolving dietary needs.
Modern consumers are also paying close attention to ingredient transparency, sustainability, and ethical sourcing, prompting brands to adopt clean-label formulations with recognizable, natural ingredients. Moreover, the growing penetration of e-commerce, coupled with easy product availability in supermarkets, convenience stores, and fitness centers, continues to fuel sales of nutritional bars. As urban populations adopt fast-paced routines and prioritize holistic health, nutritional bars have emerged as a staple for consumers seeking portable nutrition, whether for pre-workout energy, meal replacement, or quick snacks during busy schedules.
| Market Scope | |
|---|---|
| Start Year | 2024 |
| Forecast Year | 2025-2034 |
| Start Value | $7.4 Billion |
| Forecast Value | $13.2 Billion |
| CAGR | 6.1% |
The market is segmented into various types of nutritional bars, including cereal/granola bars, protein bars, energy bars/meal replacement bars, fruit and nut bars, and others. Among these, cereal and granola bars dominate due to their widespread appeal as wholesome, fiber-rich snacks that provide sustained energy. As more consumers opt for better-for-you options, demand for low-sugar, high-protein, and organic variants of cereal and granola bars is gaining momentum. Brands are launching products enriched with functional ingredients like probiotics, collagen, and adaptogens to meet the rising interest in health-boosting formulations. Protein bars, in particular, are seeing heightened demand from fitness enthusiasts, athletes, and individuals seeking muscle recovery or weight management support. With consumers becoming increasingly ingredient-savvy, there is a strong preference for bars that offer clean nutrition, free from artificial additives and preservatives.
The market is also categorized into gluten-free and conventional segments. Conventional bars currently command a significant 62.1% market share, driven by broad accessibility and affordability. However, gluten-free nutritional bars are rapidly gaining traction as awareness about celiac disease, gluten intolerance, and the benefits of grain alternatives rises. Manufacturers are responding by formulating bars with nutrient-dense grains such as quinoa, amaranth, and buckwheat, which appeal to both gluten-sensitive and general health-conscious consumers. Yet, the development of gluten-free bars that balance taste, texture, and cost-effectiveness continues to be a challenge, pushing brands to invest in R&D.
U.S. Nutritional Bars Market accounted for 28% of the global share, generating USD 2.1 billion in 2024, propelled by growing consumer interest in protein-enriched and functional foods. A well-established fitness culture, coupled with heightened demand for organic, non-GMO, and clean-label products, reinforces market expansion in the U.S. Moreover, favorable government initiatives promoting healthy eating, combined with the growth of retail and e-commerce platforms, support robust sales. Nevertheless, fierce competition and high production costs remain critical challenges for brands aiming to differentiate and sustain profitability.
Table of Contents
Chapter 1 Methodology & Scope
- 1.1 Market scope & definition
- 1.2 Base estimates & calculations
- 1.3 Forecast calculation
- 1.4 Data sources
- 1.4.1 Primary
- 1.4.2 Secondary
- 1.4.2.1 Paid sources
- 1.4.2.2 Public sources
- 1.5 Primary research and validation
- 1.5.1 Primary sources
- 1.5.2 Data mining sources
Chapter 2 Executive Summary
- 2.1 Industry synopsis, 2021-2034
Chapter 3 Industry Insights
- 3.1 Industry ecosystem analysis
- 3.1.1 Factor affecting the value chain
- 3.1.2 Profit margin analysis
- 3.1.3 Disruptions
- 3.1.4 Future outlook
- 3.1.5 Manufacturers
- 3.1.6 Distributors
- 3.2 Supplier landscape
- 3.3 Profit margin analysis
- 3.4 Key news & initiatives
- 3.5 Regulatory landscape
- 3.6 Impact forces
- 3.6.1 Growth drivers
- 3.6.2 Industry pitfalls & challenges
- 3.7 Growth potential analysis
- 3.8 Porter's analysis
- 3.9 PESTEL analysis
Chapter 4 Competitive Landscape, 2024
- 4.1 Introduction
- 4.2 Company market share analysis
- 4.3 Competitive positioning matrix
- 4.4 Strategic outlook matrix
Chapter 5 Market Estimates and Forecast, By Product, 2021 – 2034 (USD Billion) (Kilo Tons)
- 5.1 Key trends
- 5.2 Cereal/Granola bars
- 5.3 Protein bars
- 5.4 Energy Bars/ Meal replacements bars
- 5.5 Fruits & nuts bars
- 5.6 Others (Diet Bars, Carbohydrate Bars, Endurance bars)
Chapter 6 Market Estimates and Forecast, By Category, 2021 – 2034 (USD Billion) (Kilo Tons)
- 6.1 Key trends
- 6.2 Gluten-free
- 6.3 Conventional
Chapter 7 Market Estimates and Forecast, By Distribution Channel, 2021 – 2034 (USD Billion) (Kilo Tons)
- 7.1 Key trends
- 7.2 Hypermarkets/Supermarkets
- 7.3 Specialty stores
- 7.4 Online retail
- 7.5 Others
Chapter 8 Market Estimates and Forecast, By Region, 2021 – 2034 (USD Billion) (Kilo Tons)
- 8.1 Key trends
- 8.2 North America
- 8.2.1 U.S.
- 8.2.2 Canada
- 8.3 Europe
- 8.3.1 Germany
- 8.3.2 UK
- 8.3.3 France
- 8.3.4 Spain
- 8.3.5 Italy
- 8.3.6 Russia
- 8.4 Asia Pacific
- 8.4.1 China
- 8.4.2 India
- 8.4.3 Japan
- 8.4.4 Australia
- 8.4.5 South Korea
- 8.5 Latin America
- 8.5.1 Brazil
- 8.5.2 Mexico
- 8.6 Middle East and Africa
- 8.6.1 Saudi Arabia
- 8.6.2 South Africa
- 8.6.3 UAE
Chapter 9 Company Profiles
- 9.1 General Mills Inc
- 9.2 Ajinomoto Co Inc
- 9.3 Cargill Incorporated
- 9.4 Mondelez International
- 9.5 Glanbia Plc
- 9.6 HEALTHY BARS
- 9.7 ADM
- 9.8 Global Nutrition International
- 9.9 The Simply Good Foods Company
- 9.10 The Kellogg Company.

